

 PDF
PDF ePub
ePub Citation
 Print
Print


INTRODUCTION
Mitochondrial disease comprises a group of disorders resulting from mitochondrial dysfunction and, in particular, from defects in the mitochondrial respiratory chain (MRC) and associated abnormal oxidative phosphorylation.12 While mitochondrial dysfunction can occur in any organ, higher incidences are recorded in organs with high-energy requirements, such as the brain, heart, liver, and skeletal muscle system.23
Among the symptoms of mitochondrial disease, neurologic symptoms are predominate, and seizures account for the greatest proportion thereof.4 Previous studies have shown that Lennox-Gastaut syndrome (LGS) accounts for a high proportion of epilepsies in mitochondrial diseases, and its prognosis is poor.56 LGS is a severe childhood-onset epileptic encephalopathy, characterized by multiple seizure types and progressive mental retardation.567 The prognosis of patients with LGS follows a catastrophic course from drug resistance to epileptic encephalopathy.6
While several studies on mitochondrial disease and LGS have been conducted before, studies on LGS with mitochondrial disease in children are scarce. Therefore, this study aimed to analyze the clinical features, diagnosis, and treatment of children with mitochondrial disease with LGS.
MATERIALS AND METHODS
Patients and study design
The medical records of pediatric patients who were diagnosed with mitochondrial disease were reviewed; the patients were followed up regularly at the Department of Pediatrics of Gangnam Severance Hospital between January 2006 and January 2016. The study population consisted of 40 patients (16.1%) diagnosed with LGS, among the 248 patients (67%) diagnosed with epilepsy and 372 patients who were diagnosed with mitochondrial disease based on the diagnostic criteria of Bernier, et al.8 The study protocol was approved by the Institutional Review Board of the Yonsei University Gangnam Severance Hospital (4-2011-0463), and written informed consent was obtained from the parents or legal guardians of all patients.
Data collection of the clinical characteristics and diagnostic evaluation for mitochondrial disease
Diagnostic evaluations for mitochondrial disease were performed by laboratory studies, histology studies, and enzymatic and imaging studies. The degree of serum lactic acidosis was defined as mild, moderate, or severe if the increase over the normal reference values was at least two-, three-, or four-fold, respectively. Data on brain magnetic resonance imaging (MRI) and magnetic resonance spectroscopy study were also collected. Muscle biopsies were performed surgically from the quadriceps muscle, and routine histologic, immunohistochemical, and electron microscopic examinations were conducted. Biochemical assays to evaluate MRC enzyme activity were also performed, defining the enzyme to be defective when residual enzyme activity was <10% of the reference value.9 Mitochondrial DNA mutation was confirmed in two patients who suffered mitochondrial encephalomyopathy, lactic acidosis, and stroke-like episodes (MELAS) and Leigh syndrome, respectively.
Data collection regarding diagnosis and treatment options for Lennox-Gastaut syndrome
The diagnostic criteria for LGS included multiple seizure types, a specific inter-ictal electroencephalogram (EEG) pattern of diffuse slow background combined with generalized slow spike wave (GSSW) in an awake state and generalized paroxysmal fast activity (GPFA) during sleep, and progressive cognitive impairment. Seizure outcomes were assessed serially according to seizure type (tonic, tonic-clonic, myoclonic, atonic, atypical absence, epileptic spasms, and focal seizures) up to and including the most recent visit.10 The treatment was divided into antiepileptic drug (AED), ketogenic diet, and surgery. Ketogenic diet was assessed based on the frequency of seizures 6 months after the start of the diet.
Patients with LGS were divided into two groups based on a history of West syndrome. The two groups were compared in terms of clinical variables. In this study, the proportion of mitochondrial disease with LGS with history of West syndrome was 32.5%.
Statistical analysis
All analyses were conducted using the Statistical Package for the Social Sciences (SPSS) version 22.0 (IBM Corp., Armonk, NY, USA). Descriptive statistics were used including the mean, standard deviation (SD), median, and range. Parametric t-tests and chi-square tests were applied to evaluate differences between groups. p values <0.05 were considered statistically significant.
RESULTS
General characteristics and clinical status of mitochondrial disease at the last visit
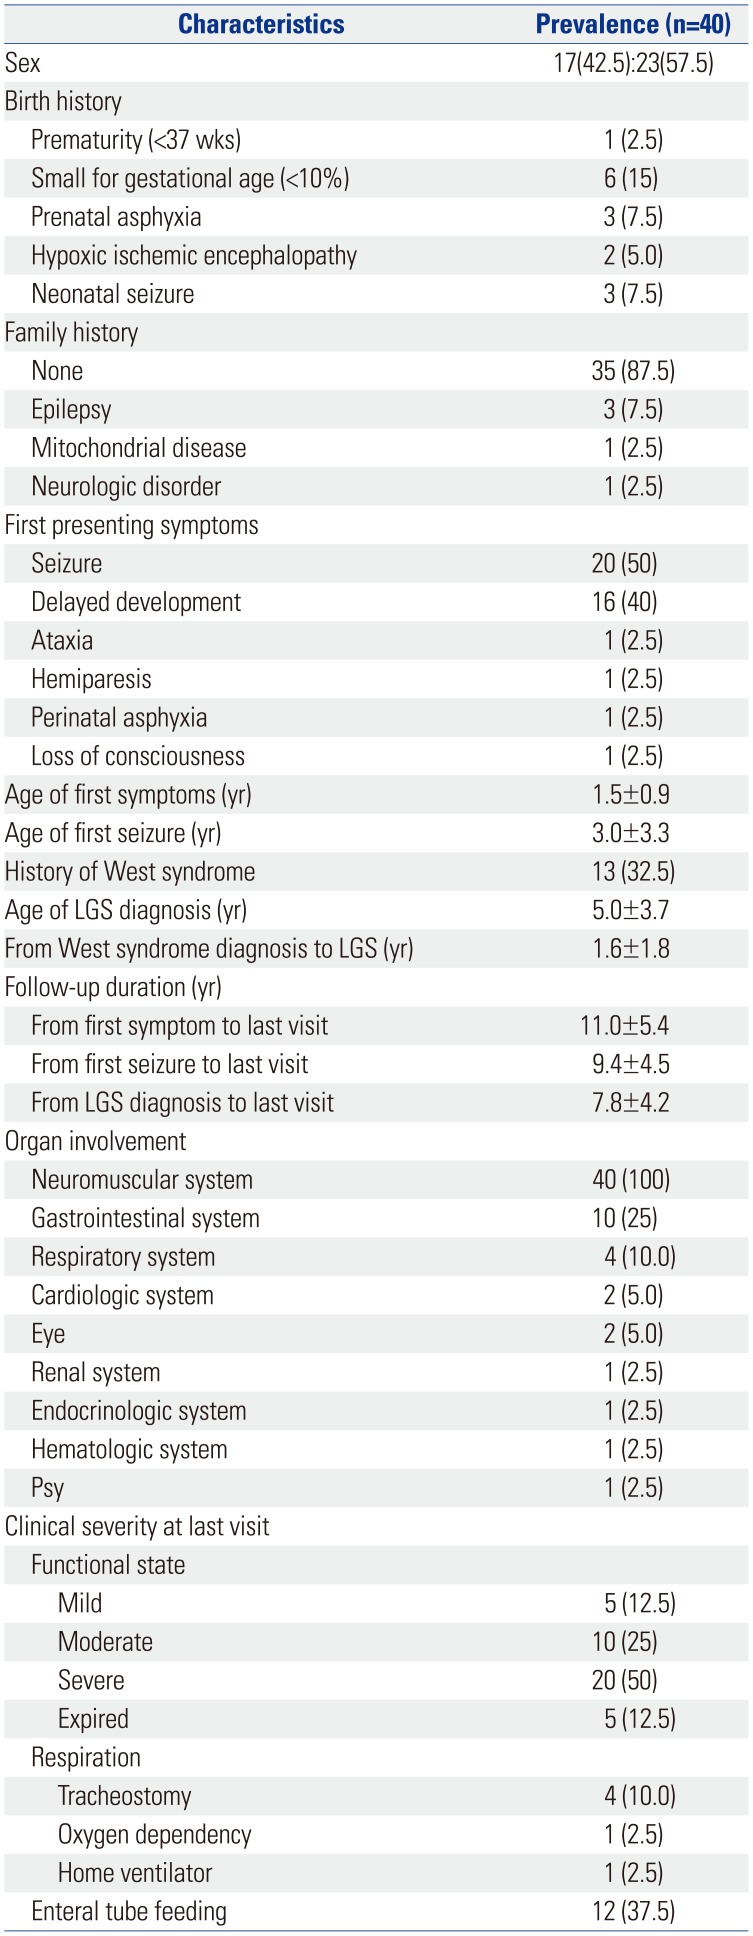
A total of 40 pediatric patients were diagnosed with LGS with mitochondrial disease (Table 1). Among the patients, 17 patients (42.5%) were male, and 23 patients (57.5%) were female. In most cases, there was no history of birth abnormality. In regards to birth history, small for gestational age was most frequently recorded.
The initial symptoms of the patients varied, and the most common first symptom was seizure (50%), followed by delayed development (40%), ataxia, hemiparesis, perinatal asphyxia, and loss of consciousness. The mean age of the occurrence of the first symptom was 1.5 years (1.5±0.9), and the mean age of the first seizure onset as an initial symptom was 3 years (3.0±3.3). The mean age of diagnosis of LGS was 5 years. Mitochondrial disease with LGS with a history of West syndrome comprised 32.5%. The duration of transition to LGS after diagnosis from West syndrome was 1.6 years (1.6±1.8). Each patient was regularly followed up at the institute. The mean duration of follow-up from the onset of the first symptom was 11 years; from the first seizure, 9.4 years; and from LGS diagnosis, 7.8 years.
All patients had involvement of the central nervous system, followed by the gastrointestinal and respiratory systems, and various organs were affected. Functional state was classified as mild for self-ambulation, moderate for wheelchair bounding, and severe for bedridden state and progressed from 60% to severe. At the last visit, respiratory assistance was required for 15% of the patients, and 37.5% of the patients were receiving enteral tube feeding.
Diagnostic evaluations of mitochondrial disease
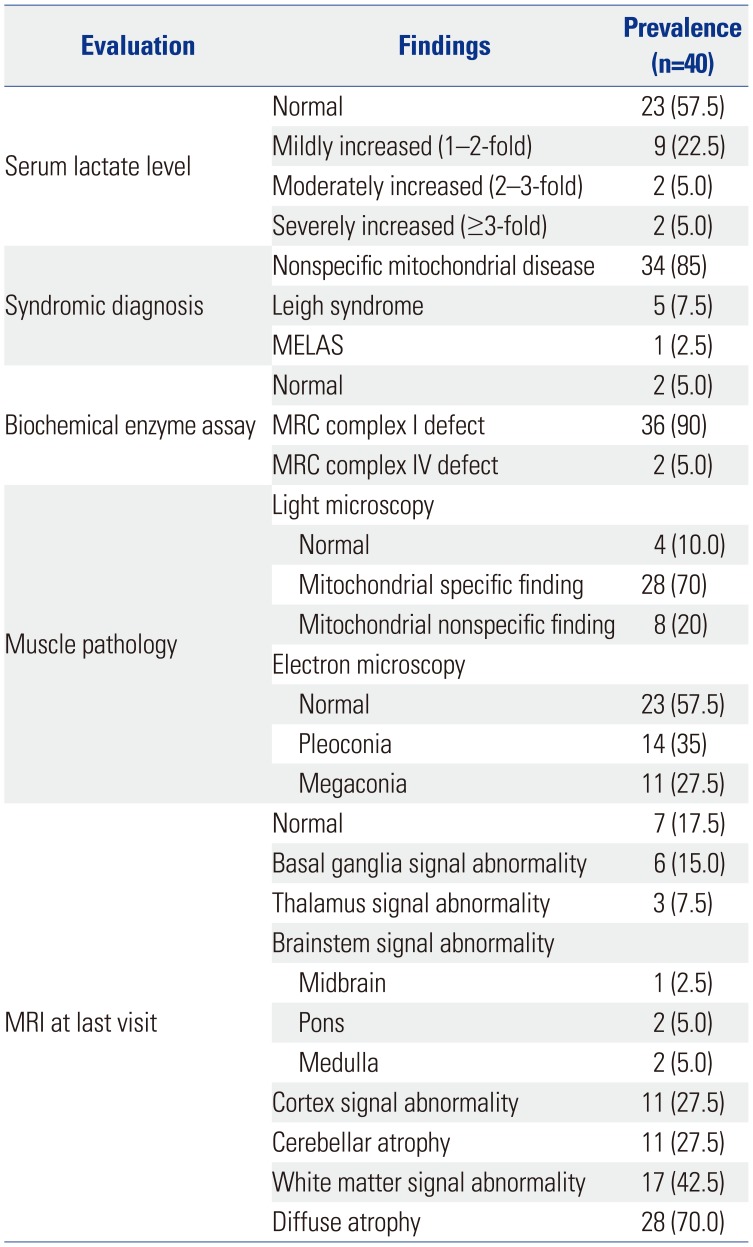
Serum lactic acid levels were increased in 13 patients (Table 2). Serum levels of lactic acid were found to be mildly increased, moderately increased, and severely increased in 22.5, 5, and 5% of patients, respectively. In terms of syndromic diagnosis, nonspecific mitochondrial disease, Leigh syndrome, and MELAS were diagnosed in 85, 7.5, and 2.5% of patients, respectively. Complex 1 of the MRC complex showed most of the defects. MRI showed abnormal findings in 82.5% of patients, with diffuse atrophy accounting for 70%.
Diagnosis of and treatment options for LGS
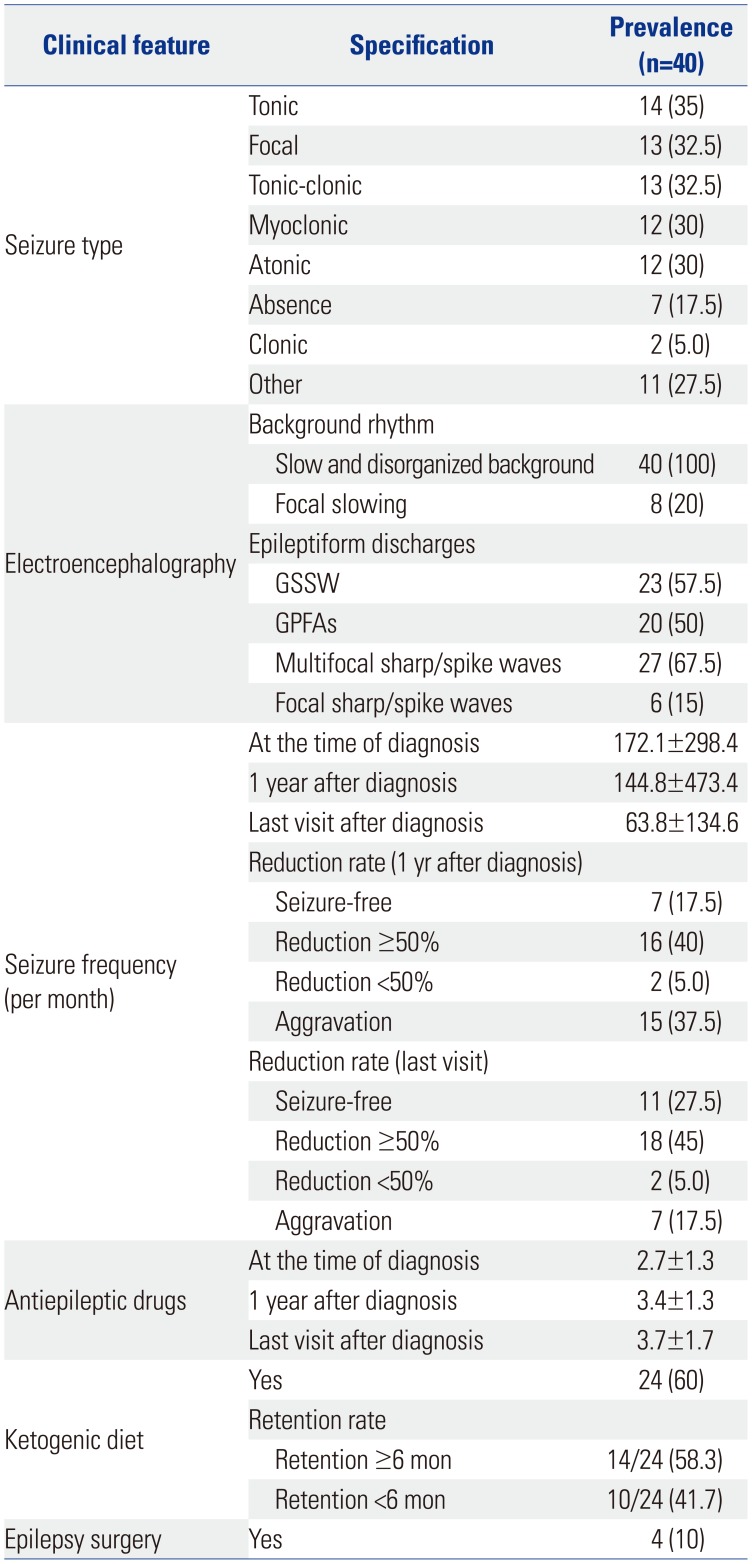
A number of seizure types was observed in 40 patients throughout their clinical course, and one patient exhibited multiple seizure types (Table 3). These consisted of the following: tonic seizures (35%), focal seizures (32.5%), tonic clonic seizures (32.5%), myoclonic seizures (30%), atonic seizure (30%), absence seizure (17.5%), clonic seizures (5%), and others (27.5%).
The EEGs of all patients showed generalized slow and disorganized back ground rhythm. Additionally, 20% of the patients showed focal slowing. For epileptiform discharges, GSSW was seen in 57.5%, GPFA in 50%, and multifocal in 67.5%.
The mean seizure frequency at the time of the diagnosis was 172.1±298.4 per month. One year after diagnosis, the mean seizure frequency was 144.8±473.4 per month, and in the last visit after diagnosis, the mean seizure frequency was 63.8±134.6 per month. Seizure outcomes for the 40 patients were as follows: seizure frequency decreased >50% at 1 year after diagnosis in 16 patients (40%), and seizure frequency decreased >50% at the time of the last visit in 18 patients (45%). The patients used 2.7±1.3 AEDs at the time of diagnosis, 3.4±1.3 AEDs at 1 year after diagnosis, and 3.7±1.7 AEDs at the last visit after diagnosis. Four patients underwent surgery, and all underwent corpus callosotomy.
Subgroup analysis in LGS with or without a history of West syndrome
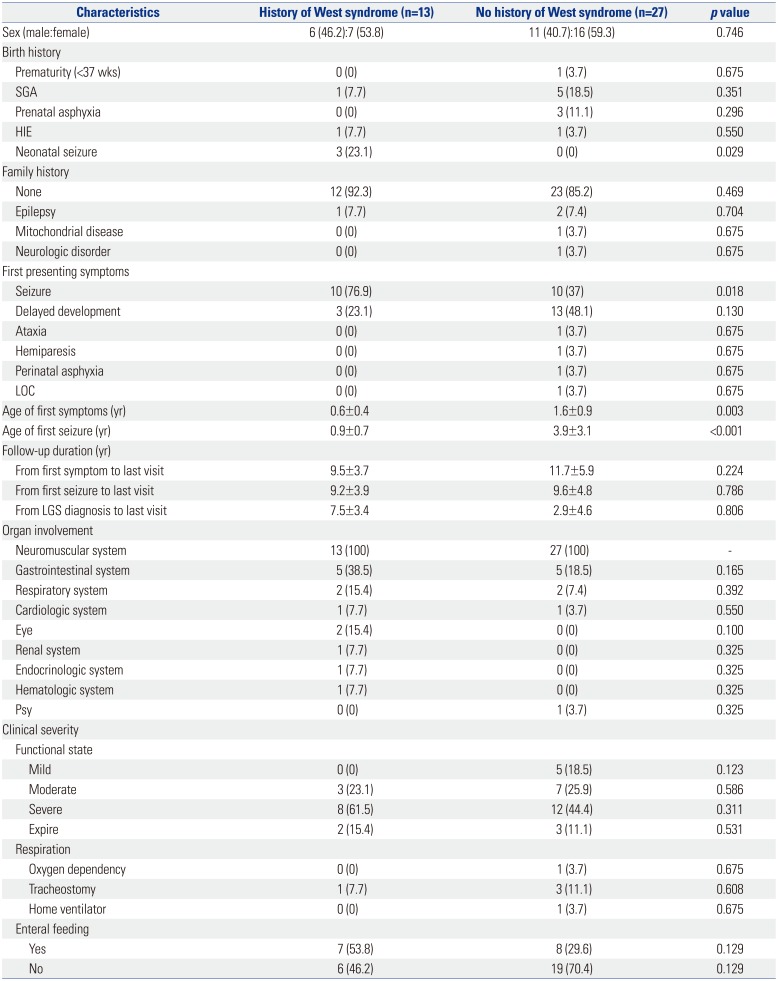
To investigate the impact of a history of West syndrome, the study population was divided into groups (Table 4). Among the patients with mitochondrial disease with LGS, neonatal seizure (p=0.029) and seizure as the first symptom (p=0.018) in the group with a history of West syndrome were significantly higher. The first symptom onset (0.6±0.4 yrs vs. 1.6±0.9 yrs, p=0.003) and first seizure onset (0.9±0.7 yrs vs. 3.9±3.1 yrs, p<0.001) were significantly faster in the group with a history of West syndrome. Organ involvement and clinical severity were not statistically significant.
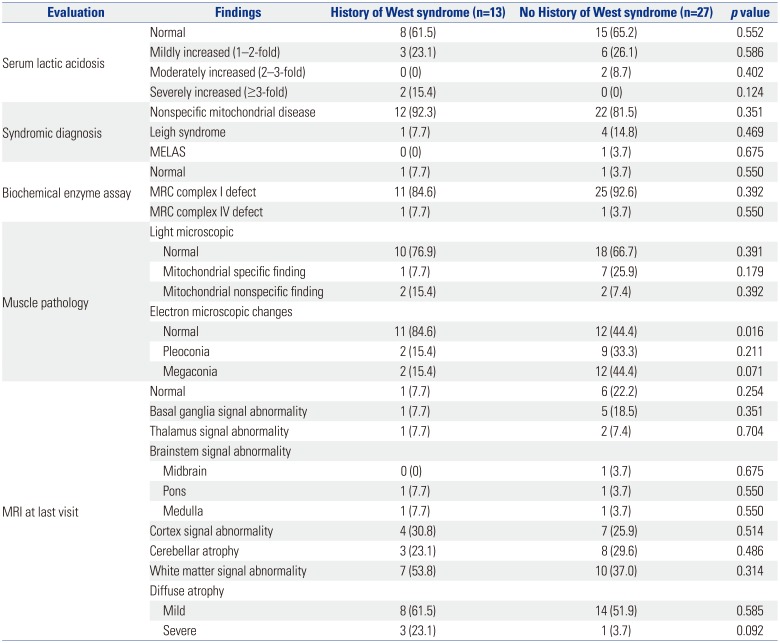
Among the patients with mitochondrial disease with LGS, the incidence of abnormal findings on electron microscopy was significantly higher in the group with no history of West syndrome (Table 5). MRI findings were not statistically significant at the last visit.
In the West syndrome history group, other seizure type was more frequent than in the no history of West syndrome group (Table 6). This may be the result of spasm being classified as other type. GPFA frequency on EEG (p=0.018) in the group with a history of West syndrome was significantly higher. The number of AEDs seemed to increase at the last visit in the group with a history of West syndrome, although this was not statistically significant. No significant difference was observed in seizure reduction rate and treatment between the two groups.
DISCUSSION
Neurologic symptoms are predominant in patients with mitochondrial disease, and the most common clinical presentation of mitochondrial diseases is epileptic seizure.11 LGS accounts for a small proportion of the epilepsies. The prevalence of LGS is estimated between 1% and 2% of all patients with epilepsy and between 1% and 10% of childhood epilepsies.1213 However, the exact prevalence of mitochondrial epilepsy is not known, although seizures have been reported to occur in 35% to 60% of individuals with biochemically confirmed mitochondrial disease.1415 Studies systematically examining epilepsy phenotypes in the context of mitochondrial disease are lacking.41416 In one series of 48 individuals with epilepsy and confirmed MRC defects, two had Ohtahara syndrome, 10 had West syndrome, 12 had LGS, two had Landau-Kleffner syndrome, 14 had generalized epilepsy, and eight had focal epilepsy.4 In the current study, 67% of the patients with mitochondrial disease were diagnosed with epilepsy, and 16% of them were diagnosed with LGS. When comparing the current study with previous studies, LGS was found more frequently in patients with mitochondrial disease than expected.
The etiology of LGS has been divided into two groups. Approximately 75% of cases are thought to be symptomatic, implying an identifiable cause, such as a cerebral malformation or hypoxic ischemic injury.171819 Identifiable causes are usually the result of a static brain disorder; progressive metabolic disorders are extremely rare. The cryptogenic group (no apparent cause and no neurologic precedents) may account for approximately 25% of cases.18 When LGS has no apparent cause, a genetic predisposition20 or autoimmune influence has been hypothesized.21 In this study, patients were diagnosed with mitochondrial disease as underlying disease, and etiology was structural or metabolic disease. The LGS etiology known so far includes encephalitis and meningitis, tuberous sclerosis, brain malformations, hypoxia ischemia injury, frontal lobe lesion, traumatic brain injury, and the like.22 There is a history of infantile spasms in 9–39% of patients with LGS. A clinicbased study designed to investigate the etiology of LGS found that 24 of 72 LGS cases (33%) evolved from West syndrome.23 A Cochrane review suggested that about 20% of LGS cases are preceded by West syndrome.18 Weinmann24 also noted that 17.8% of 174 children with LGS had preceding West syndrome. In this study, 13 of 40 (32.5%) patients with LGS had a history of West syndrome, and the rate of transition from West syndrome to LGS was not significantly different from previous studies. Moreover, when migrating from West syndrome to LGS, no significant difference was observed in the rate of migration of mitochondria disease.
No difference was observed in general characteristics and mitochondrial variables when patients with LGS were divided into two groups based on the history of West syndrome. Clinical aspects, such as organ involvement and clinical severity, were not different. From the diagnostic point of view, no difference was observed in the syndromic diagnosis, biochemical enzyme assay, and MRI between the two groups. However, in the clinical aspect, first symptom onset was significantly faster in the group with a history of West syndrome, and seizure as the first symptom in the group with a history of West syndrome was high with statistical significance. Previous studies showed that the most common first symptom was seizure (n=35, 50%), followed by delayed development (n=25, 36%), and the mean age at the first symptom was 1.8 years (range: 0–9.9 years, SD: 2.5 years) in mitochondrial disease.25 As reported in another study, the first manifestations of the disease were recorded at a median age of 7 months (range: 0–16 years) and encompassed a wide range of symptoms, including nonspecific psychomotor delay (38%), metabolic acidosis (14%), failure to thrive (10%), acute or subacute regression (9%), visceral involvement (liver dysfunction, 4%; hypertrophic cardiomyopathy, 3%), and various combinations of focal neurologic symptoms (22%), including seizures, ataxia, extrapyramidal signs, muscle weakness or pain, ptosis, and headache.15 The age at presentation of the first symptoms was a major prognostic factor for mortality. Infants presenting their first symptoms before 6 months of age have a 10-fold higher risk of mortality during the observation period than those presenting later. According to Arce-Portillo, statistically significant poor prognostic factors were linked to age at onset of spasms (<4 months), the presence of epileptic seizures, and delayed psychomotor development before the onset of spasms.26 In the group with a history of West syndrome, the age at which the first seizure occurred was markedly earlier, with statistical significance. In a previous study, early age at first seizure in patients with LGS was consistent with observations by Berg, et al.27 who reported an increased risk of intractable seizures among children with early age at first seizure. Several studies have shown that the younger the age, the worse the prognosis. When mitochondrial disease is diagnosed at an early age, it can be converted to intractable epilepsy, and close monitoring is required. On the diagnostic side, cases with normal muscle biopsy were significantly higher in the group with a history of West syndrome. The reason for the high rate of normal muscle biopsy results in cases with a history of West syndrome is believed to be due to examinations done at a younger age. The normal ranges of muscle biopsy according to age group are not clearly established yet. Therefore, it is not easy to correct by age even if the result were abnormal. As West syndromes present at relatively earlier age, muscle biopsies tend to be performed at an earlier age. There could be a possibility of this affecting our results.
Some differences were observed in the epilepsy-related variables according to the presence or absence of the history of West syndrome. In the current study, history of neonatal seizure was significantly higher in patients with a history of West syndrome. In a study by von Kleist-Retzow, et al.,28 prenatal manifestations of MRC deficiencies were noted including intrauterine growth restriction (IUGR), multiple congenital malformations, and prematurity (in 68 of 300 patients). In a study by Gibson, et al.,29 prematurity (gestational age of 37 weeks) was noted in 12.6% of the 107 patients. Of the 85 infants with known birth weights, 24 were in the 10th percentile for gestational age, and nine of those were in the <3rd percentile. Patients usually presented with >one symptom or sign in the neonatal period. Most patients presented with an encephalomyopathic form, which included any of encephalopathy, seizures, hypotonia, ophthalmologic manifestations, or a combination thereof. In other studies, IUGR was the highest in the birth histories of mitochondrial diseases. Besides neonatal timing, although several variables may be important, neonatal seizure may be an important factor in the cases of patients with LGS with a history of West syndrome.
GPFA and frequency on EEG in the group with a history of West syndrome were significantly high. GPFA is a rather unique generalized rhythmic EEG finding of unknown significance, with a frequency of 8–26 Hz (mostly 10–14 Hz), lasting for 2–50 seconds.30 This interesting pattern is usually noted during sleep in symptomatic and cryptogenic generalized epilepsies, and it is one of the EEG constituents of LGS.1731 Thus, GPFA usually indicates poor prognosis, drug-refractory epilepsy with tonic-axial seizures, and mental retardation.32 A previous study suggested that a breakdown in gamma-aminobutyric acid-ergic inhibition due to a malignant evolution in certain secondarily generalized epilepsies results in a transformation of the GSSW pattern to GPFA with tonic seizure manifestations; hence, GSSW is a more stable (standard) EEG pattern in many syndromes.33 In a long-term follow-up study, Yagi34 described the evolution of EEG in patients with LGS. Initially, GSSW discharges disappear, while GPFA and multifocal spikes remain. This is followed by the disappearance of GPFA and finally the decrease and disappearance of multifocal spikes. There is not much information about the meaning of GPFA. In previous studies, the rate of transition from West syndrome to LGS has been discussed extensively and is known to be performed at a nonsignificant rate. In the current study, more GPFA in the group with a history of West syndrome was thought to be due to West syndrome being more electrophysiologically unstable. The seizure frequency at the last visit was statistically significantly higher in the presence of the West syndrome history. Considering the electrophysiological significance of GPFA, it is assumed that there is more clinical instability when there is more seizure frequency at the last visit with the history of West syndrome.
This study has some limitations because of its retrospective design. It is limited in that a prospective randomized model setting is not proceeded in selecting the subjects and setting other research items. This study was conducted in patients with mitochondrial disease with rare diseases in a pediatric population. Despite these limitations, subgroup analysis was carried out by collecting a small number of patients with mitochondrial disease. LGS is an uncommon epileptic encephalopathy, and mitochondrial disease is a rare disease. LGS in mitochondrial disease has not been investigated much. In patients with LGS with mitochondrial disease as a baseline disease, an overall understanding of the natural course of the underlying disease is important, and an individualized approach and plan based on the patient's history may be needed. If more data are gathered in the future, it is expected that individualized strategies will be developed.

 XML Download