

 PDF
PDF ePub
ePub Citation
 Print
Print


INTRODUCTION
Metformin is an effective anti-hyperglycemic agent and the drug of choice in patients with type 2 diabetes.12 It is well known that metformin has many beneficial effects on body weight, serum lipids, fibrinolysis, blood pressure, and endothelial function.345 Furthermore, metformin can reduce diabetes-related risks up to 32%, diabetes-related death up to 42%, and all-cause mortality up to 36%.3 However, metformin use is limited because of its potential adverse effects associated with lactic acidosis (LA), particularly in patients with reduced renal function.6
The adverse effects of biguanides associated with LA have become a concern in clinical practice with the use of the first line biguanide, phenformin. Phenformin inhibits lactate oxidation and increases lactate production.78 It has been reported that the incidence of phenformin-associated LA ranges between 40 and 129 cases per 100000 patient-years.910 However, despite being a biguanide, metformin does not affect anaerobic lactate production.11 In fact, the incidence of LA is 10 to 20 times lower with the use of metformin than with that of phenformin.12 Furthermore, several recent studies have suggested that the occurrence of LA with the use of metformin might be a coincidence rather than a consequence. Scale and Harvey13 reported that LA was more common in patients with diabetes but was not more frequent in patients who had taken metformin. Another study has shown that the prevalence of LA is lower in patients with metformin therapy than those with sulfonylurea therapy (3.3 and 4.8 cases per 100000 patient-years, respectively).14 Therefore, we aimed to investigate whether metformin use was associated with LA and hyperlactatemia in patients with type 2 diabetes.
MATERIALS AND METHODS
Patients and study design
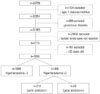
This was a cross-sectional study. In the present study, patients from the diabetes registry of the Severance Diabetes Center between January 2007 and December 2011 were retrospectively evaluated. Of total 33758 diabetic patients, patients with type 1 diabetes, gestational diabetes, and patients whose lactate levels were not reported were excluded. A total of 1954 patients aged ≥20 years and with type 2 diabetes were included in this study (Fig. 1). Medical history including medication use, history of operation, and underlying diseases was collected. Hyperlactatemia was defined as plasma lactate levels above the normal upper limit of 2.2 mmol/L. LA was defined as plasma lactate levels of >5 mmol/L and arterial pH <7.35. All patients were stratified according to the use of metformin or the estimated glomerular filtration rate (eGFR) of 60 mL/min/1.73 m2. The metformin therapy group comprised patients who used metformin during the study period, and the non-metformin therapy group comprised subjects who did not use metformin in the year prior to data collection. This study was approved by the research ethics committee of the Severance Hospital, under protocol No. 4-2014-0420.
Laboratory measurements
Fasting and postprandial plasma glucose levels were measured using the glucose oxidase method on a Hitachi 747 automatic analyzer (Hitachi Instruments Service, Tokyo, Japan). Glycated hemoglobin (HbA1c) levels were measured using highperformance liquid chromatography and a Variant II Turbo hemoglobin testing system (Bio-Rad Laboratories, Hercules, CA, USA). Plasma lactate levels were measured using the amperimetric electrode method. Arterial blood pH was analyzed in patients with increased lactate levels. Serum creatinine levels were measured using the Jaffe method on a Hitachi 7600 analyzer. The eGFR was calculated using the 4-variable Modification of Diet in Renal Disease study equation: eGFR=186.3×(creatinine)-1.154×age-0.203×0.742 (for women).15 Serum aspartate aminotransferase (AST) and alanine aminotransferase (ALT) levels were measured using the Internal Federation of Clinical Chemistry standardization without pyridoxal phosphate using a Hitachi 7600 analyzer. Among participants, we measured metformin concentration in those taking metformin and with reduced renal function (creatinine ≥1.5 mg/dL for men and ≥1.4 mg/dL for women) (n=31). None of them had severe illness such as liver cirrhosis, acute coronary syndrome, malignancy, acute infectious disease, and acute or severe renal failure (renal failure occurred within 7 days or serum creatinine ≥3 mg/dL). Metformin concentration was measured by high-performance liquid chromatography-tandem mass spectrometry using a 1200 Series HPLC system (Agilent Technologies, Santa Clara, CA, USA) and API 4000™ mass spectrometer (AB Sciex, Framingham, MA, USA). The coefficient of variance ranged between 4.7% and 7.7%.
Statistical analysis
All continuous variables are shown as mean±standard deviation or median (interquartile range) for data not normally distributed. Data were analyzed after stratification considering a threshold eGFR value of 60 mL/min/1.73 m2. Variable comparison between two groups was performed using Student's t-test or chi-square test, as appropriate. The Mann-Whitney U test was used to compare two groups if variables were not normally distributed. Pearson's correlation coefficient was used to assess the association between metformin and lactate levels. Multiple logistic regression analysis was used to investigate the association between metformin use and LA after adjustment for confounding factors. Statistical analyses were performed using SPSS 18.0 software (SPSS Inc., Chicago, IL, USA), and a p value<0.05 was considered significant.
RESULTS
Baseline characteristic of the study subjects
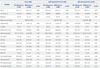
Overall, 61.4% of the patients with diabetes were treated with metformin. Metformin therapy was more common in patients with eGFR level of <60 mL/min/1.73 m2 than in those with eGFR level ≥60 mL/min/1.73 m2 (67.1% vs. 59.4%, p=0.002). Table 1 shows the baseline characteristics of patients with and without metformin therapy. Among total participants, patients with metformin therapy were older but had lower albuminuria and postprandial glucose levels than those without metformin therapy. There were no significant differences either in plasma lactate levels or in total bicarbonate (CO2) levels between the patients with and without metformin therapy [1.2 (interquartile range, 0.8–1.9) mmol/L vs. 1.1 (interquartile range, 0.8–1.9) mmol/L, p=0.050 for plasma lactate; 21.8±5.7 mmol/L vs. 21.8±4.6 mmol/L, p=0.720 for total CO2]. This was consistently observed in both eGFR subgroups. In addition, no significant correlation was found between metformin dose and plasma lactate levels (r=0.051, p=0.350) regardless of the eGFR levels.
In 31 patients with reduced renal function, metformin concentration was measured. Median (interquartile range) metformin concentration was 0.97 (0.30–1.90) µg/mL and it increased as metformin dose increased. However, there was no significant correlation between metformin concentration and plasma lactate levels (r=-0.018, p=0.924) or total CO2 (r=-0.042, p=0.833) levels (Supplementary Fig. 1 and 2, only online).
Incidence of hyperlactatemia and lactic acidosis
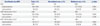
Among the 1954 patients with diabetes, 18.8% of them presented with hyperlactatemia and 3.0% of them with LA (Table 2). There was no significant difference in the prevalence of hyperlactatemia (18.9% vs. 18.7%, p=0.905) or LA (2.8% vs. 3.3%, p=0.544) between the patients with and without metformin therapy. Regardless of eGFR levels, there was no significant difference in the prevalence of hyperlactatemia or LA. Although not significant, the prevalence of LA in patients with metformin therapy was lower than that in patients without metformin therapy, even in the patient subgroup with eGFR <60 ml/min/1.73 m2.
Comparison of subjects with hyperlactatemia according to the development of lactic acidosis
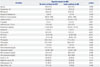
We further evaluated patients with hyperlactatemia according to the occurrence of LA (Table 3). LA occurred in 16.0% of the patients with hyperlactatemia. The mortality rates of patients with hyperlactatemia and LA were 15.2% and 39.0%, respectively. Compared with patients with hyperlactatemia but without LA, patients with hyperlactatemia and LA had higher plasma lactate levels [10.4 (interquartile range, 6.4–13.3) mmol/L vs. 3.3 (interquartile range, 2.7–4.3) mmol/L, p<0.001], but lower arterial pH (7.2±0.1 vs. 7.4±0.1, p<0.001) and total CO2 levels (14.2±5.3 mmol/L vs. 20.5±4.3 mmol/L, p<0.001). The eGFR level significantly decreased in patients with LA in comparison with those without LA (53.5±37.3 mL/min/1.73 m2 vs. 71.9±32.6 mL/min/1.73 m2, p<0.001). Liver enzymes significantly increased in patients with LA compared with those without LA [92 (interquartile range, 28–238) IU/L vs. 25 (interquartile range, 18–45), p<0.001 for AST and 49 (interquartile range, 20–137) IU/L vs. 22 (interquartile range, 15–39) IU/L, p<0.001 for ALT]. There was no significant difference in the number of patients with metformin therapy or in the metformin dose between the patients with and without LA.
Multiple regression analysis for lactic acidosis
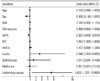
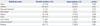
More than 60% of the patients with hyperlactatemia and 84.7% of the patients with LA had at least one underlying disease that could cause tissue hypoxia, such as sepsis, heart failure, hypoxemia, shock, liver cirrhosis, or bleeding (Table 4). Sepsis, shock, liver cirrhosis, and bleeding were more prevalent in patients with LA compared to those without LA. Multiple logistic regression analysis indicated that metformin therapy was not associated with the development of LA (Fig. 2). In contrast, the presence of underlying disease leading to tissue hypoxia showed a significant association with LA (odds ratio, 4.603; 95% confidence interval, 1.327–15.965).
DISCUSSION
In the present study, we demonstrated that there was no significant difference in the prevalence of hyperlactatemia and LA between patients with and without metformin therapy. Despite the concerns for LA in patients with reduced renal function, the prevalence of these conditions was not increased in the metformin-treated patients with GFR <60 mL/min/1.73 m2 or <45 mL/min/1.73 m2 (data not shown). In consistent with our results, a recent meta-analysis from 194 prospective studies found that neither fatal nor nonfatal LA occurred in 36893 patients-years in patients with metformin therapy.16 The estimated incidence of LA in patients with and without metformin therapy was 8.1 and 9.9 cases per 100000 patients-years, respectively. This meta-analysis also included elderly patients and those with renal impairment. Other studies involving elderly patients with renal insufficiency did not find any case of LA.121718
There have been growing evidences that metformin does not increase plasma lactate levels. Patients with diabetes showed similar lactate turnover and lactate oxidation rates regardless of the metformin therapy.19 Previous studies including a randomized controlled trial showed that lactate levels did not change in patients with metformin therapy or were not correlated with the use of metformin.512202122 The switch from phenformin to metformin in patients with type 2 diabetes resulted in decreased plasma lactate levels from 28 mg/dL to 15 mg/dL (the normal range is 9––18 mg/dL).17 Although we measured metformin concentration in a small number of participants (n=31), serum lactate levels were not correlated with plasma metformin concentration in patients with reduced renal function (mean eGFR 41.7 mL/min/1.73 m2). Previously, few studies have measured plasma metformin concentrations. A review of case reports for LA found that there was no quantitative association between plasma metformin and lactic acid concentration (n=19).23 Another study performed in 14 patients with LA showed similar results.24 As far as we are aware of, only one study has directly compared plasma metformin concentration with lactate levels in patients with chronic kidney disease but without LA.22 In accordance with our results, this study demonstrated no correlation of lactate levels with metformin concentration. In Asian population with type 2 diabetes, an observational study showed that the mean plasma lactate level was not associated with total daily dose of metformin.25
In the present study, most patients with LA had at least one condition that could result in tissue hypoxia. In accordance with our results, previous case series of metformin-associated LA have demonstrated that all patients except one case had clinical shock or tissue hypoxia.2426 In the largest study of metformin-treated patients with LA (n=49), all patients had at least one disease that could lead to tissue hypoxia, such as cardiopulmonary failure, sepsis, or hemorrhage.20 Among the patients treated with other hypoglycemic agents except metformin, severe medical condition causing tissue hypoxia has been consistently observed in all patients with LA.27 Taken together, previous studies suggest that underlying disease associated with tissue hypoxia rather than metformin use is linked to LA in diabetic patients. In addition to confirming the previous observation, we also found that this condition had an independent association with LA, even after adjustment for possible confounders.
It is one of strengths of our study that we measured plasma lactate and bicarbonate levels in a relatively large sample (n=1954). Previous studies with a large sample size usually used the diagnosis of acidosis or LA from the medical record. We also adjusted possible confounding factors to evaluate the association of metformin use and the presence of LA. Although a small number of participants (n=31), measurement of metformin concentration is an another strength of this study. To the best of our knowledge, this is the largest study of metformintreated patients with LA in Asian population. However, there are several limitations. The retrospective and cross-sectional nature of the study did not allow us to accurately determine the causal relationship between metformin use and LA. Second, we could not adjust the severity of underlying diseases. Lastly, our results could not be generalized to other population.
In conclusion, we demonstrated herein that there is no association between metformin use and the risk of LA or elevated lactate concentration in type 2 diabetes, suggesting that metformin might be a bystander rather than the cause of LA. Further prospective studies are needed to elucidate the direct role of metformin on the development of LA in subjects with type 2 diabetes.
 XML Download