

 PDF
PDF ePub
ePub Citation
 Print
Print


INTRODUCTION
The term noise refers to undesirable sound. Noise has become the most frequently encountered environmental pollutant in daily life due to several reasons such as improved standards of living, urbanization, and industrialization. In Korea, noise-related complaints account for 35.4% of all environment-related complaints, indicating that problems with noise are not restricted to people with specific occupations; rather, they are ubiquitous, independent of sex, age, and region.
The effects of noise on the human body are extensive, ranging from hearing loss to annoyance. The direct health-related effects of noise on humans are hearing impairment, speech disturbance, performance issues, mental problems, sleep disturbance, and annoyance,1,2,3,4 while indirect health-related effects are dysfunction of the autonomic nervous system (ANS) and cardiovascular system.
The ANS, a peripheral nervous system component, controls smooth muscle, myocardium, external secretion glands, and some internal secretion glands to maintain homeostasis.15 Factors that can affect the ANS include noise, mental stress, temperature, vibration, smoking, and exercise.16,17,18,19,20 The influence of noise on the ANS manifests as sympathetic hyperactivity, as noise is known to act as a stressor.5,6,7 To measure the impact of noise on the human body, including the ANS, various surveys have often been conducted, which usually include questionnaires to assess annoyance, sleep disorders, cognitive performance, and task performance, as well as tests to assess hormone levels and heart rate variability (HRV).5,8,9,10,11,12,13,14
HRV refers to cyclic changes in the heart rate and acts as a non-invasive electrocardiographic marker, reflective of the activities of the sympathetic and vagal components of the ANS on the cardiac sinus node.21 In 1996, the European Society of Cardiology and the North American Society of Pacing and Electrophysiology organized a task force team of experts in their respective fields to standardize the terminology and measurement methods and define physiological and pathological inter-relationships in order to establish appropriate standards for HRV.14
Currently, there are several papers on the relationship between noise exposure and HRV. For example, Umemura and Honda22 and Björ, et al.18 showed that the type and presence of noise, respectively, could affect HRV results. Additionally, Lee, et al.23 reported that HRV results were affected by the level of noise.
To date, most HRV studies have used sound pressure levels that exceed 50 dB(A). Furthermore, questionnaire surveys have been the most common method of assessing the impact of sound quality on health, and as such, the relevance of HRV as an objective indicator has not been established. Therefore, we aimed to identify the impact of sound type and quality on ANS activity on the heart in an environment where the sound intensity was limited to levels below 50 dB(A), which is known not to have a significant impact on the human body.
We further aimed to investigate the effects of different types of noise on HRV in a quasi-experimental environment. First, with noise levels below 50 dB(A), we compared pre-exposure and post-exposure HRV parameter results with background, traffic, speech, and mixed noise (traffic and speech). Second, we evaluated the impact of noise on the ANS as measured by the HRV, depending on the noise type and sound quality.
MATERIALS AND METHODS
Subjects
We recruited 40 volunteers from a single college through advertisements and classified the volunteers into four groups according to the type of noise they were exposed to: background noise, traffic noise, speech noise, and mixed noise (traffic and speech). All subjects were healthy; they had no medical problems and were not taking medications that would influence HRV. Approval for this study was obtained from the Review Committee at Ulsan University Hospital with regard to scientific and ethical considerations (UUH-IRB-11-109).
Methods
Questionnaire
A week before the test, we distributed consent forms, information leaflets, and questionnaires to the subjects. The questionnaires requested information regarding socio-demographic variables such as age, smoking status, drinking status, presence of disease, susceptibility to noise, hobbies related to noise or sound, sleep status, psychosocial stress state, and the ability to cope with stress. To measure the psychosocial stress level, we used the psychosocial well-being index short form (PWI-SF), which was composed of four items and 18 questions.24 To assess the ability to cope with stress, we used the Connor-Davidson resilience scale (CD-RS), which included five items and 25 questions.25
Qualitative analysis of noise sources and sounds
The proposed noise sources were self-made and were classified into four types. The sound quality was analyzed using Harmony-SQ 1.0 (SCIEN Co. Ltd., Taipei, Taiwan). Background noise to which the control group was exposed was set to the basic environmental noise level [35 dB(A)]. The traffic noise to which the experimental groups were exposed to comprised aircraft and road traffic noise. Speech noise comprised noise similar to that produced by several people talking simultaneously. Mixed noise comprised both traffic and speech noise. All noises types were set at levels of 45 dB(A). We analyzed sound quality in five domains: specific loudness (the strength of a sound as perceived by an individual), specific sharpness (the sharpness of a sound), specific roughness (the roughness of a sound), fluctuation strength (the uniformity of a sound), and tonality (the dominance of a certain utterance).26
Clinical examination and HRV testing
For 2 days, we examined 5 volunteers in each group (20 students per day) only in the morning, to minimize diurnal stress changes. We measured each volunteer's height, weight, blood pressure (before and after noise exposure), and clinical laboratory values (aspartate aminotransferase-alanine aminotransferase ratio; levels of γ-glutamyl transpeptidase, blood lipids, and blood glucose, as well as a complete blood count). A pure tone audiometry test and otoscopy were performed to identify any ear-related medical problems. Before exposure, we measured the blood pressure, heart rate, and HRV. We performed the same evaluations for all subjects during a 1-hour period, while presenting pre-configured and generated sounds [45 dB(A) level] through an amplifier (L1400, Intron-M, CA, USA) and speaker in an anechoic room. After noise exposure, we measured the blood pressure, heart rate, and HRV again.
HRV was measured using an SA-2000E (Medicore Co. Ltd., Seoul, Korea) in a quiet room, with participants seated in chairs and electrodes attached to their left and right wrists and left ankles. HRV was then measured for 5 min. Frequency domain analysis included total power (TP), representing the strength of the overall frequency; very low frequency (VLF: 0.0033-0.04 Hz), mainly reflecting the activity of the sympathetic nervous system; low frequency (LF: 0.04-0.15 Hz), mainly reflecting the activity of both the sympathetic and parasympathetic nervous systems, yet reflecting the activity of the sympathetic nervous system in the stable stage; high frequency (HF: 0.15-0.40 Hz), reflecting the activity of the parasympathetic nervous system; and the ratio of the LF domain to the HF domain, reflecting the degree of overall balance between the sympathetic and parasympathetic nervous systems. For time domain analysis, we used the standard deviation of normal-to-normal intervals (SDNN), which assessed the overall degree of HRV as the standard deviation of the overall R-wave interval on electrocardiography and the R-wave interval, as well as the physical stress index (PSI), an indicator that represented the degree of load on the ANS control system.
Statistical analysis
The Kruskal-Wallis test was used to compare age, anthropometric measurements, audiometry results, and systolic and diastolic blood pressure measurements in the background, traffic, speech, and mixed noise groups. We also performed the chi-square test to compare individual differences in susceptibility to noise. Additionally, we performed the Mann-Whitney U test to compare individual abilities to cope with social and psychological stresses between the background noise group and the other groups. To account for interpersonal differences in heart rate indicators, we compared the values obtained before and after noise exposure. We used the Wilcoxon signed-rank test to compare the differences in variables within each group before and after noise exposure, and the Kruskal-Wallis test was used to compare the differences in the variables between the four groups before and after noise exposure. After adjusting for smoking status, alcohol consumption, body mass index (BMI), social status, psychological stress levels, and the ability to cope with stress, we used a general linear model to compare the differences in HRV according to the sound type. We used SPSS 19.0 software (IBM SPSS Inc., Chicago, IL, USA) for data analysis. For each analysis, the significance level was 0.05.
RESULTS
Characteristics of the study subjects
The average age was 23.9±1.8 years, and the average BMI was 23.7±2.1 kg/m2. There were no statistically significant differences between the groups.
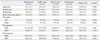
From the results of the audiometry test, the average hearing levels of the left and right ears were 7.7±4.1 and 9.0±3.5 dB, respectively; however, this difference was not statistically significant. There were also no statistically significant differences in the systolic and diastolic blood pressure levels before and after noise exposure and among the four groups (Table 1). Additionally, we found no statistically significant differences between the groups with regard to drinking and smoking status (data not shown).
Noise susceptibility
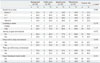
On the basis of the results of the survey on noise susceptibility (0-10), scores in the range of 4-5 accounted for 42.5% of scores. Overall, 72.5% of the subjects enjoyed listening to music, and 79.5% felt no anxiety when they were quiet. Additionally, 66.7% of the subjects could not sleep well in noisy environments, and 46.2% woke easily in noisy environments, while 48.7% enjoyed loud music. There were no statistically significant differences between the four groups (Table 2).
Psychosocial stress states and the ability to cope with stress
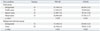
Susceptibility to noise was affected by the subjects' social and psychological states of stress and their ability to cope with stress. Therefore, we used the PWI-SF and CD-RS to identify the degree of individual susceptibility. For the PWI-SF, the mixed noise group received the highest score, 16.9±6.89, among the four noise groups. For the CD-RS, the traffic noise group had a higher score than the other groups. However, there were no significant differences between the groups as a whole (Table 3).
HRV before and after noise exposure
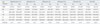
Comparisons between the HRV subgroup parameters before and after noise exposure revealed statistically significant differences in SDNN, PSI, TP, HF, and the LF/HF ratio. Moreover, after noise exposure, there were increases in SDNN, LF, and HF, yet a decrease in PSI. There were no significant differences between measurements taken before and after exposure to background noise. In the noise groups, there were statistically significant differences in SDNN, PSI, and HF. With regard to noise categories, the speech noise group showed a decrease in LF after noise exposure. There were no statistically significant differences between the traffic and mixed noise groups; however, similar patterns were observed throughout all groups (Table 4).
The differences between HRV parameter values before and after exposure were positive for SDNN, TP, VLF, and HF, although differences were negative for PSI and the LF/HF ratio. In particular, only the speech noise group had negative LF and LF/HF ratio values, indicating a reduced pattern that contrasted with the other groups; however, this difference was not statistically significant (data not shown).
After adjusting for alcohol consumption, smoking status, BMI, psychosocial stress state, and ability to cope with noise, we used a general linear model to compare the differences in HRV before and after exposure according to noise type and found no statistically significant differences. In the speech noise group, the LF values were negative, in contrast to values for the other noise groups (Table 5).
Sound quality analysis by noise type
When we compared the sound quality of speech noise with that of the other two noise types, we found that the specific loudness, specific roughness, and fluctuation strength were higher; however, the tonality was lower for speech noise. The parametric values of mixed noise were located between the values for traffic and speech noise (Table 6).
DISCUSSION
It is generally accepted that noise exposure enhances sympathetic nerve activity.18,27 Although investigators have sought to measure stress responses to acute noise exposure, the currently used objective parameters include stress hormone levels and HRV.9,10,28 Measurements of heart rate and blood pressure changes are well established methods for measuring overall cardiovascular responses.29 However, these methods can exhibit immediate reactions upon exposure to strong noise, and it is difficult to identify such changes in response to weak or moderate noise.30 Therefore, recent studies have investigated variables associated with ANS activity.
In a study by Lee, et al.,23 which compared HRV according to noise loudness, no noise-related differences in HF, an indicator of parasympathetic nervous system activity, were observed when the same subjects were presented with white noise at levels of 23, 50, 60, 70, and 80 dB(A). However, significant increases were observed in LF and the LF/HF ratio as the noise level increased. This finding was interpreted as demonstrating increased sympathetic nervous system activity simultaneously with the increased acute noise level. Among studies that observed changes in heart rate according to noise type, Umemura and Honda22 measured changes in subjects' heart rates after listening to classical music, rock music, and noise. Among subjects who listened to classical music, LF (an indicator of sympathetic nervous system activity) decreased during the stable stage, whereas among subjects who listened to rock music or noise, LF increased. This indicated that the sympathetic nervous system was inhibited in subjects who listened to classical music, yet excited in subjects who listened to rock music or noise. It can also be inferred that classical music would promote comfort, whereas rock music or noise would induce discomfort or tension. Therefore, it could be suggested that even noises of the same intensity may have different impacts on the ANS, depending on the type of noise.31,32,33,34
In this study, which took place a basic dead room setting, we created a quasi-experimental environment and investigated the influence of noise on the ANS according to the sound quality, rather than strength. Conversation with the subjects was not disrupted while background noise was presented at 35 dB(A), and traffic noise, speech noise, and mixed noise (traffic+speech) were presented at 45 dB(A). After noise exposure, both the systolic and diastolic blood pressure levels tended to increase; however, these increases were not statistically significant. This result implies that either the experimental noise levels did not significantly affect the human body or it was difficult to determine changes in indicators such as blood pressure at low noise levels. After noise exposure, the HRV parameters SDNN, TP, VLF, LF, and HF increased; however, PSI decreased and the LF/HF ratio was closer to 1. These results suggest that with appropriate noise exposure levels, we could observe activated ANS function and an improved degree of overall balance between the sympathetic and parasympathetic nervous systems. Typically, the theory of noise acting as a stressor and exerting a negative impact on the human body has been dominant. According to the results obtained in this study, noise might act as a eustressor that relieves anxiety resulting from silence.35 Additionally, these results suggest that an appropriate noise level can positively affect the ANS.
In this study, only subjects who were exposed to speech noise showed a reduced LF value. This finding reflects the inhibition of the sympathetic nervous system in this group. Furthermore, even for a given level of noise, the impact on the ANS might differ according to the type of noise.31,32,33,34 In this study, the LF/HF ratio decreased from 5.21 to 1.37 (closer to 1), suggesting that the ANS became more stable after speech noise exposure. Likely due to the fact that speech noise is more common and familiar than other noises, an appropriate level of speech noise increased the subjects' comfort levels. These results are in accordance with those of previous studies, which showed that classical music increased comfort and decreased the LF level.22
In the sound analysis, the specific loudness, specific roughness, and fluctuation of speech noise were higher than those of other noises, yet the tonality and specific sharpness of speech noise were lower. These characteristics of speech noise could be related to the level of stress.
Unlike previous studies, this study was designed to assess the qualitative impact of sound, rather than the intensity of noise. Although the results were not statistically significant, we observed decreases in both the LF value and the LF/HF ratio in the speech noise group alone. According to the sound quality results, speech noise exhibited different characteristics from other noises. Moreover, it could be suggested that the qualitative elements of noise have an impact on stress levels. Although previous studies made little progress, the results of this study suggest a new direction in terms of qualitative noise.
This study has several limitations. For example, the number of subjects in each group was small (n=10). Several factors can affect the heart rate and ANS, including age, sex, changes in blood pressure, respiratory activity, smoking, alcohol consumption, caffeine use, physical activity, obesity, mental stress, emotional disorders, sleep disturbance, thyroid dysfunction, and drug use. Additionally, HRV results have been found to depend on age and sex.36,37,38,39 However, it is impossible to control changes in each factor in real-life situations. We attempted to control confounders by restriction at the sampling stage (age and sex) and by statistical analysis (smoking, alcohol consumption, and BMI). In addition, in order to consider the subjects' states of stress before performing the tests, we corrected for the psychosocial stress state and the ability to cope with stress before analyzing the data.40
In conclusion, these results provide evidence that 45 dB(A) of noise, which is 10 dB(A) higher than the background level, affects the ANS. Furthermore, the quality of the noise might affect HRV. Further studies will be required to ascertain the role of noise types and soundscapes.

 XML Download