

 PDF
PDF ePub
ePub Citation
 Print
Print


INTRODUCTION
In normal persons, the nitrite present in swallowed saliva is immediately converted to nitric oxide at the gastric cardia by gastric acid.1 Therefore, gastric juice pH is very important as a main determining factor for the level of gastric nitrite. Pathologically, many conditions associated with gastric acid secretion influence gastric nitrite levels including long-term proton pump inhibitors (PPI), inflammation scores, gastric cancer, and hypochlorhydria by gastric atrophy.2-10 With respect to the relation of Helicobacter pylori (H. pylori) infection to gastric nitrite, previous reports show variable results and its mechanism has not yet been elucidated.1,3,8,10,11
The present authors hypothesized that surface pH changes of gastric corpus mucosa might influence nitrate/nitrite levels of gastric juice by topographically directly contacting the collected fundic gastric juice. In fact, if normal acidic condition in gastric juice becomes alkaline, oxidation of gastric juice will occur and produce more nitrite.12 Moreover, it is highly likely that profuse ammonia production by potent urease activity of H. pylori infected gastric corpus, compared with that of gastric antrum would make mucosal surface more alkaline.13,14 However, there are also hither-to-unknown other factors which determine gastric juice nitrite.11 Therfore, the significance of this study is to explore the possibility of association between gastric juice nitrate/nitrite concentration and gastric corpus mucosa surface pH extent (area) in addition to corpus mucosa histological change. We used the chromoscopy spraying phenol red solution method for the endoscopic visualization of mucosal surface pH change because of color change in alkaline condition (pH >7.0).15
MATERIALS AND METHODS
Patients
The present study was conducted on 99 patients (non gastric atrophy 91 patients and gastric atrophy 8 patients) with dyspeptic symptoms between May and August 2006. Subjects were studied after overnight fasting. Exclusion criteria were previous H. pylori eradication therapy, and the use of bisthmus compounds, proton pump inhibitors, antibiotics, or anti-secretory drugs within previous 2 months. Subjects included 40 male and 59 female patients. Written informed consent was obtained from all patients. The protocol was approved by the Institutional Review Board of the Catholic University of Korea.
Endoscopic phenol red test
Endoscopic examinations were performed using an Olympus XP-20 gastroscope (Olympus Co., Tokyo, Japan) by two experienced endoscopists. Xylocaine was used as a local anesthetics and expectorated before the procedure to prevent changes in gastric juice nitrate/nitrite level. We aspirated gastric juice (more than 1 mL) immediately after endoscopic insertion into the stomach and sprayed phenol red dye (0.1% phenol red solution) as a pH indicator on the corpus mucosa of the stomach with spray catheter (PW-5L-1, Olympus Co., Tokyo, Japan) via endoscopic biopsy channel. We determined a positive color changes when dye changed from originally yellow to red color. It occurred within 2-3 min after dye spraying. As reported previously, the extent of positive color changed area was classified and graded into four patterns;15,16 unstained (score of 0, no red areas detected), patchy (1, red areas detected in one part of the corpus), regional (2, red areas detected in two parts of the corpus) and diffuse pattern (3, red areas detected in all regions of corpus). The cases showing inter-obsever variation were excluded from the study.
Aspirated gastric juice was immediately centrifuged at 12000 g for 5 minutes, and 80 µL of the supernatant was used for the assay. Gastric juice nitrate/nitrite concentrations were determined using the Griess reaction (R&D Systems, Inc., Minneapolis, MN, USA).17 Briefly, 100 µL of aliquots were mixed with equal volumes of Griess reagent (1% sulfanilamide in 2.5% H3PO4 and 0.1% naphthyl-ethylenediamine dihydrochloride) and incubated for 10 min at room temperature. Absorbance at 550 nm was then measured in a microplate ELISA reader (concentrations of nitrite were determined by extrapolation based on a standard curve established with sodium nitrite). Each sample was tested in duplicate.
Measurement of gastric juice pH
The pH of gastric juice was measured with a glass electrode pH meter (TOA, Electronics, Tokyo, Japan).
Histology
Endoscopic biopsy specimens were individually fixed in 10% formalin, and embedded in paraffin wax, and 5 µm sections were stained with hematoxylin and eosin, and the Warthin-Starry silver technique was applied to histologically confirm the presence of H. pylori bacilli. Two pathologists evaluated the sections. The H. pylori bacterial load (H. pylori density) and inflammation score were classified according to the Updated Sydney System.2
Statistical analysis
All statistical computations were performed using SPSS software (SPSS Version 11.0 for Windows, Inc., Chicago, IL, USA). Groups were compared using the nonparametric Kruskal-Wallis test. Also post-hoc analysis was done for Kruskal-Wallis test. The Mann-Whitney U test was used to compare continuous variables between two groups. Spearman rank correlations were used to determine relationships between the different parameters measured in each patient group.
RESULTS
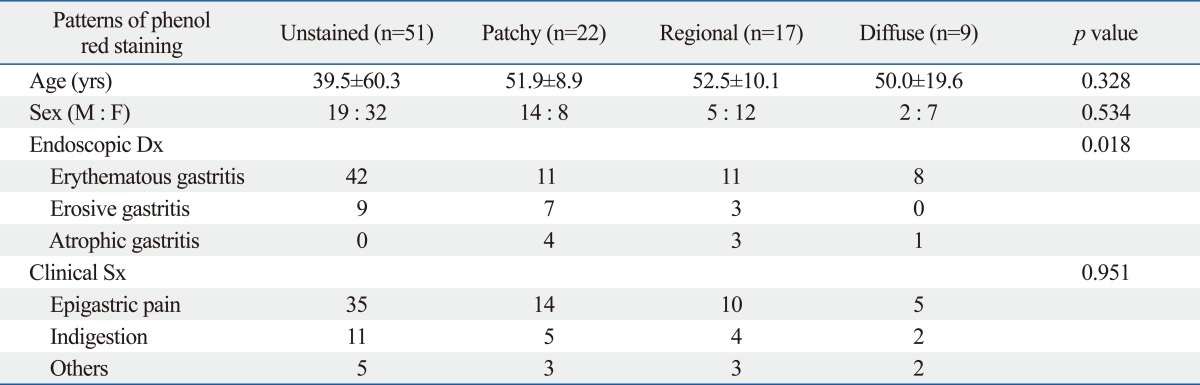
A total of ninety-nine patients with dyspeptic symptoms, including 40 male with a mean age of 50 years (range, 20-69 years) and 59 female with a mean age of 47 years (range, 19-74 years) were enrolled in the study. The clinical and endoscopic characteristics of the total patients are shown in Table 1, and intragastric nitrate/nitrite level and pH in gastric juice of the 91 enrolled patients are shown in Table 2.
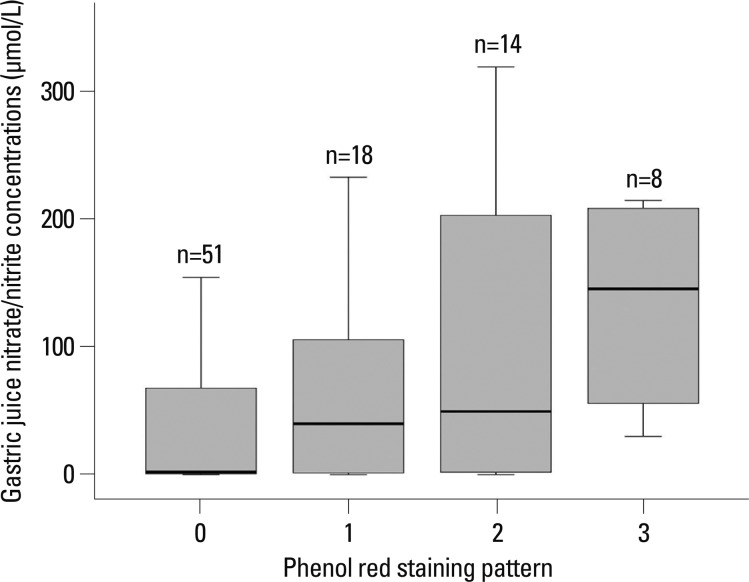
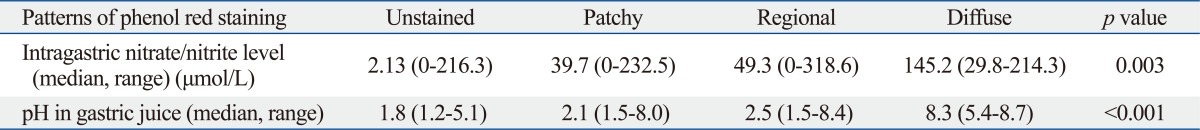
The median nitrate/nitrite concentrations in the gastric juice of 91 patients were 19.9 µmol/L (range, 0.0-318.6), the ranges showing large interindividual variation. In the unstained, patchy, regional and diffuse staining groups, the median nitrate/nitrite concentration in the gastric juice was 2.13 µmol/L (range, 0.0-216.3), 39.7 µmol/L (range, 0.0-232.5), 49.3 µmol/L (range, 0.0-318.6) and 145.2 µmol/L (range, 29.8-214.3), respectively (p=0.003) (Fig. 1). The median nitrate/nitrite concentrations in the gastric juice of 8 patients with gastric atrophy and/or intestinal metaplasia was 59.9 µmol/L (range 13.3-195.0).
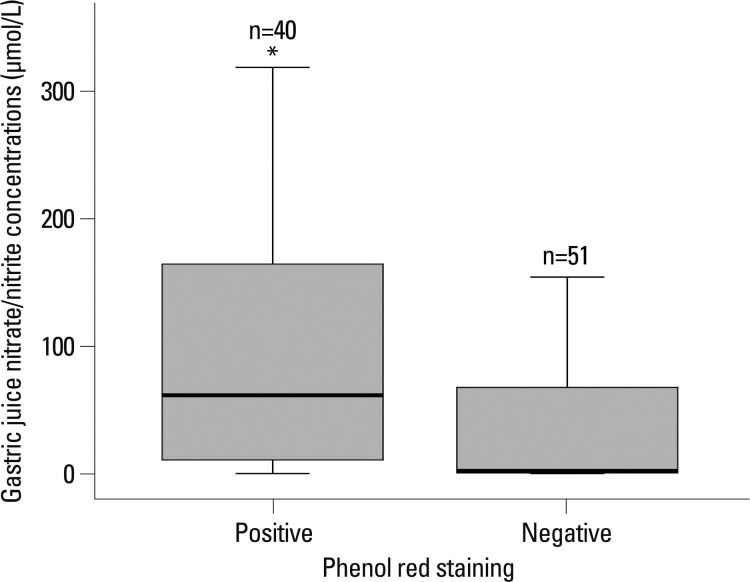
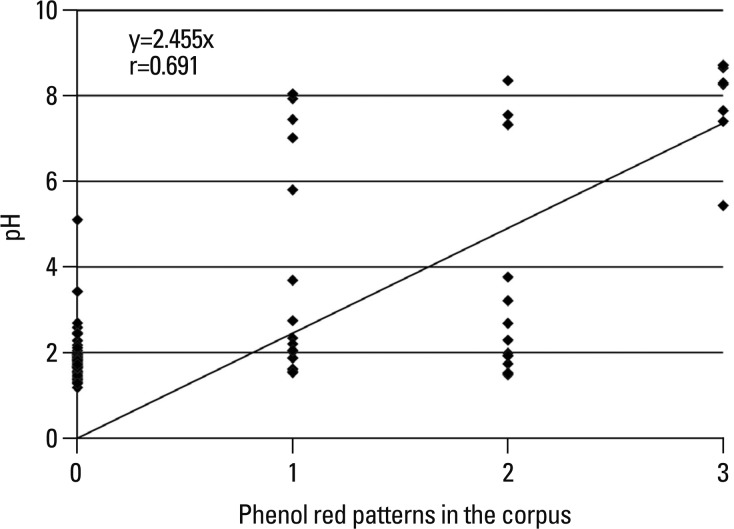
The gastric juice nitrate/nitrite levels in patients with phenol red positive mucosa were higher than phenol red negative mucosa {[n=40, median 61.6 (range, 0.0-318.6) versus n=51, median 2.13 (range, 0.0-216.3) µmol/L, p=0.001] (Fig. 2)}. In the unstained, patchy, regional and diffuse staining groups, the median pH of gastric juice was 1.8 (range, 1.2-5.1), 2.1 (range, 1.5-8.0), 2.5 (range, 1.5-8.4) and 8.3 (range, 5.4-8.7), respectively (p<0.001) (Fig. 3). There was also a significant positive correlation between gastric juice nitrate/nitrite levels and the pH levels (r=0.481, p<0.001). The median pH of gastric juice of 8 patients with gastric atrophy and/or intestinal metaplasia was 5.7 (range 1.7-8.7).
DISCUSSION
It is well known that gastric juice nitrite concentrations is an important indicator of gastric cancer risk and precancerous disease.4 Normally, nitrite from oral intake is converted to nitrogen oxides in the acidic environment of stomach, thereby decreasing the nitrite concentration.18 It has generally been accepted that there is a significant positive correlation between gastric juice nitrite levels and pH levels in the stomach, similar to the present result.1,18 To our best knowledge, however, the association between gastric juice nitrate/nitrite and gastric corpus mucosa surface pH extent has not so far been reported, and this is the first study to evaluate the association between gastric juice nitrate/nitrite concentration and gastric corpus mucosa surface pH extent (area). It is well known that H. pylori infection elevates gastric mucosal surface pH.15 However, few studies reported on the correlation of mucosal surface pH with bacteria other than H. pylori or inflammational change in the corpus. This correlation certainly needs further study.
We assumed that pH changes of gastric corpus mucosal surface may influence gastric juice pH by directly contacting gastric juice collected at fundus and producing more profuse ammonia than antrum, which was confirmed by our previous study because of very high urease activity in the corpus.13
Generally, the result of Greiss reaction has different meaning depending on the gastric juice pH. Under normal gastric pH (gastric juice pH <2.0), nitrate/nitrite concentration in gastric juice is almost equal to that of nitrate originated from saliva, because most nitrite has already been converted to nitric oxide. However, in hypochlorhydia, nitrate/nitrite concentration in gastric juice is the sum of ingested salivary nitrate and nitrite, which is not spontaneously degraded because of high gastric juice pH. This incomplete conversion would result in a wide variation of gastric juice nitrite level in spite of same staining pattern of phenol red. In this study, we have limitations that nitrate and nitrite in gastric juice are measured simultaneously due to the problems of the kits.
To evaluate the mucosal surface pH, we performed endoscopic phenol red chromoscopy, because it is a reliable method for detecting pH changes and H. pylori infection.15,16 It is known that original phenol red solution in acidic condtion (yellow color) turns to red color under alkaline condition. We found that pH (6.9) of phenol red positive mucosa was much higher than that (1.9) of unstaining mucosa.15
We found in the present study that the extent of phenol red positive mucosa was related with increased intragastric nitrate/nitrite concentration, although there was a large interindividual variation. An important finding in our present study is that nitrate/nitrite concentrations of broad surface change (regional and diffuse staining mucosa) were much higher than those of a little or no change (unstaining and patchy stained mucosa). The reasons for these findings are not clear. However, they may partly be explained by increased nitrate/nitrite concentration in diffuse stained mucosa by direct contact of gastric juice with the neutralized mucosal surface, as suggested by our hypothesis earlier described, although the nitrate/nitrite concentrations did not correlate with either inflammation scores in the corpus or H. pylori density (data not shown). Furthermore, potent urease activity in the acid environment of the corpus by H. pylori infection could produce a large amount of ammonia, which would make alkalinic and become another nitrogen source to convert nitrite to nitrous oxide after contacting with oxygen. Another possible reason is that higher gastric mucosal pH results in the overgrowth of other bacteria, thus making more gastric juice nitrite, similar to high nitrite production in H. pylori-negative, PPI treatment subjects.19,20 Nevertheless, we could not confirm secondary bacterial overgrowth. Another possibility is an oral intake of nitrate as a considerable source which influences gastric nitrite concentration. However, we did not evaluate the nitrite intake in this study.
In summary, gastric nitrate/nitrite level was closely associated with gastric corpus mucosal surface pH. In the future, it would be necessary to unravel other factors which influence corpus mucosal pH.
 XML Download