

 PDF
PDF ePub
ePub Citation
 Print
Print


INTRODUCTION
Adipose tissue is a storage organ for excess energy in the form of triglycerides. Since the discovery of leptin, numerous reports have been published, describing adipose tissue as a multifunctional organ that produces and secretes many factors, acting in a paracrine and endocrine manner.1 Adipocytes secrete many protein signals and factors, collectively known as adipocytokines or adipokines. These adipokines include inflammatory molecules, such as leptin, resistin, adiponectin, tumor necrosis factor-α (TNF-α), adipsin, interleukins (IL-1β, IL-6, IL-8, IL-10), plasminogen activator inhibitor-1 (PAI-1), haptoglobin, C-reactive protein (CRP), and MCP-1.2,3
The current view is that certain adipokines and other factors produced and released by white adipose tissue are responsible for the chronic inflammatory state of obesity, particularly the visceral form. Reduction of fat mass correlates with decreases in the serum levels of many of these adipokines,4 implying that approaches designed to promote fat loss should be useful in attenuating the proinflammatory milieu associated with obesity. The concomitance of inflammation, hypertension, and dyslipidemia increases the likelihood of type II diabetes and cardiovascular disease.5
TNF-α regulates key components of fat metabolism, with a net effect of preventing fat deposition through inhibition of lipogenesis, increased lipolysis, and facilitation of adipocyte death by apoptosis.6 TNF-α has been suggested as a mediator of insulin resistance in obesity,13 although controversy surrounds the exact nature of this proposed role. The effects of TNF-α and other proinflammatory cytokines on feeding, energy balance, and neuroendocrine and immune function during infection and inflammation are well-recognized.7
It is likely that more inflammatory adipokines will be discovered. Most studies on adipocyte-secreted molecules have been conducted, using 3T3-L1 cells originating from mice, but recently Simpson-Golabi-Behmel Syndrome (SGBS) human preadipocytes have been introduced. These cells can be induced to differentiate into adipocytes in primary culture, enabling human adipocyte-secreted molecules to be studied.8
In this study, we describe the utilization of MWG human inflammatory microarrays to study the inflammatory gene expression profile of human SGBS adipocytes. We also studied the inflammatory gene expression profile of SGBS cells following TNF-α treatment.
MATERIALS AND METHODS
SGBS cell culture
Cells were obtained from Dr. M. Wabitsch (Univ. of Ulm, Ulm, Germany),8 and these cells were derived from the stromal cell fraction of subcutaneous adipose tissue of an infant with SGBS. The cells were grown in serum-containing DMEM/F12 medium (Invitrogen, Paisley, UK), supplemented with 33 mM biotin, 17 mM pantothenate, and antibiotics. To induce adipocyte differentiation, cells were washed with phosphate buffered saline (PBS) buffer and cultured in serum-free medium (DMEM/F12), supplemented with 10 µg/mL of transferrin, 10 nM insulin, 200 pM triiodothyronine, 1 µM cortisol, 2 µM BRL 49653, 500 µM 1-methyl-3-isobutylxanthine (IBMX), and 0.25 M dexamethasone for four days. After four days, the medium was replaced with serum-free medium (DMEM/F12), supplemented with 10 µg/mL of transferrin, 10 nM insulin, 200 pM triiodothyronine, and 1 µM cortisol, and then changed twice per week. One day before sample treatment, the medium was changed to serum-free medium, supplemented with only transferrin, pantothenate, and biotin, and, the next day, cells were treated with 50 ng of TNF-α for 24 h. All materials except DMEM/F12 were from Sigma (Poole, UK).
Oil Red O staining
Cells were fixed with 10% fresh formaldehyde (Sigma, Poole, UK). They were rinsed in PBS (Biowhittaker Molecular Application, Walkerville, MD, USA), incubated with filtered Oil Red O stock solution for at least 1 h, gently washed twice with water, stained with 1 mL of Harris' Haematoxylin (Brainwood lab., E. Sussex, UK), and finally washed with warm distilled water.
cRNA preparation and probe preparation
RNA extraction and cDNA synthesis
Total RNA was extracted, using a standard Trizol RNA isolation protocol (Life Technologies, Grand Island, NY, USA) and quantified spectophotometrically. To each 2 µg total RNA sample, 1 µL of 10 µM oligo-dT(24) was added, and the mixture was denatured at 70℃ for 2 min, then immediately placed on ice. The reverse transcription mastermix (2 µL of 5X first strand buffer, 1 µL of 20 mM DTT, 1 µL of 10 mM dNTP, and 1 µL of Powerscript reverse transcriptase {Clontech, BD Biosciences, Oxford, UK}) was then added and incubated for 1 h at 42℃. Enzymic activity was stopped by heating to 72℃ for 10 min.
cRNA amplification and labelling
Total RNA was extracted and reverse transcribed as described above, except that the CDS oligo-dT was replaced with a modified oligo-dT with the T7 promotor sequence incorporated. The first strand cDNA product was subjected to two rounds of PCR amplification, using the SMART protocol (Clontech, BD Biosciences, Oxford, UK). The resulting dsDNA product was used in a reaction with ribonucleotides and T7 RNA polymerase and then incubated at 37℃ for 18 h. Amplified cRNA was labeled with either Cy3 or Cy5 dye, using a Micromax kit (PerkinElmer, London, UK).
Hybridization and image processing
10 µg labeled cRNA was dried in a Speedvac and resuspended in 40 µL hybridization buffer (MWG Biotech AG, London, UK). The cRNA was denatured at 95℃ for 3 min, vortexed, and briefly spun-down to collect the contents. The cRNA was chilled on ice for 30 sec and pipetted onto the MWG human inflammatory array (MWG Biotech AG). A coverslip was carefully placed on the microarray, which was then sealed in the hybridization chamber and placed into an incubator at 42 ℃ overnight. Microarrays were subjected to 5 min washes in 2X SSC, 0.1% SDS followed by 1X SSC, and, finally, 0.1X SSC. The microarrays were scanned at a resolution of 10 µm, using an Affymetrix 428 confocal laser scanner. The microarray images were analyzed using Imagene (Biodiscovery, CA, USA). Signal and background means for both Cy3 and Cy5 channels were calculated for each individual spot. These results were then imported into Genesight (Biodiscovery, CA, USA). The microarrays were corrected by local background correction, which involves subtracting each spot's background from the signal value of the same spot. All of the genes in our dataset were used to calculate normalization parameters. Using all genes assumes that the majority of the genes measured are not differentially regulated. Therefore, when taken as a whole, the population accurately represents the channel bias.
Data analysis
Biodiscovery Genesights 4 (Biodiscovery, CA, USA) was used for the analysis of the data. The data for each of four signals (mean, four signals) were combined and analyzed. All of the data was corrected for background intensity, using local background correction, and multiple spots with flags were omitted. Normalization was performed, using Lowess normalization, with a smoothing parameter of 0.2 and one degree of fitness. Genes that were two-fold up- or down-regulated were partitioned with 95% confidence intervals.
Real-time polymerase chain reaction (PCR) analysis
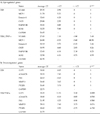
In a LightCycler (Roche Applied Science. Indianapolis, IN, USA), 1 µL from 5 µL of each reverse-transcribed reaction was amplified in a 20 µL PCR mix, containing 4 mM MgCl2, 10 pM each primer, and 1x LightCycler DNA Master SYBR Green 1 mix (Roche Applied Science. Indianapolis, IN, USA). Samples were incubated for an initial denaturation at 94℃ for 30 s, followed by 40 PCR cycles. Each cycle consisted of 95℃ for 10 s, each annealing temperature for 5 s, and 72℃ for 12 s. For the analysis of up- and down-regulated genes, PCR primers, scanning exon-intron boundaries were designed using Primer Premier 5 software (Biosoft International, Palo Alto, CA, USA) and were manufactured by Bioneer (Bioneer, Daejeon, Korea). The oligonucleotide primers for the experiment are listed in Table 1. To confirm the amplification of specific transcripts, melting curve profiles (cooling the sample to 65℃ for 15 s and heating slowly to 95℃ with continuous measurement of fluorescence) were produced at the end of each PCR.
RESULTS
Inflammatory gene expression profile of TNF-α-treated SGBS cells using inflammatory human array
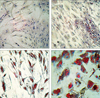
Differentiated SGBS cells were stained with Oil Red O staining 0, 4, 10, and 20 days after the induction of differentiation. Most of the cells were differentiated as adipocytes and filled with lipid droplets at Day 20 after the induction of differentiation (Fig. 1).
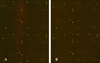
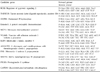
In order to study the effect of a pro-inflammatory cytokine on the gene expression profile of human SGBS cells, we treated differentiated SGBS adipocytes with TNF-α, which has a well-characterized effect in adipocytes. In this study, we replaced the medium of adipocytes on Day 18 with cortisol-free medium and incubated the culture with TNF-α for 24 h on Day 19. The cells were harvested on Day 20, and the gene expression profiles were analyzed using the inflammatory human arrays. From the 136 inflammatory genes present on the arrays, a total of 42 genes were expressed at either day 20 or day 20/TNF-α (Fig. 2). Of these, 11 genes were two-fold up- or down-regulated. In TNF-α-treated SGBS adipocytes, 6 genes were up-regulated, and 5 genes were down-regulated (Table 2). The up-regulated genes were: regulator of g-protein signaling 2 (RGS2), Tumor necrosis factor (ligand) superfamily, member 13b (TNFSF13B), cholesterol 25-hydroxylase (CH25H), eotaxin-1, MCP-1, and vascular cell adhesion molecule 1 isoform a precursor (VCAM1). The down-regulated genes were: IL-1 family member 5 (IL1F5), a disintegrin and metalloprotease with thrombospondin motifs-1 preproprotein (ADAMTS1), fibronectin 1 isoform 1 preprotein (FN1), matrix metalloproteinase 15 preprotein (MMP15), and prostaglandin e synthase (PTGES).
Real-time PCR analysis of up- and down-regulated genes of TNF-α-treated SGBS cells
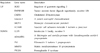
The expression profiles found in the microarray experiments of TNF-α-treated SGBS cells were reexamined by real-time PCR with custom designed primers for candidate genes (Table 1). Of the 6 genes shown through array analysis to be up-regulated, only 3 genes, MCP-1, eotaxin-1, and VCAM1, were also shown by real-time PCR to be up-regulated. Of the 5 genes revealed by array analysis to be down-regulated, 4 genes, IL1F5, MMP15, FN1, and ADAMTS1, were found also by real-time PCR to be down-regulated. PTGES was not down-regulated according to either method (Table 3).
DISCUSSION
The present study shows that treatment of differentiated SGBS cells with the pleiotropic proinflammatory cytokine, TNF-α, increased expression of six, and decreased the expression of five, inflammation-related genes. Real-time PCR analysis did not always confirm the results from array analysis, and reason for this discrepancy may be the cross-hybridization of oligonucleotides in the array with other RNA. It is known that cross-hybridization can give a false high signal for some highly homologous gene sequences.
MCP-1 is a member of the chemokine family. In vitro studies suggest that MCP-1 may contribute to the development of insulin resistance and induce adipocyte dedifferentiation.9 In other studies, MCP-1 mRNA expression has increased in obese mice, leading to elevated levels of plasma MCP-1 protein. The higher levels of MCP-1 protein in plasma were found to increase the CD11b-positive monocyte/macrophage population among peripheral blood cells, suggesting a role for elevated MCP-1 in the vascular inflammatory process during atherosclerosis.10 Eotaxin-1 is a potent eosinophil chemoattractant that is abundant in atheromatous plaques.11 The major receptor for eotaxin-1 is CCR3, which is found on leukocytes and on some non-leukocytic cells. The expression of eotaxin-1 in human adipocytes has not yet been reported. Inflammatory cytokines induce endothelial VCAM1 expression, a response known to be augmented by either TRL or saturated FA.12 Consistent with these reports, it is demonstrated that VLDL and palmitic FA (16:0) both significantly increased VCAM1 mRNA in EC in the presence of TNF-α.
Atherosclerosis involves pathological processes that include athermanous plaque formation, foam cell differentiation, inflammatory reactions, and cell proliferation. Endothelial cell activation by various inflammatory stimuli, including TNF-α, increases the adherence of monocytes, a crucial step in the development of vascular diseases. The expression of endothelial adhesion molecules, including vascular cell adhesion molecule-1, endothelial-leukocyte adhesion molecule-1, and intracellular adhesion molecule-1, plays a pivotal role in monocyte adhesion to the arterial endothelium.13 The expression of MCP-1, eotaxin-1, and VCAM1 in TNF-α-treated SGBS cells demonstrates that adipocytes secrete the molecules involved in atherosclerosis upon proinflammatory cytokine treatment, implying that the proinflammatory cytokine production of overweight subjects might be involved in the development of atherosclerosis.
Among these down-regulated genes in this study, ADAMTS1 and MMP15 are metalloproteinases that degrade extracellular matrix macromolecules and play important roles in tissue remodeling under many physiological and pathological conditions.14 Fibronectin (FN) is a major component of the extracellular matrix, where it is assembled from insoluble polymers and present in the blood as a soluble dimer.15 It has been reported that ADAMTS1 has aggrecanase activity and that its activity is enhanced in cartilage treated with TNF-α, retinoic acid, and 45 kDa fibronectin fragments.16,17 It has also been reported that the expression of several MMPs is elevated in cartilage and synovial tissues of patients with rheumatoid arthritis and osteoarthritis.18,19 There have been a few reports that ADAMTS1 and fibronectin are expressed in adipocytes, but their function in adipocytes is not yet known.20,21 Perhaps adipocyte accumulation initiates an imbalance between matrix synthesis and degradation in healthy cartilage, which, in turn, promotes chondral loss and prevents cartilage self-repair.
IL1F5, a member of the IL-1 family, is relatively abundant in epithelia and may help regulate inflammation in this specific compartment.22 The role of IL1F5, ADAMTS1, FN1, and MMP15 in adipocytes and the reason for their decrease after TNF-α treatment, are unknown at the moment and await further investigation.
In conclusion, we identified several inflammatory molecules, newly expressed in SGBS adipocytes, and also found molecular factors that explain the relationship between obesity and atherosclerosis, with a focus on the inflammatory cytokines expressed by TNF-α-treated SGBS cells.
 XML Download