

 PDF
PDF ePub
ePub Citation
 Print
Print


INTRODUCTION
Panic disorder (PD) is an anxiety disorder characterized by acute intense anxiety attacks.1 PD is often a chronic debilitating condition. Many studies have reported low health-related quality of life and significant behavioral impairment in patients with PD.2 Although less in number, structural magnetic resonance imaging (MRI) studies have also compared the brains of patients with PD and those of healthy subjects. Moreover, quantitative studies have detected a higher incidence of anatomical abnormalities in patients with PD, particularly in the fronto-temporal lobe and insula.34 An investigation found that the mean left temporal lobe volume in these patients was 9% lower than that in controls, and there was a trend towards lower volumes of the right temporal lobe in the PD group.5 In particular, increases in blood flow to the bilateral temporal poles are involved in the panic state in patients.6 The implication that the temporal pole is involved in PD is supported by animal studies, reporting anxiety-related autonomic and behavioral impairment in association with temporopolar stimuli.78
Studies of the functions and connections of the insular cortex propose that sensory inputs converge to the insular cortex and that multimodal sensory information may be integrated there.9 The insula may be an important region in the context of PD as it known to be associated with anxiety sensitivity.10 Gray matter (GM) abnormalities in the insula may be relevant to the pathophysiology of PD as it participates in the evaluation process that ascribes negative emotional meaning to potentially distressing cognitive and interoceptive sensory information.11
Key roles for regions in the prefrontal cortex for the regulation of fear and anxiety have already been reported.12 The ventrolateral prefrontal cortex (VLPFC) consists of three gross anatomical subdivisions: the pars opercularis, pars triangularis, and pars orbitalis. Several studies have investigated the function of VLPFC in patients with anxiety disorder; the pars triangularis is considered to play an important role in the expression of anxiety. According to the study by Kircher, et al.,13 the mid-VLPFC, corresponding to the pars triangularis, is responsible for fear conditioning and emotional processing in PD. It is proposed that the pars triangularis is involved in emotion regulation,14 and lesions in the pars triangularis can lead to the downregulation of fear and anxiety responses, together providing necessary but independent contributions to the top-down control of negative emotions.15
Even though cortical thickness varies between individuals, abnormally thin or thick cortex may be associated with alterations in GM correlated with specific neuropathological conditions, such as Alzheimer's disease, schizophrenia, and epilepsy.16 The thickness of the cortex can be a useful measure for understanding disease progression, identifying related brain regions, and possibly even evaluating treatment options. Although preliminary neuroimaging studies have investigated cortical thickness in patients with a subtype of PD,17 there is no study investigating cortical thickness in patients with PD in general. Moreover, it is necessary to explore abnormalities in cortical thickness in PD and their association with the severity of the symptoms.
Based on previous studies reporting both structural and functional abnormalities in PD, we hypothesized that the temporal pole, insula, and pars triangularis would show significant differences in cortical thicknesses between patients with PD and healthy controls (HCs).
The objective of this study was to examine differences in the cortical thickness of the regions of interests (ROIs), including the temporal pole, insula, and pars triangularis, between patients with PD and HCs and its correlation with clinical symptom severity in patients with PD.
MATERIALS AND METHODS
Subjects
The study subjects were recruited from among a set of patients with PD treated in the Department of Psychiatry at the CHA Bundang Medical Center, between January 2013 and June 2015. The sample consisted of 47 patients with PD [22 men and 25 women; age, 38.09±9.96 (mean±SD) years] and 30 HCs [16 men and 14 women; age, 34.87±8.80 (mean±SD) years]. All subjects were between 18 and 65 years old, Korean, and right-handed. Only subjects without a personal or family history of psychiatric disorders among their first-degree relatives were regarded as HCs in this study. The personal and family histories of the subjects were established through interviews.
Patients included in the PD group met the Diagnostic and Statistical Manual of Mental Disorders-4th edition-text revision (DSM-IV-TR) criteria for PD with or without agoraphobia, as diagnosed by experienced psychiatrists using the structured clinical interview to assess DSM-IV-TR Axis I disorders. In addition, only patients with a primary diagnosis of PD were included. Exclusion criteria for all subjects included any current diagnosis or lifetime history of schizophrenia, bipolar disorder, anxiety disorders other than PD, alcohol and substance abuse or dependence, mental retardation, serious medical or neurological disorders, pregnancy, or any contraindications to brain magnetic resonance (MR) scanning, such as metal implants. At the start of the study, 22 of the 47 patients with PD took medication, including a minimal dose of selective serotonin reuptake inhibitors (SSRIs), including escitalopram or paroxetine [n=22; escitalopram equivalence dosage, 11.00±1.39 (mean±SD) mg/day], and 21 patients with PD took benzodiazepines, including alprazolam or clonazepam as anxiolytics [alprazolam equivalence dosage, 0.88±0.09 (mean±SD) mg/day]. Brain MR scans were obtained within 10 days [4.56±1.17 (mean±SD) days] of the initiation of medication use.
Both the patients with PD and healthy subjects were assessed for clinical severity using the Panic Disorder Severity Scale (PDSS), the Anxiety Sensitivity Index-Revised (ASI-R), the Beck Anxiety Inventory (BAI), and the Beck Depression Inventory (BDI) scales at baseline. The PDSS can measure almost all the dimensions of PD, including the frequency of panic attacks, distress caused because of panic attacks, anticipatory anxiety, agoraphobic fear/avoidance, panic-related sensation fear/avoidance, and work and social impairment. Assessment of the reliability of the PDSS yielded an overall Cronbach's α of 0.83, an inter-rater reliability of 0.88, and a test–retest reliability of 0.96.18 The ASI-R is a revised and expanded version of the ASI19 that was developed to improve the assessment of various dimensions of anxiety sensitivity. It is the most commonly used measure of anxiety sensitivity and includes 36 items. Each item is scored on a scale ranging from “very little” (0) to “very much” (4), and the total score ranges from 0 to 144. The internal consistency coefficient of the Korean version is 0.92 and its test-retest reliability is 0.82. The BAI is a commonly used self-report measure of anxiety. It is a 21-question multiple-choice self-report inventory that is used for measuring the severity of anxiety in children and adults. The questions used in this measure are related to common symptoms of anxiety that the subject has experienced during the week prior to testing.20 The BDI is a commonly used instrument for quantifying the levels of depression. The BDI was developed to assess the type and degree of depression based on the symptoms experienced by the patient.21 The questionnaire consists of questions about emotional, cognitive, motivational, physiological, and other symptoms, reflecting how the participants have felt over the past week.
All the study procedures complied with the CHA Bundang Medical Center's Institutional Review Board regulations, the Declaration of Helsinki, and the principles of Good Clinical Practice. After a complete description of the study was presented to the subjects, written informed consent was obtained.
MRI acquisition and data processing
All participants underwent MR imaging on the same 3T GE Signa HDxt scanner (GE Healthcare, Milwaukee, WI, USA) equipped with an eight-channel phase array head coil at the CHA Bundang Medical Center, CHA University. The parameters for three-dimensional T1-weighted fast spoiled gradient recalled echo (T1-FSPGR) image acquisition were as follows: repetition time, 6.3 ms; echo time, 2.1 ms; flip angle, 12°; slice thickness, 1 mm; field of view, 25.6 cm; 256×256 matrix; isotropic voxel size, 1×1×1 mm3.
FreeSurfer v5.3.0 (http://surfer.nmr.mgh.harvard.edu) was used to process the MR images and to create the ROIs. The details of the procedure have been described in previous papers.22 Briefly, the processing steps include averaging of the volumetric T1-FSPGR-weighted images, removal of non-brain tissue and Talairach transformation, volumetric segmentation, intensity normalization, tessellation of the GM-white matter (WM) boundary, topology correction, and surface deformation following intensity gradients. The cortical thickness was calculated as the closest distance from the GM-WM boundary to the GM-cerebrospinal fluid boundary at each vertex on the surface.22
All images were visually investigated to assess reconstruction errors, including skull-stripping errors, gross parcellation errors, and WM and pial surface inaccuracies. The surface inaccuracies were manually corrected using FreeSurfer's editing tools according to an internal, standardized quality control and editing protocol (by E.K.). The edited images were then reprocessed through the FreeSurfer pipeline to improve the accuracy of the automatic tracing method and the output was visually inspected again. In addition, using the gyral and sulcul anatomy, the cortex was auto-parcellated into different gyral regions per hemisphere; the mean cortical thickness value was calculated for each of these regions using the Desikan-Killiany atlas as a reference. Based on the neuroimaging study by Uchida, et al.,11 we hypothesized that the frontal and paralimbic regions, such as the insula and temporal area, may play a pathophysiological role in PD. Six ROIs (located in the bilateral temporal pole, insula, and pars triangularis) were created using the FreeSurfer program. After the MRI data were processed, the cortical thickness values of all the cortical structures in all subjects were extracted.
Statistical analysis
The mean thickness was extracted for each participant, and the table file was analyzed using the IBM SPSS Statistics 23 software. To compare the cortical thickness of six ROIs between the PD patients and the HCs, we used both an independent t-test and an analysis of covariance (ANCOVA). Independent t-tests were used for simple comparisons of two groups. Thereafter, multiple comparisons were corrected for using the Benjamini-Hochberg false discovery rate (FDR) correction in six ROIs. ANCOVA analysis was applied to control for the effects of age, sex, intracranial volume (ICV), and years of education. For visualizing and confirming the results, we used the method by Hagler, et al.23 described as follows. Briefly, operating within the framework of the FreeSurfer software package, a surface-based version of the cluster-size exclusion method was used for multiple comparison correction. It is a method for generating ROI on the cortical surface using a sliding threshold of cluster exclusion followed by cluster growth. Additionally, an exploratory analysis was performed to assess the relationship between the cortical thickness of the ROIs and the clinical symptom severity in both groups using Pearson's correlation.
RESULTS
Demographic and clinical characteristics of subjects
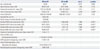
Table 1 presents the demographic and clinical characteristics of the patients with PD and the HCs. There were no statistically significant differences between the two groups in terms of age at the time of the scan, sex, ICV, or income. The HCs were found to have higher education levels on an average, compared to patients with PD. The total baseline PDSS, ASI-R, BAI, and BDI scores were significantly higher in patients with PD than in HCs.
Comparison of the cortical thickness of the temporal pole, insula, and pars triangularis between patients with PD and HCs
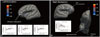
We found that the cortical thickness values of the right temporal pole (p=0.033), left insula (p=0.017), and bilateral pars tri-angularis (p=0.008, left; p=0.025, right) of patients with PD are significantly lower than those of HCs (p<0.05 after Benjamini-Hochberg FDR correction) (Fig. 1, Table 2). This result remained significant after controlling for the effects of age at the time of scan, sex, ICV, and education level using an ANCOVA design. Finally, to rule out possible bias due to the medication effect, we analyzed the ROIs for cortical thickness of PD in escitalopram and paroxetine groups and found that the statistical conclusion remained the same.
Relationship of cortical thickness with symptom severity
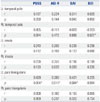
In the patients with PD, exploratory Pearson's correlation showed that the cortical thickness of the right temporal pole was negatively correlated with BDI score (r=-0.333, p=0.027). A positive correlation was observed between the cortical thickness of the left pars triangularis and PDSS (r=0.429, p=0.004), ASI-R (r=0.380, p=0.011), and BAI (r=0.421, p=0.004) scores. However, there was no significant correlation between the cortical thickness of the right pars triangularis or the left insula and any measure of symptom severity (Table 3) (Supplementary Fig. 1, only online).
In the HCs, a significant negative correlation was found between the cortical thickness of the right temporal pole and the ASI-R score (r=-0.434, p=0.017).
DISCUSSION
To our knowledge, ours study is the first to demonstrate reductions in cortical thickness in the temporal pole, insula, and pars triangularis of patients with PD, compared to the HCs, in a relatively large sample size. Our study is also the first to demonstrate that the cortical thickness of the right temporal pole is negatively correlated with BDI score in patients with PD, while the cortical thickness of the left pars triangularis was positively correlated with PDSS, ASI-R, and BAI scores.
Many studies have shown the structural and functional relevance of the temporal pole in anxiety disorders. The brain blood flow measured using positron emission tomography (PET) was lower in the left temporal pole in social anxiety disorder with anticipatory anxiety.24 Cortical thickness analysis demonstrated that the thickness of the right temporal pole was significantly lower in patients with social anxiety disorder than in the control group.25 In a post-traumatic stress disorder study, the regional cerebral blood flow in the temporal pole was higher in patients than in a control group.26 A previous functional MRI (fMRI) study showed that PD was associated with significant increases in blood flow in the bilateral temporal poles.9 The findings from these studies on the temporal pole are similar to our findings in the context of PD. Therefore, we can assume that our study provides many implications for PD pathophysiology.
Recent neuroimaging data, including that acquired using structural MRI, PET, and fMRI, have revealed that the insular cortex plays an important role in the pathogenesis of PD. Our finding that the cortical thickness of the insula is lower in patients with PD than in controls is consistent with previous studies suggesting that the insular cortex is affected in PD. Therefore, PD may be characterized by not only volume reduction or altered metabolism but also by a reduction in the cortical thick-ness of the insular region.
Our finding of reduced cortical thickness for the pars triangularis (mid-VLPFC) in PD is consistent with the result of a previous fMRI study suggesting hypoactivation in the mid-VLPFC in patients with PD, compared to control subjects.27 Furthermore, a structural MRI study using voxel-based morphometry on 53 patients with PD showed that the GM volume in the mid-VLPFC of patients with PD was lower than that of control subjects.28
Although the reasons for the decreased cortical thicknesses of the temporal pole, insula, and pars triangularis in PD are currently unclear, it is possible that these changes may be related to chronic inflammatory processes, based on the idea that many patients with PD are also diagnosed with comorbid major depressive disorder (MDD) and that the pathophysiologies of PD and MDD are similar. A study of an immunological model of PD in the presence of a cytokine abnormality29 supports this assumption. In depression, the activation of TNF-α, a specific pro-inflammatory cytokine, may lead to the hypersecretion of cortisol that results in the loss of neurons or the decreased expression of brain-derived neurotrophic factor, ultimately leading to a thinner cortex.30 Finally, central inflammatory processes resulting in the loss of glial cells, including astrocytes and oligodendrocytes,31 would theoretically induce reduction in the intracellular N-acetylaspartate and glutamate. Another possibility is that thinning of the cortical mantle probably constitutes an individual vulnerability for the development of PD.32
Another interesting finding from the present study is that obtained from the exploratory analyses. In the patients with PD, the decreased cortical thickness of the right temporal pole was negatively correlated with BDI scores, while decreased cortical thickness in the left pars triangularis was positively correlated with PDSS, ASI-R, and BAI scores.
The frontal and temporal lobes are functionally related in the living human brain,33 and the fronto-temporal relationship is known to be critical in the context of PD.13 The prefrontal cortex has long been suspected to play an important role in the cognitive control of emotion and in the ability to organize thought and action corresponding to internal goals.34 Several studies have shown that the temporal pole is an area in the association cortex involved with multimodal analysis, especially in social and emotional processing. The right temporal pole is associated with personal and episodic memories, being more closely associated with emotion and socially relevant memories.35 Many fronto-temporal neuroanatomical correlates that may be responsible for PD pathogenesis have been suggested.
In our study, there was a negative correlation between symptom severity and the cortical thickness of the temporal pole, although a positive correlation was found between the symptom severity and the cortical thickness of the pars triangularis. We can assume that although the frontal cortex and temporal cortex play an important role in the pathophysiology of PD, it appears that the cognitive control of emotion by the frontal cortex compensates for the occurrence of symptoms related to abnormalities in the temporal pole.36 Although the cortical thickness of the pars triangularis in PD patients is thinner than that of HCs on average, it is relatively thicker in individuals with higher anxiety in PD secondary to changes in the cognitive control of emotion by the frontal cortex. That is, the paradoxical correlation of the pars triangularis with these measures might reflect secondary effects to compensate for the reduced paralimbic function, including that of the insula and temporal pole, in PD. Additionally, depressive symptoms are related to the temporal portion in temporal lobe epilepsy,37 and anxiety symptoms are associated with the frontal portion,38 although the disease entities in the studies described above are different from the ones studies by us. These results are consistent with our correlation results. Therefore, we can suggest that the temporal pole could be related to depressive symptoms and the pars triangularis to the anxiety symptoms in PD.
In HCs, the cortical thickness of the right temporal pole was negatively correlated with ASI-R score; in contrast, the cortical thickness of the pars triangularis was positively correlated with ASI-R score in PD. While this discrepancy may be due to the fact that the ASI-R scores or subject number in the HC group were lower than that in the PD group, we can also assume that the mechanisms of anxiety expression in HCs are different from those in patients with PD.
However, this study has some limitations. First, although the findings were controlled for education level using ANCOVA and our statistical conclusions remained the same, we could not completely rule out the possibility that differences in education years between the two groups influenced our results. Second, the imbalance in subject number between the PD and the HC groups may have influenced the results. Third, medications may have affected the cortical thickness alterations in the subjects,39 even though the mean duration of the medication was only 4.56±1.17 (mean±SD) days. Although only about half of the patients were using SSRIs with relatively small doses, they had different pharmacological profiles as determined by escitalopram and paroxetine use. We still cannot completely exclude the possibility that these medications may have an effect on cortical thickness in patients with PD.
In conclusion, the results of this study support the hypothesis that patients with PD have lower cortical thickness in the temporal pole, insula, and the pars triangularis, compared to HC subjects. This decreased cortical thickness in the temporal pole and pars triangularis was significantly correlated with symptom severity.

 XML Download