

 PDF
PDF ePub
ePub Citation
 Print
Print


INTRODUCTION
With the increasing use of low-dose chest computed tomography (CT) screening for lung cancer, asymptomatic incidental lesions are frequently detected in the anterior mediastinum (12). Such lesions generally originate from the thymus, and their long-axis diameter is usually 2 cm or less (median, 1.2 cm; interquartile range, 0.9–1.6 cm; range, 0.5–6.4 cm) (2). Thymic epithelial tumors (TETs) are of primary concern for malignancy, but benign cysts account for many incidental benign lesions. Accordingly, TETs must be correctly distinguished from benign thymic cysts, when anterior mediastinal lesions are incidentally found.
On CT, incidental TETs typically present as round, solid lesions (2), while thymic benign cysts are traditionally recognized as having the CT attenuation of water (≤ 20 Hounsfield unit [HU]) (3). Water attenuation is a key differential imaging feature between cysts and TETs on CT scans. However, recent studies revealed that approximately three-fourths of thymic cysts showed hyper-attenuation to water (45), potentially leading to misdiagnosis as TETs and unnecessary surgical resection (67). Nevertheless, insufficient imaging features capable of distinguishing between TETs and benign cysts, other than water attenuation, have been identified on CT. In addition, although recent studies have suggested additional clinical value for fluorine-18-labeled fluoro-2-deoxy-D-glucose (FDG) positron emission tomography (PET)/CT for predicting histological subtype of TETs, differentiation of benign cysts from small incidental TETs with PET/CT has not been examined (89).
The purpose of this study was to investigate whether CT and 18F-FDG PET findings may serve to distinguish TETs from benign cysts in the anterior mediastinum.
MATERIALS AND METHODS
Study Population
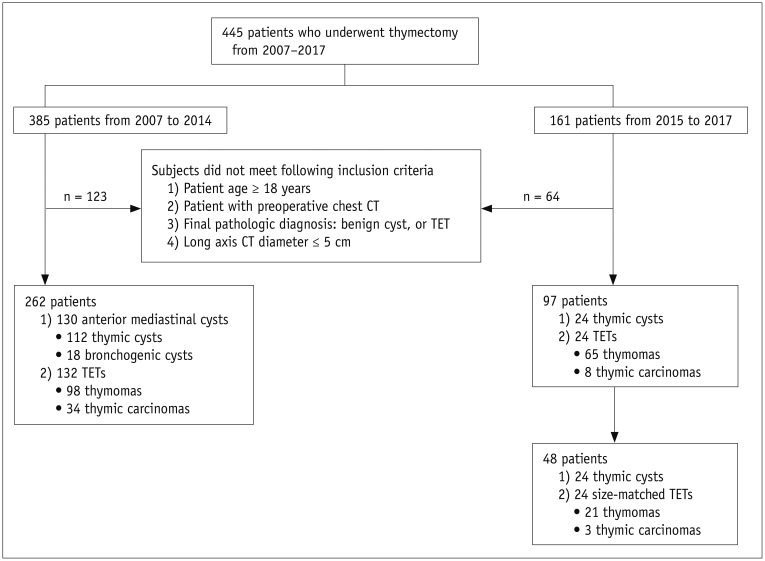
This retrospective study was approved by the Institutional Review Board and informed consent was waived. We applied the following inclusion criteria to the 385 consecutive patients who had undergone thymectomy between January 2007 and December 2014: 1) 18 years old or older; 2) availability of a preoperative chest CT scan; 3) final pathological diagnosis of either TET or benign cyst in the anterior mediastinum; and 4) long-axis lesion diameter of 5 cm or smaller, which encompassed 99% size range of incidental anterior mediastinal lesions in the general population (2). After excluding 113 cases with lesions larger than 5 cm, 262 patients (mean age, 53.0 years; age range, 22–84 years; 135 men and 127 women) were included in this study (Fig. 1). The study group comprised 132 TETs (98 thymomas and 34 thymic carcinomas) and 130 benign cysts (112 thymic cysts and 18 bronchogenic cysts). The distribution of TET histological subtypes according to World Health Organization (WHO) classification is shown in Supplementary Table 1 in the online-only Data Supplement.
To validate the usefulness of differential CT features and to assess inter-observer agreement, we created an internal dataset of patients with pathologically proven TETs or benign cysts in the anterior mediastinum between January 2015 and December 2017 with the same criteria. Among the 24 thymic cysts and 73 TETs, we used a size-matched set of 24 cysts and 24 TETs for validation (mean age, 56.3 years; age range, 25–88 years; 21 men and 27 women).
Image Acquisition
Chest CT examinations were performed using various multidetector scanners: an 8-channel scanner in 43 patients (Lightspeed Ultra, GE Healthcare, Milwaukee, WI, USA), a 16-channel scanner in 46 patients (Sensation 16, Siemens Healthineers, Erlangen, Germany), a 64-channel scanner in 141 patients (Brilliance 64, Philips Medical Systems, Cleveland, OH, USA; Discovery CT750 HD, GE Healthcare; Sensation 64, Siemens Healthineers), a 320-channel scanner in 11 patients (Aquilion One, Canon Medical Systems, Otawara, Japan), and a dual-source scanner in 21 patients (SOMATOM Definition, Siemens Healthineers). Among the 262 CT studies, 97 (37.0%; 45 of 130 cysts and 52 of 132 TETs) had both pre- and post-contrast images; the remaining 165 studies had either pre-contrast (n = 59) or post-contrast images (n = 106). The detailed parameters for CT acquisition were as follows: tube voltage, 120 kVp; tube current, 120–250 mAs with automatic exposure control; slice thickness, 1.0–5.0 mm; reconstruction interval, 0.6–5.0 mm; pitch, 0.9–1.0; rotation time, 0.5–1 second. Post-contrast CT images were obtained 60 seconds after intravenous administration of 90 mL iodinated contrast agent (iopamidol, 300 mg iodine per milliliter) with an injection rate of 3.0 mL/s, followed by 30 mL saline chaser with the same rate.
CT Image Analysis
Two radiologists (2 and 12 years of experience in chest imaging, respectively) reviewed chest CT images on a picture archiving and communication system (INFINITT, Seoul, Korea) in a mediastinal window setting (width, 400 HU; level, 40 HU) to reach consensus. We analyzed conventional morphological features of the lesions and ancillary findings. The morphological features included the bi-dimensional longest long-axis and short-axis diameters, vertical location, contour, margin, shape, calcification, and gross fat; the ancillary findings encompassed adjacent organ invasion, pleural effusion, pericardial effusion, lymphadenopathy, satellite nodules, and distant metastasis. The vertical location was categorized as superior or inferior by comparing the epicenter of the lesion to the upper margin of the heart (10). The lesion contour was classified as smooth or lobulated. The margin was described as well-defined or ill-defined. Lymphadenopathy was considered present, if a mediastinal lymph node had a short-axis diameter of 1 cm or longer.
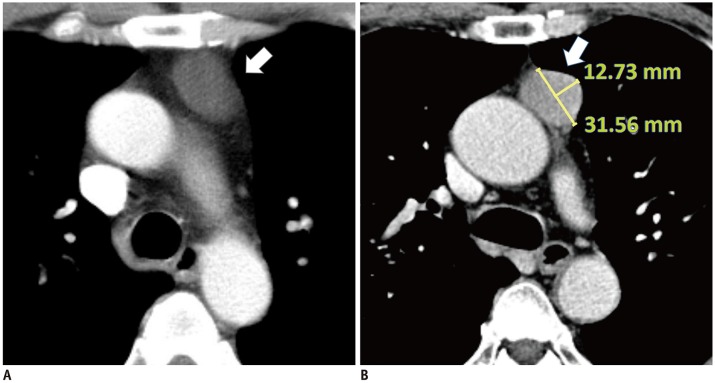
In addition, we evaluated the relationships between lesions and the adjacent mediastinal pleura qualitatively and quantitatively. First, the abutment to mediastinal pleura was visually categorized as no abutment, abutment without protrusion, or abutment with protrusion towards the adjacent lung parenchyma. If a lesion touched the adjacent mediastinal pleura, the reviewers measured the abutment and protrusion lengths using an electronic ruler (Fig. 2). The protrusion length was defined as the perpendicular distance (mm) from the abutted mediastinal pleura to the top of the apex protruding towards the adjacent lung parenchyma. The protrusion ratio was calculated as the protrusion length divided by the length of abutment to the mediastinal pleura. If a lesion did not touch the adjacent mediastinal pleura at all, the protrusion length and protrusion ratio were 0.
One of the authors measured the mean CT attenuation values of the lesions. A circular region of interest (ROI) was placed in the largest possible homogeneously attenuating area. Measured attenuations were subtracted between post- and pre-contrast images to calculate the degree of absolute enhancement. Additional information including the adjacent major cardiovascular structure and the access route of intravenous contrast medium was collected for the 45 cysts with both pre- and post-contrast images. When the absolute enhancement value of a cyst was calculated to be 10 HU or higher, it was considered as pseudoenhancement, which may be a consequence of beam-hardening effects from neighboring major vessels (1112).
18F-FDG PET/CT Analysis
Among the 262 patients, 49 underwent a preoperative 18F-FDG PET/CT scan. A standardized uptake value (SUV) was not obtainable for 9 patients with PET images acquired in other institutions. Accordingly, we analyzed PET/CT images for 40 lesions (12 thymic cysts and 28 TETs, consisting of 17 thymomas and 11 thymic carcinomas). PET/CT scans were performed on an integrated PET/CT scanner (Biograph Truepoint or mCT40, Siemens Healthineers, Knoxville, TN, USA). After fasting for ≥ 6 hours, patients were injected with 18F-FDG (0.14 mCi/kg), and images were acquired 1 hour later. Serum glucose concentrations were measured before 18F-FDG injection and were required to be < 200 mg/dL. A CT scan (40 mA and 120 kVp) was performed for attenuation correction without contrast enhancement prior to PET scanning. CT scans were acquired using a 3-mm section thickness from the skull base to the mid-thigh; images were reconstructed using a 512 × 512 matrix and a 50-cm field of view. PET scans obtained from the mid-thigh to the skull base were reconstructed with a 200 × 200 matrix using the ordered subset expectation maximum iterative reconstruction algorithm, a 5-mm Gaussian filter, and a 78-cm field of view. A nuclear radiologist (with 4 years of clinical experience in nuclear medicine) measured the maximum SUV (SUVmax) of the lesion, correcting for body weight.
Validation of CT Image Interpretation
CT images of 24 thymic cysts (mean long-axis diameter, 2.3 ± 0.9 cm) and 24 size-matched TETs (mean long-axis diameter, 2.3 ± 0.9 cm) were independently evaluated in random order by four radiologists (22, 6, 5, and 5 years of experience in chest imaging, respectively), blinded to pathological results. For the first session, each reader was asked to identify each lesion using the following 5-point scale: 1, thymic cyst, most likely; 2, cyst, more likely than tumor; 3, equivocal; 4, tumor, more likely than cyst; and 5, tumor, most likely. For the second session, the readers were informed of the results of the training dataset, and subsequently asked to measure the CT attenuation of ROI in the pre- and post-contrast images, the abutment length, protrusion length, and protrusion ratio of each lesion, and to determine the presence of protrusion. The 5-point scale was assessed again based on the newly obtained information and measured data. To reduce recall bias, an interval of more than 4 weeks separated the interpretation sessions.
Statistical Analysis
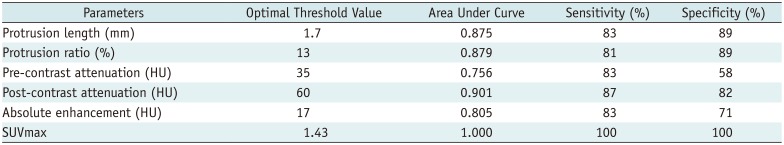
Categorical variables were compared using the chi-square or Fisher exact test, and the independent t test was performed for continuous variables. Fisher's exact test was performed to identify any anatomical factors related to pseudoenhancement of benign cysts. To determine the optimal cut-off for continuous variables, we used receiver operating characteristic (ROC) curve analysis for the following parameters: protrusion length, protrusion ratio, mean attenuation value in pre- and post-contrast images, degree of absolute enhancement, and SUVmax. The diagnostic capacity of SUVmax was compared with that of protrusion length and protrusion ratio, respectively, using the DeLong test. CT attenuation variables were not included in the DeLong test due to the small number of patients who underwent both PET/CT and contrast enhanced CT scan (n = 7).
Univariate and multivariate logistic regression analyses were performed to identify significant CT predictors for TETs (13), and additional multivariate logistic regression analysis was performed between the low risk group (WHO types A, AB, and B1) and cysts.
In the validation dataset, the areas under the ROC curves (AUC) of the two interpretation sessions for each reader were compared using the DeLong test to check whether awareness of the results of the training dataset improved readers' diagnostic performance. Kappa statistics and intraclass correlation coefficients (ICCs) were used to measure inter-observer agreement between radiologists in the validation dataset, with values of 0.00–0.20, 0.21–0.40, 0.41–0.60, 0.61–0.80, and 0.81–1.00 considered as poor, fair, moderate, good, and excellent, respectively. The 95% limits of agreement between paired readers were obtained using Bland-Altman analysis.
All statistical analyses were performed using MedCalc for Windows, version 15.0 (MedCalc Software, Ostend, Belgium). P values < 0.05 were considered to indicate a statistically significant difference.
RESULTS
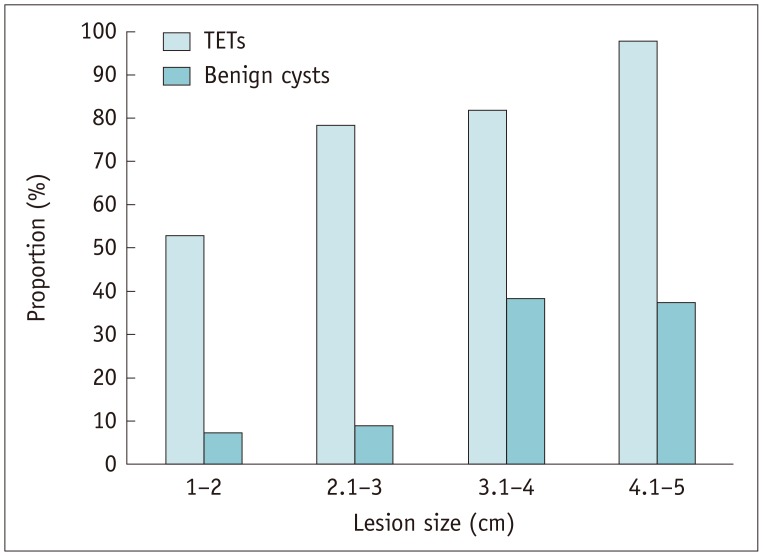
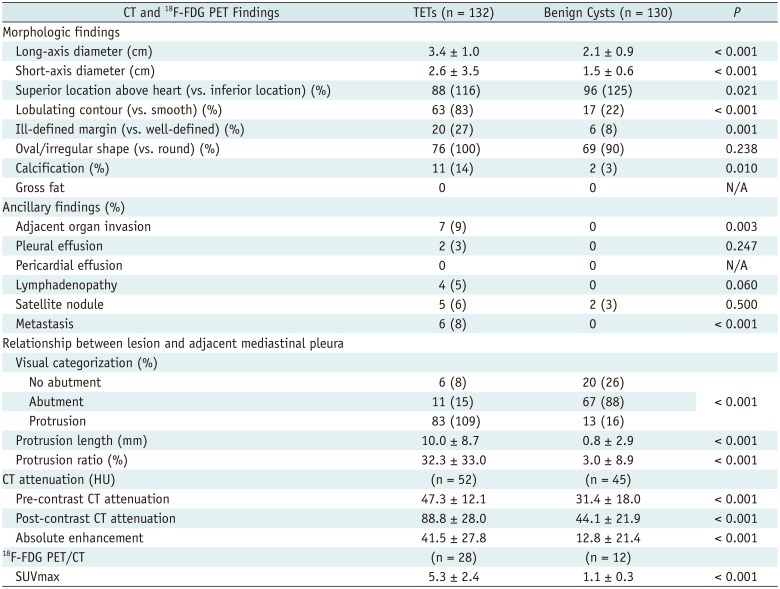
The univariate analysis (Table 1) showed that TETs were significantly larger than benign cysts (mean long-axis diameter, 3.4 cm vs. 2.1 cm; p < 0.001). TETs were more likely than cysts to be located below the upper border of the heart (p = 0.021), to have a lobulated contour (p < 0.001), to have an ill-defined margin (p = 0.001), and to show calcification (p = 0.010). Direct invasion of an adjacent organ (p = 0.003), pleural effusion (p = 0.247), lymphadenopathy (p = 0.060), and distant metastasis (p < 0.001) were exclusively observed in TETs. TETs more frequently protruded from the adjacent mediastinal pleura than benign cysts (83% vs. 13%; p < 0.001), and showed greater length (10.0 mm vs. 0.8 mm; p < 0.001) and larger protrusion ratio (32.3% vs. 3.0%; p < 0.001). The presence of protrusion depended on lesion size (Fig. 3).
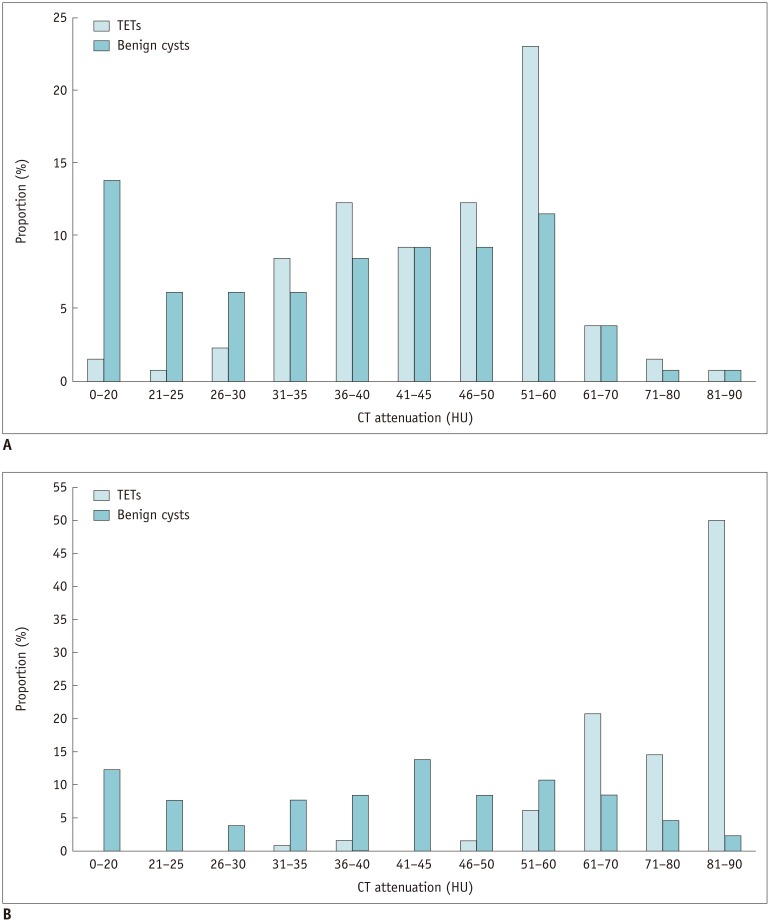
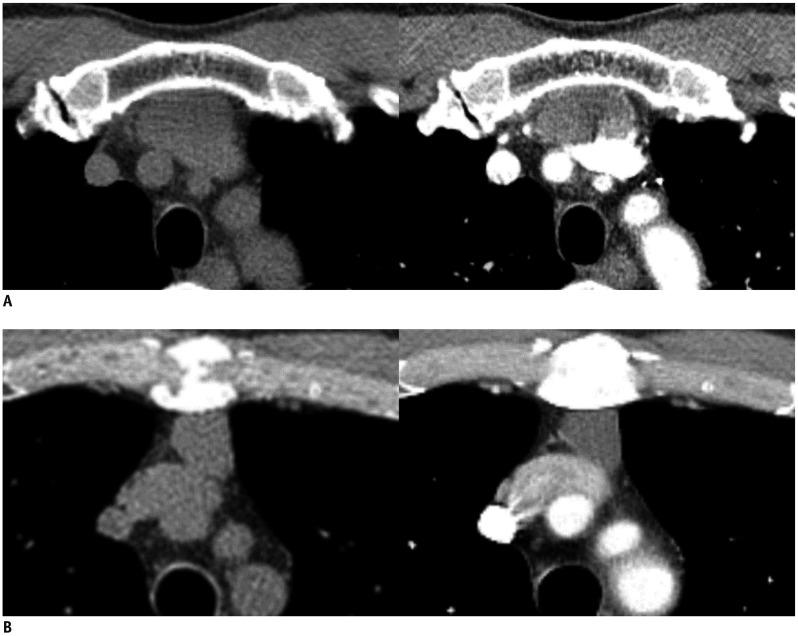
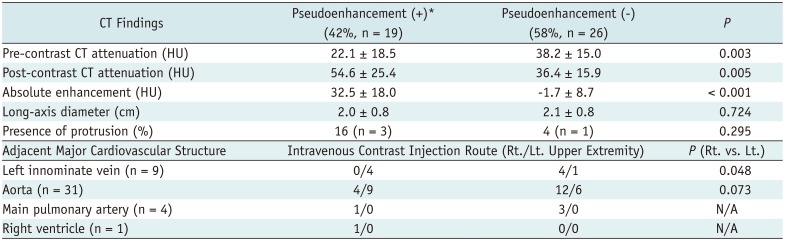
The mean CT attenuation of benign cysts was higher than water attenuation in pre-contrast (31.4 ± 18.0 HU) and post-contrast images (44.1 ± 21.9 HU), and was significantly lower than that of TETs (pre-contrast, 47.3 ± 12.1 HU; post-contrast, 88.8 ± 28.0 HU; each p < 0.001) (Table 1, Fig. 4). The mean absolute enhancement of benign cysts was slightly higher than 10 HU (12.8 ± 21.4 HU) and was significantly lower than that of TETs (41.5 ± 27.8 HU) (p < 0.001). However, 19 of the 45 benign cysts had distinct pseudoenhancement of 10 HU or more on pre- and post-contrast images (32.5 ± 18.0 HU; range, 10.1–66.2 HU). Intravenous contrast medium injection through the left upper extremity was a significant factor for inducing pseudoenhancement at the cysts adjacent to the left innominate vein (p = 0.048) (Table 2, Fig. 5). PET/CT scans showed that mean SUVmax was significantly higher in TETs than in cysts, without any overlap (5.3 ± 2.4 vs. 1.1 ± 0.3; p < 0.001) (Table 1). The optimal threshold values for each continuous parameter obtained from ROC curve analysis are shown in Table 3. The DeLong test revealed that SUVmax has better diagnostic capacity than protrusion length and ratio (p = 0.034 for both protrusion length and ratio).
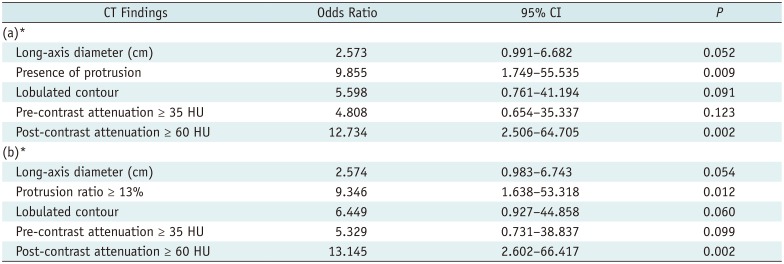
Multivariate logistic regression analysis adjusting for lesion size showed that post-contrast attenuation of 60 HU or higher (odds ratio [OR], 12.734; 95% confidence interval [CI], 2.506–64.705; p = 0.002) and the presence of protrusion from the mediastinal pleura (OR, 9.855; 95% CI, 1.749–55.535; p = 0.009) were significant independent predictors for TETs (Table 4). In the multivariate logistic regression analysis using the protrusion ratio instead of the presence of protrusion, similar results were found for a post-contrast attenuation of ≥ 60 HU (OR, 13.145; 95% CI, 2.602–66.417; p = 0.002) and a protrusion ratio of ≥ 13% (OR, 9.346; 95% CI, 1.638–53.318; p = 0.012) (Table 4). Those findings were also significant independent predictors for discrimination of low-risk thymomas from cysts (Supplementary Table 2-1 and 2-2 in the online-only Data Supplement).
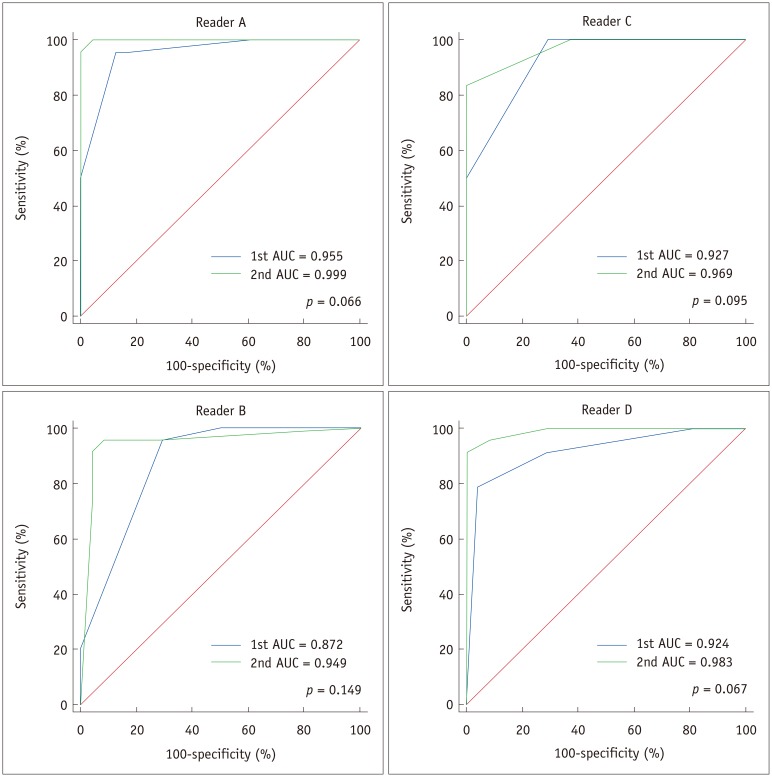
The ROC curve comparisons between the validation sessions for each reader are shown in Figure 6. The AUC values of all four readers increased from 0.872–0.955 to 0.949–0.999 in the second session, although the differences were not statistically significant (p = 0.066–0.149), possibly due to high diagnostic accuracy of the 1st validation session and the relatively small size of the internal dataset.
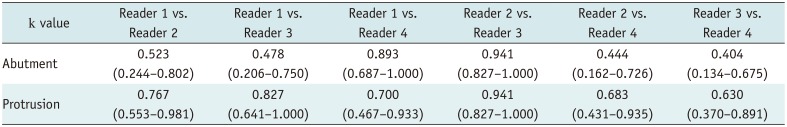
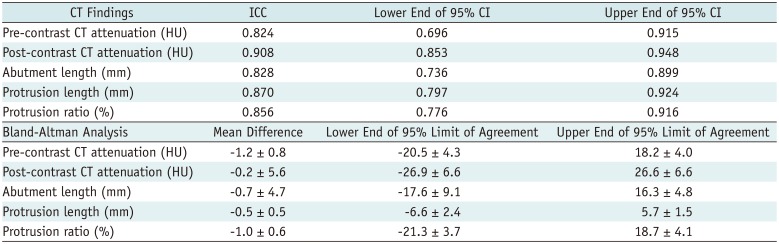
The inter-observer agreement for the presence of abutment and protrusion was moderate to excellent (κ = 0.404–0.941) and good to excellent (κ = 0.630–0.941), respectively (Table 5). The inter-observer agreement for quantitative values of the lesions was excellent (ICC = 0.824–0.908), without showing significant measurement bias between the readers in Bland-Altman analysis. The ICCs and the 95% limits of agreement are summarized in Table 6.
DISCUSSION
Our study found that post-contrast attenuation of ≥ 60 HU and either the presence of protrusion from the mediastinal pleura or a protrusion ratio of ≥ 13% were the strongest CT predictors for TETs. SUVmax ≥ 1.43 served as an exclusive PET predictor for TETs. Being informed of those CT predictors improved readers' performance in distinguishing TETs from benign cysts in the validation dataset, and CT predictors were reasonably well reproduced across readers.
Unlike other simple cysts usually with pure water density on CT, thymic cysts may appear with higher CT attenuation than serous fluid due to their protein-rich content or hemorrhage (4514). Previous studies reported that the mean pre-contrast CT value of thymic cysts was 22.9 HU (range, −19.9–58.2 HU) (7), and that 38.0% of thymic cysts showed higher CT values than water attenuation (> 20 HU) (15). In our study, the mean pre-contrast CT value for cysts was 31 HU, which is consistent with the findings of previous studies. Although the mean pre-contrast CT value for TETs was higher (47 HU), there was no significant between-group difference in the multivariate analysis.
The mean post-contrast CT value of cysts was 44 HU, showing a mean absolute enhancement of 13 HU compared to the pre-contrast phase. Classically, benign simple cysts do not show contrast enhancement. According to Araki et al. (5), the pre-contrast mean CT value for 11 thymic cysts was 45 HU, whereas the enhanced mean CT value was 38 HU, indicating a lack of enhancement. However, in our study, a larger sample (45 cysts) was analyzed and many of our cases showed enhancement mimicking a solid lesion. This can result from pseudoenhancement due to the overlapping beam-hardening effect (11), when the cyst is adjacent to the dense contrast medium passing through mediastinal great vessels (Fig. 5). Pseudoenhancement can cause misdiagnosis of cysts as solid lesions, and this similar phenomenon is widely observed in renal cysts (1112161718). Our results showed that contrast medium injection though the left upper extremity vein increased the chance of pseudoenhancement in cysts adjacent to the left innominate vein (Table 2, Fig. 5). Unlike the right side, the left innominate vein courses through the anterior mediastinum, crosses the midline and thereby there is a higher chance that it is in close contact with a mediastinal lesion.
TETs showed higher mean CT values (89 HU) than cysts on contrast-enhanced CT examinations. ROC analysis revealed an excellent diagnostic performance, with an AUC value of 0.901. The optimal cutoff value was 60 HU, which could distinguish between cysts and TETs with a sensitivity of 86.5% and a specificity of 82.2%. It should be noted that evident contrast enhancement of an anterior mediastinal mass does not necessarily indicate a TET, and it is necessary to consider other soft-tissue lesions such as thymic hyperplasia (19), germ cell tumor (20), or lymphoma (21) in young adults, although those lesions tend to be around 5 cm or larger.
Not surprisingly, protrusion was a characteristic morphological CT finding of even small TETs (52.9% in TETs sized 1–2 cm). Because TETs are neoplasms, they can protrude easily without being confined by low-tension structures such as the lung and mediastinal pleura. In contrast, cysts do not easily protrude from the mediastinal pleura because of their high compressibility. If a cyst shows protrusion, it tends to protrude in a wide and broad-based shape, leading to a low protrusion ratio of up to 10%. In addition, TETs are more frequently found in off-midline locations than cysts (722), which likely contributes to the high protrusion ratio of even small TETs.
Several studies have shown that 18F-FDG PET uptake varies across the histological subgroups of TETs, and it is also known to be useful for distinguishing between benign and malignant lesions (892324). Shinya et al. (9) showed that the diagnostic value of 18F-FDG PET/CT is comparable to CT for predicting thymic carcinoma (AUC = 0.855 vs. 0.853). Tatci et al. (24) showed that SUVmax was significantly higher in solid benign lesions than in cystic benign lesions, but these authors included heterogeneous groups of benign solid masses in their evaluation. Our study found that even small, low-grade thymomas showed significantly higher SUVmax values than thymic cysts. Accordingly, 18F-FDG PET/CT scans can reliably discriminate small cystic lesions from TETs in the anterior mediastinum, although the radiation exposure of PET/CT scans is a concern (25).
Magnetic resonance imaging (MRI) is another imaging modality useful for the characterization of anterior mediastinal lesions (2627). Cysts typically show high signal intensity on T2-weighted images; thus, they may be easily distinguished from solid tumors even in cases with hemorrhage or inflammation that cause high attenuation in CT. Tomiyama et al. (4) reported that correct diagnosis rates for CT and MRI for thymic cysts were 46.0% and 71.0% (p < 0.05), respectively. Nevertheless, accessibility to MRI is limited for some institutions due to high cost and long acquisition times and occasionally MRI requires considerable breath-holding; therefore, CT would be the practical choice for less cooperative patients (2628). There is a consensus that chest CT is a reliable, cost-effective, and appropriate diagnostic tool for thymic lesions according to the European Society of Thoracic Surgeons (29).
Our study has several limitations. First, the study population was retrospectively recruited and various CT scanners were used, although contrast-enhanced CT scans were performed using a standardized institutional protocol. Second, the benign cyst group included the most prevalent cysts in the mediastinum, both bronchogenic cysts and thymic cysts, and we did not analyze the two subgroups separately. In addition, we could not include pericardial cysts in the anterior mediastinum due to paucity of the pathologically proven cysts, which can be correctly diagnosed on CT by water attenuation in most cases (3). Third, we only included TETs in the solid tumor group. Other solid neoplasms can arise from the anterior mediastinum, including germ cell tumors, lymphomas, and neuroendocrine tumors (473031). However, most of those neoplasms occur in young adults and are usually found symptomatically, whereas incidental anterior mediastinal lesions on screening chest CT in the elderly were mostly TETs and cysts (12). Finally, the validation set was relatively small. An additional validation study is required with a larger patient population.
In conclusion, the CT features of post-contrast attenuation > 60 HU and protrusion are useful imaging parameters for distinguishing TETs from cysts in the anterior mediastinum. SUVmax on 18F-FDG PET scans can also be a reliable tool for discriminating these lesions. Unnecessary thymectomy for benign cysts in the anterior mediastinum can be avoided with the help of these CT and 18F-FDG PET findings.
 XML Download