

 PDF
PDF ePub
ePub Citation
 Print
Print


INTRODUCTION
With recent technological developments in MRI including faster scanning acquisitions and new MRI contrast agents (1234), liver MRI is now widely utilized as a primary diagnostic test for the evaluation of malignant liver tumors (5678). However, liver MRI has its inherent problems of low speed, when compared to multidetector CT, resulting in image blurring with decreased spatiotemporal resolution and motion-related artifacts (91011). Various research efforts have been directed towards finding ways to reduce the acquisition time of MR images, including partial k-space sampling (12), parallel imaging (PI) such as sensitivity encoding (SENSE) (1314), and compressed sensing (CS) (101516). Indeed, PI techniques using the inherent spatial sensitivity of the phased-array coils, like the generalized autocalibrating partially parallel acquisition (GRAPPA), SENSE, and controlled aliasing in parallel imaging results in higher acceleration (CAIPIRINHA), have successfully demonstrated improved image quality while maintaining or even shortening acquisition times, making their way into the mainstream of clinical imaging (91718). However, scan time reduction using these techniques has some limitations including phase errors, noise, and imperfection in the coils, especially when PI acceleration factors (AF) > 3 are applied. Therefore, although PI with AF > 3–4 is feasible for recent scanners, three-dimensional (3D) T1-weighted (T1W) images may show unacceptable image degradation (13192021).
In this regard, CS may hold some answers. CS is a relatively new concept in MRI acquisition derived from a mathematical idea, from the approximation and information theories (222324). As maximum amplitudes and slew-rate of gradients are limited in MR acquisition due to the possibility of peripheral nerve stimulation (24), reduction of the acquisition time should be achieved by curtailing redundancies in MRI data (25). The CS technique focuses on the sparsity of images in a certain domain and attempts to avoid under-sampling artifacts using incoherent sampling with nonlinear reconstruction (222426). Moreover, CS-MRI offers a synergistic enhancement to PI with built-in noise reduction. Combining the CS and PI techniques has been shown to provide better-reconstructed images than PI and partial-Fourier techniques, enabling highly accelerated imaging (9152027). However, despite the recently rising interest in CS-MRI among researchers and clinicians for rapid body MRI, CS-MRI is still in its infancy, and there have only been a few reports focused on accelerated 3D T1W imaging, mainly on perfusion imaging using non-cartesian trajectories or pediatric imaging (92628).
Therefore, the purpose of this study was to determine if the CS-SENSE mDixon-3D gradient-recalled-echo (GRE) technique can offer adequate image quality and detectability of solid focal liver lesions (FLLs) in the hepatobiliary phase (HBP) of gadoxetic acid-enhanced liver MRI, when compared with the standard mDixon-3D GRE technique. The HBP sequence was selected not only due to its importance in liver imaging but also because relatively high, homogeneous and prolonged enhancement of liver parenchyma can be achieved during the phase (29303132).
MATERIALS AND METHODS
Patients
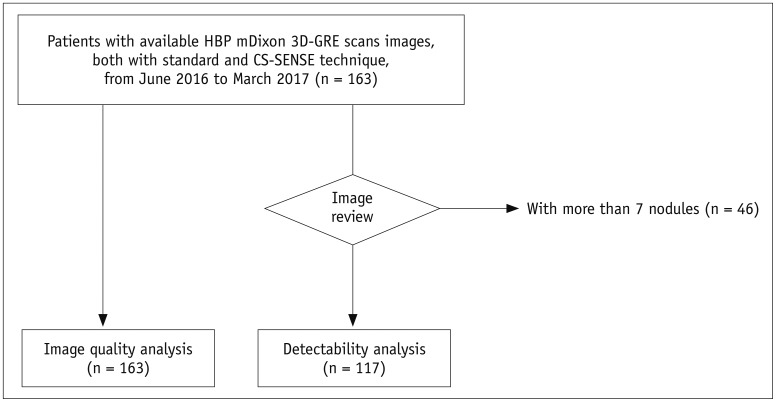
The Institutional Review Board of our hospital approved this retrospective study and the requirement for informed consent was waived. Using a computerized search for MRI images obtained between June 2016 and March 2017 at our institution, 217 consecutive patients who underwent gadoxetic acid-enhanced liver MRI including HBP mDixon-3D GRE using a 3T scanner (Ingenia CX, Philips Healthcare, Best, the Netherlands) were included. Among them, during the initial parameter-optimization period of CS 3D GRE sequence, 54 consecutive patients underwent four different HBP protocols. After that, according to the results of preliminary optimization study, the following 163 consecutive patients underwent two HBP protocols including the HBP mDixon-3D GRE images using the standard two-dimensional (2D) SENSE technique or CS technique (Fig. 1). Primary indications for liver MRI were either for characterization of FLLs detected from ultrasonography or CT, or for the detection of FLLs when suspecting HCC or liver metastases. In total, 54 patients with a mean age ± SD of 60.9 ± 10.8 years (35 men [mean age, 62.6 ± 9.0 years; age range, 46–78] and 19 women [57.7 ± 13.3 years; 35–81]) were included in the preliminary study and 163 patients with a mean age ± SD of 61.8 ± 11.2 years (113 men [69.9 ± 11.3 years; 25–87] and 50 women [63.8 ± 11.1 years; 25–82]) were included in the main study.
MR Image Acquisition
In all patients, MRI was performed using a 3T scanner (Ingenia CX, Philips Healthcare) equipped with multi-transmit RF excitation technology (3334) and a 16-element anterior coil accompanied by a built-in posterior coil. Routine liver MR sequences are described in the Supplementary Materials (in the online-only Data Supplement).
Preliminary Study for Parameter Optimization of CS-3D GRE
For parameter optimization, 54 patients underwent four different HBP protocols including two HBP mDixon-3D GRE scans using the CS-SENSE and two HBP mDixon-3D GRE scans with the 2D SENSE technique. Detailed MR parameters used in the preliminary study and the results are provided in the Supplementary Materials and Supplementary Tables 1 and 2 (in the online-only Data Supplement).
Comparison of HBP Images Using the Standard mDixon-GRE vs. CS-SENSE mDixon-GRE
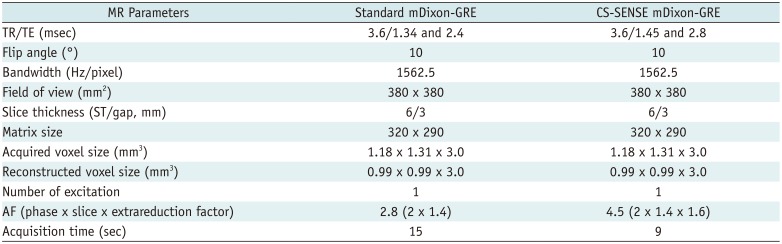
According to the results from preliminary study, for the main study, HBP images were also obtained in the axial plane at 20 minutes after beginning the contrast medium injection using two kinds of T1W image sets: 1) standard mDixon-3D GRE with an AF of 2.8; and 2) CS-mDixon-3D GRE with a total AF of 4.5 (32). Image reconstruction was performed with integrated CS and SENSE reconstruction, which employed both coil sensitivities and sparsity for image acceleration (15). Receive sensitivity correction was implicitly applied in the CS-SENSE algorithm to improve the signal homogeneity of MR images. Detailed MR parameters for T1-GRE scans are provided in Table 1.
Standard mDixon-3D GRE T1W imaging (standard mDixon-GRE) was carried out using the dS-SENSE technique with an AF of 2.8 (2 in the phase-encoding direction and 1.4 in the slice encoding direction). CS-mDixon 3D GRE T1W imaging (CS-SENSE mDixon-GRE) was performed using a total AF of 4.5 (2 in the phase-encoding direction, 1.4 in the slice encoding direction, and 1.6 extrareduction factor accomplished with the integrated CS-SENSE algorithm). K-space sampling was performed in an irregular pattern (variable density Poisson disk). For CS-SENSE reconstruction, a regularization factor corresponding to a denoising level of 20% was used. The regularization factor has an impact on the balance between reliance to the measured data and that to the prior knowledge on the use of wavelets. Therefore, higher the regularization factor, greater the strength of wavelet regularization (higher the denoising value, lesser the noise; albeit more blurring) (24). Total time of reconstruction of the CS-SENSE mDixon-GRE image set was approximately 30 seconds.
Image Analysis
Image Quality Analysis
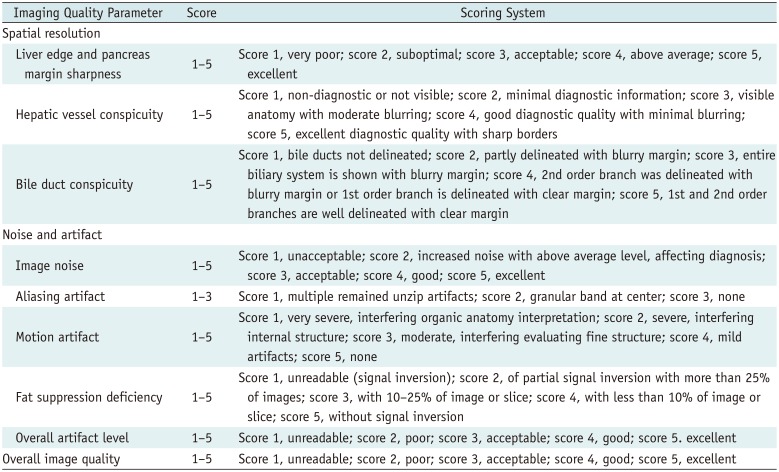
The image quality of each HBP dataset from 217 patients (54 for preliminary study and 163 for formal review) was evaluated by two abdominal radiologists (with 6 and 23 years of experience, respectively, in the interpretation of abdominal MRI) blinded to the MR technique independently, and then in consensus. For each patient, heavily T2-weighted images were given to provide basic anatomical information. Image quality assessment of the two image sets included: blurring of the margins and fine details of anatomic structures, noise and artifacts, and overall image quality. Image blurring was assessed based on organ conspicuity, including liver edge sharpness and pancreatic margin sharpness, hepatic vessel conspicuity, and bile duct conspicuity. For the evaluation of noise and artifacts, overall image noise, the presence of in-plane aliasing artifacts, motion artifacts, fat suppression deficiency, and overall artifact level were graded. The scoring scales were set by referring to previous literature (Table 2) (3235363738). Finally, overall image quality was evaluated on a five-point scale (Table 2).
Detectability of Solid FLLs
For a more concentrated review, only solid nodules were evaluated, and patients with more than 7 nodules were excluded (n = 46). Determination of the presence of true nodules was made by one radiologist (a 3rd-year radiology resident) after reviewing clinical-laboratory information, radiologic examinations including other MR sequences and CT, if available, and follow-up examinations. Finally, 117 out of 163 patients were evaluated: 91 with solid nodules and 26 without solid nodules. In total, 193 nodules were under review: 186 hypo-intense nodules and 7 hyperintensity nodules. The characteristics of the nodules are provided in the Supplementary Materials (in the online-only Data Supplement).
In total, 234 sets of HBP axial scans, either the standard mDixon-GRE or CS-SENSE mDixon-GRE data sets, were randomly distributed with matched heavily T2-weighted images to exclude cysts or hemangiomas. Three independent readers (with 5, 10, and 8 years of experience, respectively) evaluated the lesion conspicuity of each suspected nodule on a five-point scale and recorded the location and size for lesion localization. A picture archiving and communication system workstation (Infinitt, Seoul, Korea) was used.
Statistical Analysis
The image quality of standard mDixon and CS-SENSE mDixon-GRE datasets from the consensus reading and the image quality for lesion detection evaluated by each reader were compared using the Wilcoxon signed-rank test. Levels of interobserver agreement were evaluated using intraclass correlation coefficients (ICCs) with a two-way model: 0.76–1.0, excellent agreement; 0.40–0.75, fair to good agreement; < 0.40, poor agreement (39). Statistical analyses were performed using MedCalc software version 15.8 (MedCalc, Mariakerke, Belgium).
For solid FFL detectability analysis, the primary endpoint of the study was set as the comparison between the ability to detect nodules from standard and CS-SENSE mDixon-GRE data sets. The non-inferiority of the CS-SENSE mDixon-GRE technique over the standard mDixon-GRE technique was established if the lower limit for the 95% confidence interval (CI) for the difference was greater than −0.1, based on previous studies on lesion detection (4041). Figure-of-merit (FOM), i.e., the probability of the rating of the highest-rated lesion with correct localization exceeding that of the highest-rated non-localized mark in a normal case was evaluated and compared with the random case, the fixed reader method of Jackknife alternative free-response receiver operating characteristic (JAFROC) analysis (40) using JAFROC version 4.2.1. For all tests, values of p < 0.05 were considered to indicate statistical significance.
RESULTS
Image Quality Analysis of Standard mDixon and CS-SENSE mDixon-GRE Image Sets
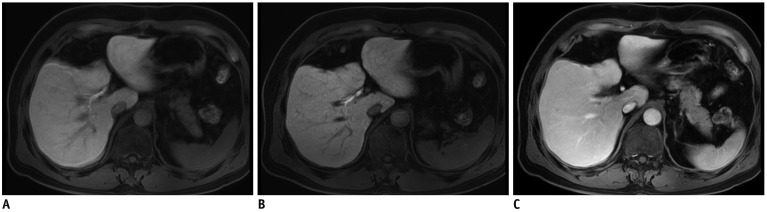
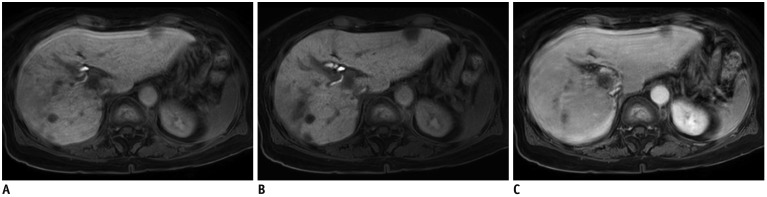
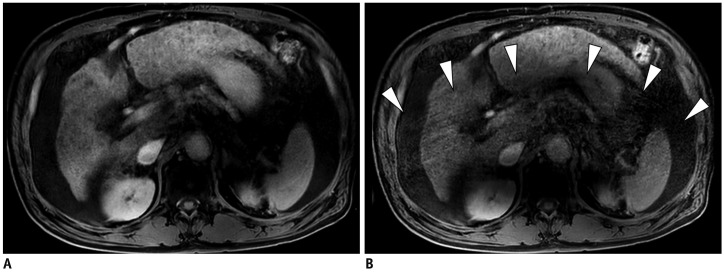
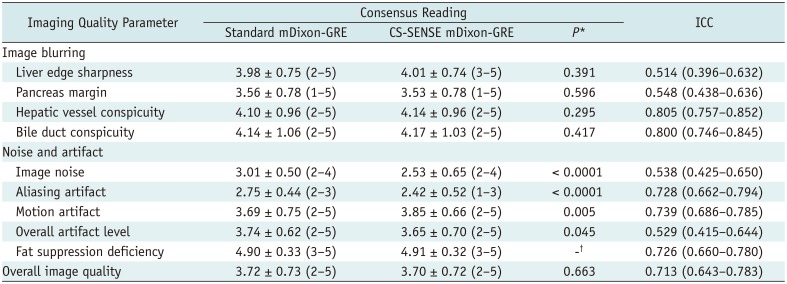
There was no overall difference in image quality between the two HBP scans (p = 0.663). Among all the 163 patients, 4.3% (7/163) were scored as unreadable or poor in overall image quality in both the standard and CS-SENSE mDixon-GRE techniques. However, CS-SENSE mDixon-GRE showed higher image noise (standard mDixon-GRE vs. CS-SENSE mDixon-GRE; 3.01 ± 0.50 vs. 2.53 ± 0.65, p < 0.0001) and aliasing artifacts (2.75 ± 0.44 vs. 2.42 ± 0.52, p < 0.0001) when compared with standard mDixon-GRE. However, CS-SENSE mDixon-GRE showed less motion artifacts (3.69 ± 0.75 vs. 3.85 ± 0.66, p = 0.005) (Table 3, Figs. 2,3,4). The standard mDixon-GRE showed decreased overall artifact level (3.74 ± 0.62 vs. 3.65 ± 0.70, p = 0.045). Two readers showed fair to excellent interobserver agreement on all parameters, of which the ICCs ranged between 0.514–0.805 (Table 3).
Detectability Analysis: Standard mDixon and CS-SENSE mDixon-GRE Image Sets
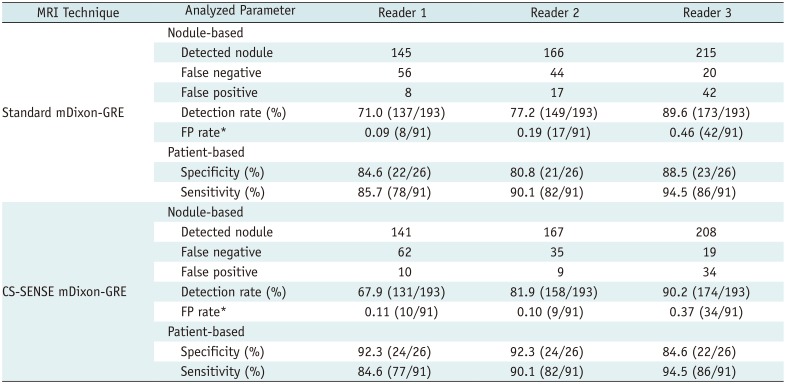
Table 4 demonstrates the estimated values of nodule-based and patient-based performances of the three readers in detecting solid FFLs using the JAFROC analysis. All three readers demonstrated a fair nodule-based detection rate (i.e., detected true nodules/true nodules) using both the standard mDixon-GRE images, 71.0% (137/193), 77.2% (149/193), and 89.6% (173/193), and the CS-SENSE mDixon-GRE images, 67.9% (131/193), 81.9% (158/193), and 90.2% (174/193), for reader 1, 2, and 3, respectively. With respect to patient-based estimate, all readers showed high sensitivities and specificities in both scans, all higher than 0.8 (Table 4).
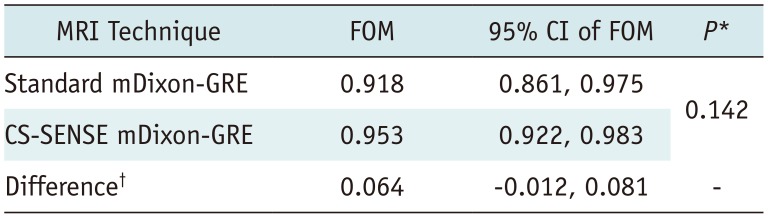
In JAFROC analysis, the reader-averaged FOMs were calculated as 0.918 and 0.953 for standard mDixon and CS-SENSE mDixon-GRE image sets, respectively (Table 5). The 95% CI for the difference in the FOM between the two image sets was −0.012 to 0.081. JAFROC analysis indicated that the difference between the two image data sets was not significant for the detection of solid FLLs at the 5% level (p = 0.142). Finally, the 95% CI for the difference between two FOMs ranged higher than −0.1, which showed non-inferiority of CS-SENSE mDixon-GRE technique in solid FFL detection. Representative cases are presented in Figures 2,3,4.
DISCUSSION
Our study results showed that nine-second breath-hold HBP using CS-SENSE mDixon-GRE provided image quality comparable to that of the standard mDixon-GRE image. Moreover, CS-SENSE mDixon-GRE technique showed non-inferior diagnostic performance when compared with the standard mDixon-GRE method in the detection of solid FLLs. Our study results are in agreement with a previous study on CS-SENSE in phantom and brain imaging (15). Our study also reconfirmed the results of a study by Zhang et al. (42), which showed the feasibility of combined PI-compressed sensing method in pediatric clinical setting. The time resolution we applied on CS-SENSE mDixon-GRE sequence was 1.6 times faster than our standard mDixon-GRE sequence, and 2–2.4 times faster than usual breath-holding time of up to 18–22 seconds given in literature. The confirmed non-inferiority of the CS-SENSE mDixon-GRE sequence over standard mDixon-GRE sequence for detection of solid FLLs may have clinical value in increasing the tolerance of patients to liver MRI, which currently requires multiple, relatively long breath-holding sessions of up to 18–22 seconds.
In addition, we also found that the CS-SENSE mDixon-GRE and standard mDixon-GRE image sets showed differences in image noise and motion artifacts. CS-SENSE mDixon-GRE showed higher image noise but demonstrated lower motion artifacts than the standard mDixon-GRE. Indeed, it can be expected that the CS-SENSE mDixon-GRE image set with higher acceleration may exhibit a higher level of image noise than the standard mDixon-GRE image set due to the undersampling of the data (910). Nonetheless, although previous studies dealing with the CS technique reported that the CS technique created a blurring of fine details in brain and spine MRI (4344), in our study, CS-SENSE mDixon-GRE image showed at least similar results with respect to image blurring (organ margin conspicuity and intrahepatic structures conspicuity). This discrepancy may be attributed to the integrated CS-SENSE algorithm as well as optimization of the regulation parameter for CS-SENSE mDixon-GRE. Previous studies on CS (4344) demonstrated that the artifacts became prominent and disruptive to diagnosis at AF > 2, but we used a reduction factor of 1.6 using CS. The decreased motion artifacts and non-inferior solid FFL detectability of CS-SENSE mDixon-GRE compared with standard mDixon-GRE could be attributed to the shorter acquisition time (Standard vs. CS-SENSE mDixon-GRE, 15 seconds vs. 9 seconds) and random sampling pattern without phase information. Reduced motion artifacts might especially benefit patients with limited respiratory function (Fig. 2). In contrast, the CS-SENSE mDixon-GRE image set showed higher aliasing artifacts, when compared with the standard mDixon-GRE image set, which could be related to the more frequent reconstruction errors from both steps of CS and SENSE (15). However, the disadvantages of higher image noise and aliasing artifacts of the CS-SENSE mDixon-GRE method were balanced out by the occurrence of less motion artifacts when compared with the standard method, and this resulted in equivalent overall image quality between the two techniques.
The results of sparse reconstruction including that for CS techniques depend highly on the choice of the regularization parameters, the sampling pattern of MR data, and the degree of undersampling (11). The choice of the regularization parameters is very important to maintain image quality with the use of CS techniques. An excessively high regularization parameter value can lead to excessive removal of low-value coefficients in the sparse domain, resulting in image blurring or loss of small image features, while an excessively low value can lead to incomplete removal of incoherent artifacts (10). In our study, we used a total AF of 4.5 for CS-SENSE mDixon-GRE images, which is a relatively high acceleration of acquisition speed. In addition, we also used irregular sampling pattern (pseudorandom), which resulted in higher central sampling and lower peripheral data sampling. Furthermore, regularization corresponding to a denoising level of 20% was selected to improve denoising without significant loss in detail. By integrating CS and SENSE reconstruction, which employs both coil sensitivities and sparsity for image acceleration, additional acceleration of 1.6 times could be achieved in both Ky and Kz directions. The selection of additional AF of 1.6 was based on the results of previous studies showing that large noise amplification could occur when AF > 2, when SENSE (Ky or Kz) or CS is used (1520). As solid FFL detectability showed non-inferiority in our study, we believed that CS AF smaller than 2 was chosen for good-quality reconstruction (1624). This may be possible especially for those patients with respiratory difficulties who will most benefit from higher acceleration using the CS technique. Currently, the available 2D PI techniques such as 2D-SENSE or 2D CAIPIRINHA also could reduce the overall acquisition time of 3D T1W GRE imaging for dynamic and HBP examinations from longer than 20 seconds to 13 seconds, using an AF of 4 or 5, with less motion artifacts and improved patient compliance (324546). In our study, however, scans with SENSE technique with AF of 4.5 exhibited high noise and overall artifact level resulting in suboptimal image quality, when compared to standard SENSE.
There are some limitations in our study. First, there might be an inevitable selection bias due to the retrospective study design, but we enrolled consecutive patients to avoid it. Second, the study cohort was a heterogeneous patient population. However, we believe that this may provide a potential benefit in assessing the feasibility of the CS-SENSE mDixon-GRE technique in various clinical circumstances. Third, we fixed the AFs of CS-SENSE mDixon-GRE technique at 4.5. Further studies with different AFs of CS-SENSE are thus warranted. Moreover, comparison with other accelerated methods without using CS will be valuable. Fourth, many solid FLLs were not pathologically confirmed, however, this study was mainly designed for detection rather than a precise diagnosis. Fifth, quantitative measurement of image quality such as signal-to-noise ratio (SNR) was not performed, as the measurement of SNR using a conventional region-of-interest method may not appropriately represent the true SNR due to the nonlinear nature of CS reconstruction (10). Finally, to perform a head-to-head comparison between two sequences in the same individuals, we acquired both image sets during HBP after single administration of gadoxetic acid. Given that during HBP imaging, relatively high, homogeneous and prolonged enhancement of liver parenchyma can be achieved (29303132), the HBP could be considered appropriate to compare the two T1W sequences. However, as dynamic imaging is crucial in making a diagnosis of FLLs, further studies using dynamic images obtained by the CS-SENSE mDixon-GRE methods are warranted.
In conclusion, the CS-SENSE mDixon-GRE sequence provided comparable overall image quality and non-inferior solid FFL detectability when compared with the standard mDixon-GRE sequence in HBP images, with reduced acquisition time.
 XML Download