

 PDF
PDF ePub
ePub Citation
 Print
Print


INTRODUCTION
Despite efforts to control cardiovascular risk factors, coronary artery disease (CAD) is a primary fatality, and the burden of this disease remains high worldwide (1). Invasive coronary angiography (ICA) has a dominant role in the diagnosis and management of CAD. Nevertheless, because of the invasive procedure and complications associated with ICA, noninvasive medical imaging has become increasingly important.
With the development of multidetector computed tomography (CT) scanners, coronary CT angiography (CCTA) has become a powerful imaging modality for detecting coronary artery stenosis (2). CCTA shows high sensitivity and has a negative predictive value to exclude significant CAD (3). However, coronary artery stenosis identified by CCTA has a limited value to predict significant myocardial ischemia, which may cause unnecessary ICA (45).
Whereas CCTA assesses the anatomy of the coronary artery, myocardial perfusion imaging (MPI) evaluates the hemodynamic significance of coronary artery stenosis. Single-photon emission computed tomography (SPECT) is a widely validated and available modality for evaluating myocardial perfusion (678). CT perfusion is a promising alternative for MPI. Recently, dual-energy CT perfusion (DE-CTP), using a dual-source CT scanner, has shown the potential to assess myocardial perfusion, as compared with standard single-energy CT perfusion (9). Furthermore, evaluation with the reference standard of functional stenosis, such as fractional flow reserve (FFR) rather than anatomical stenosis, has been demonstrated to improve the outcomes after revascularization (101112).
Stress perfusion cardiac magnetic resonance (SP-CMR) imaging has shown good diagnostic value in assessing myocardial perfusion (1314). Compared with other imaging modalities, SP-CMR has high spatial resolution and no radiation exposure. Meta-analyses demonstrated a high accuracy of SP-CMR for diagnosing hemodynamically significant coronary artery stenosis using FFR at ICA as the reference standard (1516).
Several previous reports have evaluated the diagnostic performances of CCTA, DE-CTP, and SPECT for CAD. However, there have been no head-on comparisons. Therefore, we investigated the diagnostic value of CCTA, DE-CTP, and SPECT for coronary artery stenosis that causes myocardial hypoperfusion, when compared with combined ICA and SP-CMR as the reference standard. Furthermore, we evaluated whether a combination of CCTA and MPI (CCTA + DE-CTP and CCTA + SPECT) provides better diagnostic performance than each imaging modality alone.
MATERIALS AND METHODS
Patients
This study was reviewed by the appropriate Ethics Committee and was therefore performed in accordance with the ethical standards laid down in the Declaration of Helsinki revised in Brazil 2013. This retrospective study was waived from the need to obtain informed consent by Institutional Review Board of Konkuk University Medical Center. After installation of a dual-source CT scanner in 2008, we designed a prospective study with IRB approval and written informed consent from patient participants, to evaluate the diagnostic performance of DE-CTP and SP-CMR in patients with suspected CAD who have undergone CCTA. Some patients participating also underwent stress perfusion SPECT, conducted in as per discretion of the physician, and was unrelated to the degree of medical condition. Since SPECT was not performed after July 2009, we reviewed the medical records of the patient participants from June 2008 to June 2009. Patients with suspected CAD who underwent CCTA, DE-CTP, SPECT, SP-CMR, and ICA within 2 months, without an interval change in their clinical status or cardiovascular events, were included in the present study. ICA was conducted to evaluate patients for revascularization. Data from patients who did not undergo at least one of these studies were excluded. Finally, we included data from 25 patients (12 women and 13 men; ages 62.1 ± 6.6 years) in the present study.
Image Acquisition
CCTA
All CT examinations were performed using a Somatom Definition Dual-Source CT scanner (Siemens Healthcare, Erlangen, Germany) using the following scanning parameters: collimation 32 × 0.6 mm, slice acquisition 64 × 0.6 mm using the z-flying focal spot technique, gantry rotation time 330 msec, pitch 0.20–0.43 adapted to the heart rate (HR), tube voltage 100 or 120 kV (depending on age and body mass index), and tube current-time product 320 mAs/rotation. Prior to the helical scan, a non-enhanced electrocardiography (ECG)-gated CT scan, prospectively triggered at 75% of the R-R interval, was performed to measure the coronary calcium score. For the CCTA, an ECG-based tube current modulation was implemented with the “MinDose” protocol, except for patients with a mean HR > 80 beats per minute (bpm) or arrhythmia. The full dose window of 30–80% of the cardiac cycle was used in patients with HR of 65–79 bpm; the full dose window of 60–80% of the cardiac cycle was used in patients with HR < 65 bpm.
Patients with a pre-scan HR > 65 bpm were orally administered 50–100 mg metoprolol, 1 hour before CCTA. All patients received 0.6 mg nitroglycerin sublingually immediately before CCTA. Contrast agent application was controlled by a bolus tracking technique. For all CT examinations, a Stellant D Dual-Head Power Injector (Medrad, Indianola, PA, USA) was used to administer a 3-phase bolus at a rate of 4.5 mL/s. First, 70–80 mL iopromide (Ultravist 370®; Bayer Healthcare, Berlin, Germany) was administered. Then, 45 mL of a 70–to–30% blend of contrast media and saline was administered. Finally, 45 mL of saline was given.
DE-CTP
All patients underwent a stress-only DE-CTP examination on a separate day to the CCTA. CT perfusion images at rest were reconstructed using prior single-energy CCTA. Patients were instructed not to drink coffee or tea or take oral beta-blockers for at least 24 hours before the DE-CTP. To avoid their impact on myocardial perfusion, no beta-blockers and nitroglycerine were used. Stress DE-CTP was performed using the same imaging parameters as CCTA. One tube of the dual-source CT was operated with 82 mAs/rotation at 140 kV, and the second tube at 164 mAs/rotation at 80 kV.
Adenosine infusion was started at a constant rate of 140 µg/kg/min over 6 minutes. Retrospectively gated imaging with ECG-based tube current modulation and pitch adaptation was obtained 4 minutes after starting the adenosine infusion. Tube current modulation with the MinDose protocol was used in all patients. Contrast agent application was the same as that in CCTA, except that image acquisition started 9 seconds after the signal density level reached a predefined threshold of 120 HU at the aortic root for increasing differences in contrast enhancement between ischemic and nonischemic myocardium.
SPECT
Electrocardiography-gated perfusion SPECT was performed using a 1-day stress/rest protocol. In a supine position, 296 MBq technetium-99m sestamibi (99mTc-MIBI) was intravenously injected 4 minutes after initiation of adenosine infusion at a rate of 140 µg/kg/min for 6 minutes, and a 3-fold higher dose of 99mTc-MIBI at rest. The ECG was monitored continuously throughout the procedure. A fatty meal was given 30 minutes after 99mTc-MIBI injection to facilitate hepatobiliary clearance. SPECT imaging began 90 minutes after 99mTc-MIBI injection using a dual-head gamma camera with a low-energy and high-resolution collimator (E.cam; Siemens Healthcare). For rest imaging, 99mTc-MIBI injection was performed 3–4 hours after stress imaging. Transaxial, vertical, and horizontal long-axis slices were reconstructed through a filtered back projection (Butterworth filter, cutoff frequency = 0.5) without attenuation correction.
SP-CMR
Stress-perfusion cardiac magnetic resonance was performed on a Signa HDxt 1.5T magnetic resonance imaging (MRI) system (GE Healthcare, Milwaukee, WI, USA) with an 8-element phased array surface coil. Perfusion data were acquired in 3 left ventricular short-axis slices (apical, midventricular, basal) using a hybrid gradient echo/echo-planar pulse sequence (echo time, 1.2 ms; repetition time, 270 ms; flip angle, 25°; slice thickness, 8 mm; preparation pulse 90° for each slice; echo train length, 4; field of view, 360 × 360 mm; matrix, 128 × 128; pixel size, 2.8 × 2.8 mm).
Adenosine was administered using a protocol identical to that for the stress DE-CTP. After 4 minutes of adenosine infusion, an intravenous bolus injection of 0.1 mmol/kg gadopentetate dimeglumine (Magnevist, Bayer Pharma, Berlin, Germany) was injected into an antecubital vein on the opposite arm. Adenosine infusion was stopped after completion of the sequence. Ten minutes after the stress test, rest perfusion in the same orientation was performed using a second bolus of 0.1 mmol/kg gadopentetate dimeglumine. Ten minutes after the second bolus, delayed-enhancement images were acquired in 2 long axes and 10 or 11 short axes, with phase-sensitive myocardial delayed-enhancement sequence.
ICA
An experienced cardiologist performed ICA using an Allura Xper FD10 system (Philips Healthcare, Eindhoven, the Netherlands) according to standard techniques, either by the femoral or radial approach. A minimum of 6 projections were obtained: 4 views of the left coronary artery and 2 of the right coronary artery.
Image Analysis
CCTA
Coronary computed tomography angiography images were reconstructed with a slice thickness of 0.75 mm, and a reconstruction increment was set at 0.4 mm using a medium-soft tissue convolution kernel (B26f). For postprocessing, the CT data sets with the highest image quality were evaluated using a dedicated 3D workstation (Vitrea 2 version 4; Vital Images, Plymouth, MN, USA).
The 3 main coronary arteries, namely the left anterior descending artery (LAD), left circumflex artery (LCx), and right coronary artery (RCA), were evaluated. Lesions with a diameter reduction of 50% or more were considered as significant. Coronary arteries with extensively calcified plaques, or a small stent lumen with dense stent material, were considered as having a significant lesion since the determination of the exact degree of stenosis in the lesion was impossible as a result of the blooming artifact. Evaluation of coronary arteries with severely blurred or doubled vessel contours related to cardiac motion artifact were also considered to be nonevaluable. A coronary vessel was considered as having a significant lesion if there was at least one segment that could not be evaluated or if the vessel had ≥ 50% lumen reduction. Short-axis multiplanar reformatted images were obtained using a 5 mm slice thickness to evaluate the myocardial perfusion at rest. Two experienced radiologists, who were blinded to other imaging data and clinical information, analyzed the CCTA studies by consensus.
DE-CTP
Dual-energy computed tomography perfusion images were reconstructed with a slice thickness of 0.75 mm. A reconstruction increment was set at 0.4 mm using a dedicated dual-energy convolution kernel (D26f) at a mid-diastolic phase. The dual-energy CT-based color-coded iodine distribution maps were superimposed onto gray-scale multiplanar reformats of the myocardium in the short- and long-axis views of the left ventricle using dual-energy image postprocessing software application of the syngo MultiModality Workplace (syngo Dual Energy; Siemens Healthcare). Iodine maps were set to narrow window width and level settings (width 260 HU/level 130 HU), but the evaluating radiologists were allowed to adjust settings as needed. Myocardial perfusion defects on dual-energy CT-based iodine maps were assessed visually and defined as contiguous, circumscribed areas of decreased or absent iodine content within the left ventricular myocardium, relative to remote normal myocardium. DE-CTP images were analyzed using the 3 vascular territorial distributions. Two experienced radiologists, who were blinded to other imaging data and clinical information, performed DE-CTP analysis in consensus.
SPECT
Single-photon emission computed tomography data were reviewed on a syngo Workstation (Siemens Healthcare). Two experienced nuclear medicine physicians, who were blinded to other imaging and clinical information, assessed the SPECT images in consensus.
Combination of CCTA and MPI (DE-CTP and SPECT)
We evaluated the diagnostic performance of the combination of CCTA and MPI (CCTA + DE-CTP and CCTA + SPECT). A positive finding was defined as a positive CCTA finding and myocardial hypoperfusion in the corresponding vessel territory on MPI. A hypoperfusion in a vascular territory with negative CCTA finding was considered a false positive result.
SP-CMR
Stress perfusion cardiac magnetic resonance data were reviewed on a 3D workstation (Advantage Windows; GE Medical Systems, Milwaukee, WI, USA). Myocardial perfusion was determined by a standard method, as previously described, similar to DE-CTP. The presence of hypoenhancement in a coronary artery territory observed in at least four consecutive temporal images and at least two sectional images of contiguous planes under adenosine stress was considered positive for a myocardial perfusion defect. Delayed-enhancement images were analyzed visually for the detection of hyperenhanced segments from the subendocardium to the epicardium. Two experienced radiologists, who were blinded to other imaging data and clinical information, analyzed the SP-CMR images by consensus.
Radiation Dose
The effective radiation dose for CCTA (including calcium scoring), DE-CTP, and SPECT was calculated in all patients. For CT, the dose-length product was converted to mSv by multiplying it by a conversion coefficient (κ = 0.014 mSv·mGy-1·cm-1) (17).
Statistical Analysis
The reference standard was defined as ≥ 50% stenosis by ICA, with a corresponding perfusion deficit on SP-CMR. Using the receiver operating characteristic curve, the sensitivity, specificity, positive predictive value (PPV), negative predictive value (NPV), accuracy, and area under the receiver operating characteristic curve (AUC) with 95% confidence intervals, of each CCTA, DE-CTP, SPECT, CCTA + DE-CTP, and CCTA + SPECT, for detecting hemodynamically significant coronary artery stenosis, were calculated. The 95% confidence intervals were obtained from the Wilson score interval for a binomial proportion. The significance of differences in the sensitivities and specificities of different imaging modalities was identified using the McNemar test. R software ver. 3.2.5 (R Foundation for Statistical Computing, Vienna, Austria) and PASW statistics ver. 17.0 (SPSS Inc., Chicago, IL, USA) were used for the analyses. A p < 0.05 was considered significant.
RESULTS
Patient Characteristics
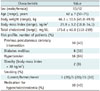
The clinical characteristics of the 25 patients are summarized in Table 1. Coronary stents were implanted at previous coronary interventions in 18 coronary arteries of 10 patients. Using combined ICA and SP-CMR as the standard reference, 18 of 25 (72%) patients had a significant CAD. Of the 18 patients with CAD, 12 patients had an ischemia (67%) and 6 patients had an infarction (33%) on delayed-enhanced SP-CMR images. Single-vessel disease was detected in 11 patients (7 ischemia and 4 infarction), 2-vessel disease in 4 patients (3 ischemia and 1 infarction), and 3-vessel disease in 3 patients (2 ischemia and 1 infarction).
Analysis of Image Findings
The average HRs at the time of CCTA and stress DE-CTP were 62.4 ± 10.7 bpm and 73.5 ± 12.6 bpm, respectively. The median Agatston calcium score of CCTA was 179 (interquartile range, 118.8 to 518.5). The estimated mean radiation exposure levels of CCTA, DE-CTP, and SPECT were 6.8 ± 1.6 mSv (range, 4.2 to 9.1 mSv), 5.0 ± 0.7 mSv (range, 3.5 to 6.1 mSv), and 11 mSv, respectively.
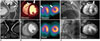
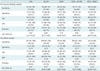
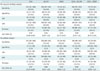
The diagnostic performance of the imaging modalities were evaluated on a per-vascular territory and per-patient basis. The per-vascular territory analysis included the territories of the LAD, LCx, and RCA. The sensitivities, specificities, PPVs, NPVs, accuracies, and AUCs of CCTA, DE-CTP, SPECT, CCTA + DE-CTP, and CCTA + SPECT are shown in Table 2. On a per-vascular territory analysis, the sensitivities of SPECT and CCTA + SPECT were significantly lower than CCTA (all p = 0.008). The specificities of CCTA + DE-CTP, SPECT, CCTA + SPECT were significantly higher than CCTA alone (p = 0.031, 0.039, and 0.002, respectively). Representative examples of imaging modalities are shown in Figure 1.
Among the 18 coronary arteries in 10 patients with previously implanted stents, 10 coronary stents in 8 patients could not be evaluated by CCTA. Hypoperfusion was found on DE-CTP in 7 of 10 coronary stents that could not be evaluated by CCTA. Lastly, 5 coronary stents had a significant instent restenosis on combined ICA and SP-CMR.
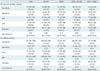
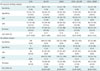
We also investigated the effect of myocardial infarction (MI) and coronary stents on the diagnostic performance of CCTA, DE-CTP, SPECT, CCTA + DE-CTP, and CCTA + SPECT. To evaluate the diagnostic performance of different imaging modalities for ischemic CAD, 6 patients with MI were excluded. The sensitivities, specificities, PPVs, NPVs, accuracies, and AUCs of different imaging modalities in patients without MI, without coronary stent, and with coronary stent are shown in Tables 3, 4, 5, respectively.
DISCUSSION
The present study found that compared with other imaging modalities, the combination CCTA + DE-CTP was better in both sensitivity and specificity for detecting hemodynamically significant coronary artery stenosis, using combined ICA and SP-CMR as the reference standard. Our findings demonstrated the enhanced values of DE-CTP compared to CCTA, wherein the specificity increased from 72 to 85% on a per-vascular territory analysis, and from 14 to 43% on a per-patient analysis. This improved specificity may be due to fewer false-positive arteries that have no significant flow limitation despite their stenosis.
In patients with suspected CAD, approximately one third of the patients had a significant CAD on ICA (18), an invasive technique associated with possible complications (19). In addition, not only the degree, but also the hemodynamic significance of coronary artery stenosis, is an important pathophysiological component for the diagnosis and clinical outcome of patients (20). Revascularization guided by myocardial perfusion measurement reduces late major adverse events (10). As a result, for appropriate management, a more accurate noninvasive evaluation is the first requirement before an elective ICA.
As supported by our previous report (21), the present study shows that CCTA had a high sensitivity for CAD, but the specificity was not sufficiently high, particularly on a per-patient analysis. This may be a consequence of the characteristics of the included patients, who have a relatively high proportion of previous stent implantation and high coronary calcium score, which would increase the number of false-positive results and vessels that cannot be evaluated.
Although DE-CTP showed a high sensitivity, the specificity was relatively lower than SPECT. DE-CTP was performed without a beta-blocker and nitroglycerin on a different day from the CCTA. This resulted in a rapid HR (73.5 ± 12.6 bpm), which affects the image quality of stress DE-CTP. DE-CTP is prone to cardiac motion artifacts because of the limited temporal resolution (330 ms), which is insufficient to overcome a rapid HR. In addition, normal nonuniform distributions of iodine within the myocardium and beam hardening artefacts might be misinterpreted as myocardial perfusion defects (22).
In the current study, the sensitivities of CCTA and DE-CTP were relatively higher than our previous prospective studies (2324). Compared with our previous studies, this study included more patients with MI. This selection bias might result in the higher sensitivities of cardiac imaging modalities. As shown in Table 3, when the patients with MI were excluded, the sensitivities of CCTA, DE-CTP, SPECT, CCTA + DE-CTP, and CCTA + SPECT were mildly decreased.
Single-photon emission computed tomography demonstrated a high specificity but low sensitivity, compared with other imaging modalities. SPECT is considered to have a poorer spatial resolution than other imaging modalities. Particularly, it shows an inadequate performance for detecting subendocardial perfusion defects or 3-vessel diseases (25). The spatial resolution of SPECT is approximately 10 mm, which is similar to the thickness of the heart wall. Therefore, a subendocardial infarct is beyond the spatial resolution of SPECT (26). Compared with conventional SPECT cameras, the more recently introduced SPECT camera with a semiconductor cadmium-zinc-telluride (CZT) detector has been reported to have a better image quality, reduced image-acquisition time, and lower radiation dose (2728). This CZT-based SPECT may provide better diagnostic accuracy than the conventional SPECT.
The presence of coronary stent by previous intervention affected the diagnostic performance of CCTA, DE-CTP, SPECT, CCTA + DE-CTP, and CCTA + SPECT. CCTA is not usually recommended in patients with coronary stents because of the high nondiagnostic rates (2930). In this study, all the cardiac imaging modalities showed an inferior diagnostic performance in patients with coronary stents than in those without coronary stents. However, even in patients with coronary stents, the combined evaluation of CCTA and DE-CTP improved the specificity and PPV on a per-vascular territory analysis compared with CCTA alone.
There are several limitations to this study. Most importantly, the results were obtained by a retrospective review of a small study population, which weakens the statistical power. As a result, the 95% confidence intervals of the sensitivities, specificities, PPVs, NPV, and accuracies were mostly overlapping, which suggests no significant difference. In addition, the patient-selection bias may have influenced the determined diagnostic performance of the imaging modalities. Hence, further prospective and multicenter studies are necessary. Second, we used the combination of ICA and SP-CMR as the standard reference. Measurement of the FFR is now considered the reference standard for evaluating the hemodynamic significance of coronary artery stenosis, and FFR-guided revascularization has become more widely accepted (101112). Thus, ICA with FFR should have been used as the reference standard. In addition, an MRI scanner with magnet strength of 1.5T was used in the present study. Recently, 3T MRI has also been made available in the clinical setting (15). A field strength of 3T offers a higher signal-to-noise ratio and contrast-to-noise ratio than 1.5T, which improves the image quality (31). Therefore, 3T MRI may achieve better diagnostic performance than 1.5T MRI. Third, stress DE-CTP was performed on a separate day from CCTA. The stress DE-CTP was compared to rest CT perfusion obtained by single-energy CCTA. However, this protocol design was justified by considering the reduction of patient radiation exposure. Fourth, our results are only applicable to the specific CT scanner because the dual-source CCTA and stress DE-CTP protocols are not feasible with other conventional CT scanners. Fifth, considering the current recommendations, the patients included were exposed to a high cumulative level of radiation, but each imaging modality was performed according to a widely accepted protocol. No significant adverse effects of radiation exposure were found in the patients during a follow-up of at least 5 years. Nevertheless, we recommend future studies to be performed with significantly reduced radiation doses.
In conclusion, compared with other imaging modalities, the combination of CCTA and DE-CTP enhances the specificity without a loss of sensitivity for the diagnosis of CAD, using combined ICA and SP-CMR as the reference standard. Therefore, CCTA may be recommended as the first study in patients with suspected CAD. An additional DE-CTP may be helpful in patients with intermediate stenosis or equivocal findings on CCTA to determine the hemodynamic significance of coronary artery stenosis.
 XML Download