

 PDF
PDF ePub
ePub Citation
 Print
Print


INTRODUCTION
There are a number of MR methods for visualizing the venous systems of the head and neck area. These include single-phase contrast-enhanced MR venography (CEMRV), time-of-flight MR venography (TOF MRV), and phase-contrast MR venography (PCMRV) (123). Recent reports suggested the feasibility of time-resolved contrast-enhanced MR angiography (TRMRA) for evaluating venous structures in the head and neck (456789). TRMRA images acquired during the first pass of the contrast bolus are similar to those obtained using digital subtraction angiography. Those studies used latter-phase image sets of TRMRA to assess the venous system (567).
Because there is a trade-off between temporal and spatial resolution in TRMRA, currently available TRMRA techniques are based primarily on view-sharing methods (1011). Although those methods enabled the increased frame rate of multiphasic images, they elongated the temporal footprint compared with the image update time on acquired multiphasic images (12). Temporal footprint is the duration over which any views used for a single image are acquired with view-sharing methods (12). Usage of multiple shared samplings over time elongated the temporal footprint. A considerably long temporal footprint resulted in poor arterial-venous separation, and consequently, the venous phase of current TRMRA was not a vein-only image but an image with simultaneous the visualization of arteries and veins. In this study, we presented a practical method for removing the arterial contamination on TRMRA venous phase images by subtraction. The purpose of this study was to evaluate the image characteristics of the subtraction MR venography (SMRV) compared with standard MR venography (MRV) images.
MATERIALS AND METHODS
Patients
This retrospective study was approved by our Institutional Review Board and complied with Health Insurance Portability and Accountability Act guidelines. The requirement to obtain informed consent was waived. From May 2013 to November 2013, 25 consecutive patients underwent MRV imaging at our hospital. One patient was excluded because of a severe motion artifact of TRMRA, and three were excluded because of loss of source data. A total of 21 patients (9 men and 12 women; mean age, 47.6 ± 13.7 years; range, 21-73 years) were included. Clinical indications for MRVs were variable and included preoperative evaluation of intracranial venous system (n = 15), suspected dural sinus thrombosis (n = 3), follow-up after diagnosis of dural sinus thrombosis (n = 2), and clinically suspected intracranial hypertension (n = 1).
Standard MR Venography Acquisition
All scans were performed using a 3T system (MAGNETOM Verio, Siemens AG, Healthcare Sector, Erlangen, Germany) with a 16-channel head and neck coil. The standard MRV protocol in our hospital includes PCMRV, CEMRV, and TRMRA. TRMRA was performed after PCMRV and CEMRV for hemodynamic information; we used vendor-standard protocols for PCMRV and CEMRV. Before positioning the patient, a 20-gauge cannula was inserted into an antecubital vein and connected to an MR-compatible electronic power injector (Spectris; Medrad Inc., Pittsburgh, PA, USA). Three-dimensional PCMRV images were acquired sagittally for the velocity encoding (VENC) values of 20 cm/s. Flow was encoded along all three orthogonal directions. A total of 144 slices with a 0.9 mm thickness and no interslice gap were centered as a single volume at the internal occipital protuberance in order to cover the torcular region, the transverse and sigmoid sinuses, the jugular bulbs and the initial portion of the jugular veins. Image parameters included repetition time/echo time/flip angle = 43.3 msec/6.85 msec/15°, 256 × 256 for the frequency/phase encoding matrix, with a numer of excitation (NEX) of 1, no flow compensation, and a 300 Hz/pixel bandwidth. An isotrophic 0.9 × 0.9 × 0.9 mm3 voxel was acquired on 230 × 230 × 130 mm3 field of view. The generalized autocalibrating partially parallel acquisitions (GRAPPA) parameters were set to an acceleration factor of 3 in the phase encoding direction with 24 reference k-space lines for calibration. The total scan time was 4 minutes 20 seconds.
For CEMRV, non-contrast and contrast-enhanced datasets were obtained using the same parameters except for contrast infusion. After intravenous injection of 0.1 mmol/kg of gadobutrol (Gadovist, Bayer Healthcare, Berlin, Germany) at 1.5 mL/s, followed by a 20 mL saline flush at the same rate, acquisition of the enhanced dataset was started manually as soon as the contrast agent was visible in the superior sagittal sinus on sagittal two-dimensional real-time fluoroscopy. Pre- and post-contrast acquisition was performed in the sagittal plane using a fast gradient recalled echo sequence with elliptic centric k-space reordering (13). A total of 256 slices with a 0.6 mm thickness and no interslice gap were centered as a similar volume of PCMRV. Image parameters included repetition time/echo time/flip angle = 4.32 msec/1.64 msec/23°, 384 × 384 for the frequency/phase encoding matrix, a NEX of 1, and 470 Hz/pixel bandwidth. A 0.6 × 0.6 × 0.6 mm3 isotrophic voxel was acquired on 230 × 230 × 150 mm3 field of view. The GRAPPA parameters were set to an acceleration factor of 3 in the phase encoding direction with 24 reference k-space lines for calibration. The total acquisition time was 2 minute 27 seconds. CEMRV data was acquired by subtracting the pre-contrast and contrast-enhanced images.
TRMRA Acquisition and Post-Processing for Subtraction MR Venography
Time-resolved contrast-enhanced MR angiography was performed using the time-resolved angiography with stochastic trajectories (TWIST) technique after intravenous injection of a low dose (0.03 mmol/kg bolus at a flow rate of 1.5 mL/sec followed by a 20 cc saline flush at the same rate) of gadobutrol (14). TRMRA images were acquired in the coronal plane. Image parameters included repetition time/echo time/flip angle = 2.82 msec/0.99 msec/16°, 256 × 256 for the frequency/phase encoding matrix, a NEX of 1, and 540 Hz/pixel bandwidth. The acquired voxel size was 1.6 × 1.6 × 1.5 mm3 on 400 × 400 × 190 mm3 field of view. The GRAPPA parameters were set to an acceleration factor of 6 (3 in the phase-encoding direction and 2 in the slice-encoding direction) with 24 reference k-space lines for calibration. For the TWIST sequence, values of 8% for A (size of the central k-space region) and 20% for B (sampling density in the peripheral region) were used (101114). A total of 60 seconds was covered with a temporal resolution of 0.98 seconds after interpolation. The temporal footprint was eight seconds.
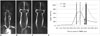
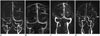
Subtraction MR venography was obtained by post-processing the TRMRA data. After reviewing the time-series of the coronal and sagittal maximal intensity projection (MIP) TRMRA images, a neuroradiologist chose two phases from each patient's TRMRA (Fig. 1A, B), a phase just before the visualization of the right internal jugular vein (phase A; Fig. 1A, thin line on Fig. 1D) and another phase with peak opacification of the right internal jugular vein (phase B; Fig. 1B, thick line on Fig. 1D). The A and B phases were selected for each patient based on the evaluation of his or her TRMRA images with 30 mm3 region of interest (ROI) on the mid-portion of the right internal jugular vein (black circle on Fig. 1B). After automated co-registration of the volume data for those two phases, a voxel-by-voxel subtraction was performed (phase B-phase A). Negative values were considered zero. Acquired volume data were used for variable image reconstructions, such as rotational MIP images (Fig. 1C) and thin slice multi-planar reformation (MPR) images. Image data were processed using commercially available software (Aquarius iNtuition, TeraRecon, Inc., Foster City, CA, USA).
Image Assessment
After randomizing the order of total 63 sets of three different MRVs, two experienced neuroradiologists who were blinded to patient clinical information assessed the horizontal and vertical rotational MIP images of MRVs. Axial thin-slice MPR images were assessed to confirm suspicious or inconclusive findings on rotational MIP images. The reviewers first evaluated the general image quality on a four-point Likert scale (0, non-diagnostic; 1, suboptimal and limited diagnostic value; 2, acceptable quality; 3, good image quality). The presence of arterial contamination was assessed on a four-point scale (0, no arterial contamination; 1, arterial visualization, less intense than venous structures; 2, arterial visualization, similar intensity with venous structure; 3, arterial visualization, higher intensity than venous structures). The reviewers also scored 19 pre-defined venous structures (superior sagittal sinus, inferior sagittal sinus, right and left internal cerebral veins, right and left basal veins of Rosenthal, vein of Galen, straight sinus, torcular herophili, right and left cavernous sinuses, right and left inferior petrosal sinuses, right and left transverse sinuses, right and left sigmoid sinuses, and right and left jugular bulbs) on a five-point scale that had been introduced in previous studies; 4 for intense and continuous visualization, 3 for faint and continuous visualization, 2 for non-continuous visualization with small gap, 1 for non-continuous visualization with large gap, and 0 for non-visualization (67). Cerebral vein score was calculated by summing the scores of five cerebral veins (right and left internal cerebral veins, right and left basal veins of Rosenthal, and vein of Galen). Dural sinus score was calculated by summing the scores of 14 dural sinuses. In addition, total vein score was calculated by summing all 19 venous segments. To assess the intra-observer reliability of qualitative assessment, the same assessment was done by the first reviewer after three months in random order to avoid recall bias.
To assess quantitative image quality, ROIs were drawn on the mid-sagittal images of the three different MRVs by a neuroradiologist. A ROI was placed for the signal measurement of the proximal portion of the superior sagittal sinus. Then, another ROI of the same size was placed at the anterior aspect of first ROI but not including vascular structures. The mean signals of the superior sagittal sinus (SISSS) and background tissue (SItissue) were obtained from each ROI. To determine background noise, three ROIs of the same size were placed in air, anterior to the frontal bone, posterior to the occipital bone, and posterior to the neck. The mean of the standard deviations of these three measurements were used for estimate of background noise (7), because background noise is not uniform in parallel imaging (1516). The signal-to-noise ratio (SNR) and contrast-to-noise ratio (CNR) were calculated using the following equations: SNR = SISSS / Noise, CNR = (SISSS - SItissue) / Noise. Measurements were taken using ImageJ (ver 1.47, U.S. National Institutes of Health, Bethesda, MD, USA, http://imagej.nih.gov/ij/).
Statistical Analysis
Inter- and intra-observer reliability for assessing image quality and arterial contamination scores were evaluated by linear weighted κ statistics. Inter- and intra-observer reliability of dural sinus score, cerebral vein score and overall score were assessed by intraclass correlation coefficient. Scores for image quality and arterial contamination for the three MRV methods were compared using the non-parametric Friedman test. In addition, dural sinus score, cerebral vein score, and total vein score of the three MRVs were compared using Friedman test. Quantitative results including the SNR and CNR of the three MRV methods were also compared with the Friedman test. Post hoc analysis was conducted using the Wilcoxon signed rank test with Bonferroni correction. Statistical analysis was performed using commercially available software (MedCalc, Mariakerke, Belgium).
RESULTS
Subtraction magnetic resonance venography images were generated successfully for all 21 patients. In general, the total post-processing time was shorter than ten minutes including review of the MIP images of TRMRA, optimal phase selection, and subtraction. There were individual variations in the times of phases A (mean, 28.5 ± 7.6 seconds; median, 31.9; interquartile range (IQR), 23.9-35.9) and B (mean, 41.4 ± 7.5 seconds; median, 42.7; IQR, 36.2-47.9) among the 21 patients. However, the mean difference between phases A and B was more consistent among patients (mean, 12.9 ± 3.6 seconds; median, 12; IQR, 10-15) than the time-to-center of phases A or B.
The inter-observer reliability of the image quality scores was good in all three MRVs (κ = 0.611, 0.638, and 0.644, for PCMRV, CEMRV, and SMRV, respectively), and the intra-observer reliability of the image quality scores were also good in all three MRVs (κ = 0.774, 0.788, and 0.644, for PCMRV, CEMRV, and SMRV, respectively). Inter- and intra-observer variability of arterial contamination scores was good to excellent (κ = 0.679, 0.647, and 1 for inter-observer reliability of PCMRV, CEMRV, and SMRV, respectively, and κ = 0.838, 0.824, and 1 for intra-observer reliability of PCMRV, CEMRV, and SMRV respectively). Intra-observer variability of dural sinus score, cerebral vein score and total vein score was excellent (intraclass correlation coefficients were between 0.950 and 0.967). Inter-observer variability of dural sinus score, cerebral vein score and total vein score was good to excellent (intraclass correlation coefficient were between 0.817 and 0.949).
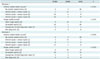
The image quality of the three MRV methods was statistically different in both reviewers (p < 0.001). Post hoc analysis suggested that CEMRV (median score 4 in both reviewers) had better image quality than the other MRV techniques (Table 1). Image quality of SMRV (median score 3 in both reviewers) was comparable with that of PCMRV (median score 3 in both reviewers) (p = 0.999). In terms of arterial signal suppression, SMRV (median score 0 in both reviewers) showed significantly better suppression than other two MRV methods (p < 0.001). There was no CEMRV or PCMRV without arterial signal contamination. Specifically, PCMRV showed similar or stronger arterial structure signals than venous structures in 20 patients. In contrast, SMRV showed only one case of arterial contamination, and it was weaker than the venous signal.
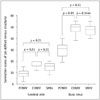
There were significant differences in total vein scores, dural sinus scores and cerebral vein scores in the three MRVs (Table 2). Post hoc tests revealed the highest total vein scores for CEMRV (median and IQR 68, 63-70 and 66, 61-70 in reviewer 1 and 2, respectively), which were significantly different from the other MRVs in both reviewers. In addition, SMRV (median and IQR 62, 60-67 in reviewer 1, 63, 57-64 in reviewer 2) had significantly higher total vein scores than PCMRV (39, 34-45 and 37, 32-42 in each reviewer, respectively). This tendency was same in cerebral vein score. In contrast, the dural sinus scores of SMRV (median and IQR 48, 43-50 in reviewer 1, 47, 43-49 in reviewer 2) and CEMRV (median and IQR 50, 47-52 in reviewer 1, 49, 45-51 in reviewer 2) were not significantly different in the post hoc test (p = 0.146 in reviewer 1 and p = 0.121 in reviewer 2). Dural sinus scores of CEMRV and PCMRV (median and IQR 31, 25-34 in reviewer 1, 30, 23-32 in reviewer 2) were significantly different (Fig. 2).
There were significant differences in the SNR and CNR values among the three MRV techniques (Table 3). Post hoc testing suggested that the SNR and CNR of SMRV (median and IQR 104.5, 83.1-121.2 and 104.1, 74.9-120.5, respectively) were significantly higher than those of PCMRV (median and IQR 59.4, 49.2-74.9 and 53.6, 43.8-69.2, respectively) but lower than those of CEMRV (median and IQR 105.3, 111-182.6 and 148.4, 108-178.2, respectively) (p = 0.043). This result correlated well with image quality scores.
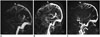
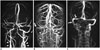
Representative cases are presented in Figures 3-5. A patient (Fig. 3) with a falx meningioma showed obliteration of the superior sagittal sinus on all three MRV images. Surgical findings confirmed the invasion of the meningioma into the superior sagittal sinus. Another patient (Fig. 4), who was undergoing follow-up after diagnosis of dural sinus thrombosis in the right transverse sinus, had a suspected persistent thrombosis on PCMRV. However, that segment was normal on both CEMRV and SMRV. There was also a case of a meningioma that had a feeding artery that mimicked a draining vein on conventional MRV (Fig. 5), but this structure was not seen on SMRV. After the review of dynamic TRMRA images, this vascular structure was confirmed to be a feeding artery to the meningioma and not a draining vein.
DISCUSSION
Our results suggested the feasibility of SMRV for visualizing venous structures in the head and neck area. SMRV was acquired from post-processing TRMRA, which had the clinical utility to evaluate the intracranial venous system (46717). SMRV showed vein-only images in almost all cases, which was not achieved in the other MRV techniques. The image quality of SMRV was comparable with that of other standard MRV methods used for visualizing intracranial venous structures. Assessment of major venous structures was possible with SMRV and was similar to current standard MRV methods.
One of the main benefits of SMRV is acquisition time. It is a post-processing result of TRMRA, and there is no need for additional imaging. Compared with other standard MRVs, TRMRA has a considerably short acquisition time (1 minute in our cases). In addition, TRMRA and SMRV were relatively insensitive to timing after bolus injection of contrast media. If the acquired CEMRV image is suboptimal because of timing or bolus problems (Fig. 4), it is difficult to re-acquire a CEMRV immediately. In contrast, SMRV with acceptable image quality could be obtained from post-processing TRMRA by selecting optimal A and B phases. Moreover, as with the protocol used in this study, SMRV could be successfully acquired from TRMRA with low-dose contrast media.
Previous reports discussed the clinical potential of TRMRA for assessing intracranial venous structures (56717). However, those studies did not address arterial contamination, which could hamper visualization of the venous structures. Arterial contamination cannot be avoided on venous phase images of currently available TRMRA methods. A major factor that contributes to this limitation is a longer temporal footprint to update time (12). Removing the arterial signal is beneficial for detailed assessment not only of venous structures, which are usually parallel to arteries, but also of unexpected arterial structures that mimic veins (Fig. 5). From this perspective, the SMRV has potential clinical benefit; it removed arterial structures successfully in nearly all cases (20/21), and the results were better than current standard MRV methods and TRMRA itself. Current MRV methods employ different strategies to suppress arterial signal; CEMRV uses imaging timing, and PCMRV uses optimal VENC settings and application of a saturation band (1318). Despite these methods, our results suggested that CEMRV and PCMRV still have suboptimal removal of arterial signal. Although a certain degree of arterial contamination was accepted in the clinical setting, better removal of arterial structures was needed for venous system evaluation.
Subtraction of two sets of images helped in visualizing subtle enhancement or interval changes (19202122). This benefit of subtraction was commonly used for image processing in radiology. One of the major applications was angiographic images, including digital subtraction angiography (23). The basic concept underlying SMRV stemmed from this idea. Although SMRV had lower spatial resolution than other MRV methods, the image quality and ease of vein visualization were similar to or better than currently standard MRV techniques. Moreover, subtle structures were visualized more clearly, such as the cavernous sinus and inferior petrosal sinus and the internal cerebral vein and straight sinus, which are not usually visualized on PCMRV. In addition, SMRV improved visualization of narrowed venous structures with slow flow. From this point of view, SMRV had sufficient contrast between venous structures and background, although it has inferior spatial resolution to that of current standard MRVs.
The subtraction process should remove only unwanted arterial signals, and targeted structures should remain untouched. For this purpose, choosing the two most appropriate phases is crucial. Generally, there was substantial visualization of venous structures on the arterial peak phase image. To avoid loss of venous structure signal throughout the subtraction process, we chose a phase with minimal venous signal (phase A) rather than arterial peak signal. Although the signal of the arterial structures was not at its peak, it was still substantial and sufficient to enable removing the arterial signal in phase B. As a result, the dural sinus score and cortical vein score of SMRV were better than those of PCMRV, and the dural sinus score of SMRV was comparable with that of CEMRV. Arterial signal was noted in only one case with arterial contamination on SMRV caused by subtle visualization of both vertebral arteries. The internal carotid arteries were not visualized, likely owing to the difference in flow velocity between the vertebral and internal carotid arteries (2425). However, the common and internal carotid arteries were out of the field of view of the standard MRV methods.
Time-resolved contrast-enhanced MR angiography could provide anatomical and hemodynamic information simultaneously (4101112). However, it is not easy to achieve high temporal and spatial resolution simultaneously. In our institution, because hemodynamic information could be only obtained by TRMRA, TRMRA was acquired with high temporal resolution at the expense of spatial resolution. As a result, TRMRA in this study has lower spatial resolution than CEMRV. Different spatial resolution could be a reason for the inferior image quality and venous structure visualization of SMRV compared with CEMRV, which had better spatial resolution than TRMRA and SMRV. Future MRA with higher acceleration with higher parallel factors or compressed sensing might improve spatial resolution of TRMRA (2627).
Interestingly, SMRV enabled visualizing the venous drainage route of the head and neck in addition to intracranial venous structures. Because our TRMRA had supra-aortic fields of view, and the acquired SMRV images visualized supra-aortic venous structures. Imaging the venous structure of the neck area is challenging because of inter-individual variation and intra-individual physiologic changes (28293031). A few reports suggested the value of TRMRA for evaluating head and neck venous structures, especially in patients with multiple sclerosis (589). However, without sufficient arterial suppression, it is difficult to differentiate between neck veins and arteries. For this purpose, SMRV could be helpful as an imaging tool for veins in the neck area as well as for intracranial veins.
There are a number of limitations to our study. First, the study's retrospective design might have introduced unpredictable biases. Included patients were heterogeneous in terms of clinical indications for MRV and its findings. However, this suggested the clinical utility of SMRV with various clinical indications. In addition, we could not compare the SMRV with TOF MRV, another commonly used MRV method. Because of limited MR examination time, TOF MRV was not included in the routine MRV protocol in our hospital. Future study to compare SMRV with TOF MRV is needed. No patient underwent confirmative catheter venography. That invasive procedure is not routinely performed in our institution, and no patient was referred for catheter venography by clinicians. We did not compare SMRV and the venous phase of TRMRA. However, as mentioned earlier, SMRV is a post-processing result of TRMRA data, not a competitor. Although SMRV was suggested as a stand-alone MRV in our study, if applied in clinical practice, it could also serve as an additional and complementary image set to TRMRA images for venous system assessment; this is why we compared the SMRV with other standard MRV methods and not TRMRA. Although we presented a new SMRV for visualizing intracranial and neck area venous structures, further study regarding the diagnostic accuracy of SMRV for diseases involving intracranial and neck veins is needed.
In conclusion, SMRV is a practical method for visualizing venous structures obtained from TRMRA, without additional acquisition of specialized venography sequence. The image quality of SMRV is acceptable for clinical utility and comparable with that of other clinically used MRV methods. SMRV removed arterial contamination successfully in almost all cases.


 XML Download