

 PDF
PDF ePub
ePub Citation
 Print
Print


INTRODUCTION
Shoulder computed tomography (CT) arthrography is typically performed for patients who are obese or severely claustrophobic, for patients with a magnetic resonance imaging (MRI)-incompatible implanted medical device, and for patients with metal hardware in close proximity to the shoulder joint after surgery (1, 2). CT arthrography is advantageous because it requires only 1 minute of scanning time. In contrast, magnetic resonance (MR) arthrography requires more than 10 minutes to acquire three planes of T1-weighted images and coronal T2-weighted images (3, 4, 5, 6). Currently, the accuracy and diagnostic performance of shoulder CT arthrography are lower than MR arthrography (2, 7). However, a reduction in artifacts and an increase in the signal-to-noise ratio would be beneficial to improve the performance of shoulder CT arthrography.
Dual-energy CT (DECT) is a recently introduced technology useful for reducing artifacts and separating materials (8, 9, 10). There are three types of DECT scanners according to the technique used to acquire high and low energy CT datasets: a dual source dual-energy scanner (Dual Source; Siemens Medical Solutions, Erlangen, Germany), a single-source dual-energy scanner with fast kVp switching (Gemstone Spectral Imaging; GE Healthcare, Milwaukee, WI, USA), and a single-source dual-energy scanner with dual detector layers (Brilliance CT; Philips Healthcare, Andover, MA, USA) (2, 11). In the monochromatic spectral imaging mode of the single-source dual-energy scanner, the X-ray energy switches rapidly within a fraction of a millisecond between high and low kVp in adjacent projections during data acquisition (12). Based on these two data sets, virtual monochromatic spectral (VMS) images and material decomposition (MD) images are produced. MD images are produced by calculating the amount of each material pair that can be separated according to their characteristic mass attenuation coefficients irrespective of their CT numbers. This can provide better detection of bony lesions by separating bone and contrast medium (10). The beam-hardening artifacts are typically caused by the polychromaticity of the X-ray spectrum. Therefore, the monochromatic images obtained orgwith VMS imaging can reduce beam hardening artifacts caused by dense materials like cortical bone, injected contrast medium, and implanted metal hardware.
In this study, we determined the optimal dose of iodine contrast agent and the optimal level of monochromatic energy for the VMS imaging mode of shoulder DECT arthrography. The performance was evaluated in terms of reduction of image noise and beam-hardening artifacts, and bone-iodine differentiation. We then evaluated the optimized protocol in patients.
MATERIALS AND METHODS
Phantom
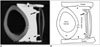
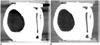
Our shoulder phantom was comprised of bovine tail bone, rib bone, tail tendon, and agarose gel to simulate the humeral head, glenoid, rotator cuff, and labrum, respectively (Fig. 1). Two bovine tail tendons were placed parallel to each other, and bovine tail and rib bones were placed at each side of tendons. The phantom was completed by filling the 6% agarose gel in the acrylic box. After the gel solidified, the gel between the bones and tendons was removed to make a space for the contrast agent. Grooves were made using a carving knife in the middle of articular sides of tendons and bones to simulate injuries. Then, the joint space was filled with diluted iodinated contrast medium by using a 20 mL plastic syringe before CT scanning.
CT Imaging
CT examinations were performed with a Discovery CT750 HD 64-channel, dual-energy scanner (GE Healthcare, Milwaukee, WI, USA). The phantom was scanned in the monochromatic spectral imaging mode and conventional polychromatic mode at 120 kVp. Patients were scanned using only the monochromatic spectral imaging mode. Both scanning modes used the same helical scan protocol: gantry rotation speed, 0.8 second per rotation; detector collimation, 0.625 mm; beam collimation, 40 mm; helical pitch, 0.984. The volume CT dose index was 18.11 mGy for the conventional mode and 17.3 mGy for monochromatic spectral imaging mode. The reconstruction slice thickness was 0.625 mm using a standard reconstruction algorithm. The shoulder phantom was placed on the right side of a dummy torso (Breast Massage Model Type II, LM-024; KOKEN, Tokyo, Japan) during CT scanning. Diluted iodinated contrast medium (iodine 300 mg/mL, Omnipaque 300; GE Healthcare, Cork, Ireland) at nine different concentrations (30, 60, 90, 120, 150, 165, 180, 195, and 210 mg iodine per mL of saline) were tested. Saline was used as the reference to eliminate the effects of possible beam hardening artifacts caused by the contrast medium.
Image Noise and Optimal Monochromatic Energy Level
All acquired images were transferred to an Advantage Workstation and were analyzed by the GSI Viewer 2.00 and GE VolumeShare 4 AW 4.4 software packages (GE Healthcare, Milwaukee, WI, USA). Image noise was defined as the standard deviation (SD) of the CT number, and was measured by 20 regions of interest (ROIs) that were randomly selected for statistical analysis. Eleven VMS images were produced from monochromatic spectral imaging mode scanning. Images were post-processed at 1 keV intervals from 67 to 77 keV. The range of energy was adopted from the results of previous reports (13, 14, 15). Image noise was measured at the articular space, the upper tendon, and the cortical bone.
Image Contrast
Image contrast was defined as the difference in the CT number (Hounsfield unit, HU) between two materials. The CT numbers were obtained from the ROIs drawn at the diluted contrast media in the articular space, soft tissue (tendon and simulated labrum), and bone. Image contrast was calculated from data obtained for 72-keV VMS and 120-kVp conventional imaging at 10 different iodine concentrations.
Beam Hardening Artifacts
Beam hardening artifacts were calculated with the following formula (15):

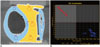
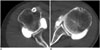
where N0 is the noise of an affected region and N1 is the noise of an unaffected background. Three rectangular ROIs were drawn on each of the axial, sagittal, and coronal multiplanar images of the phantom (Fig. 2).
Bone-Iodine Differentiation
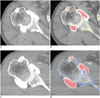
Bone-iodine differentiation was evaluated qualitatively for three types of images: MD images with a basis material pair of bone and iodine, VMS images without material decomposition, and conventional CT images (Fig. 3). Bone defects were independently evaluated as visible or not visible by three radiologists. When the evaluators disagreed, a majority opinion was used for the final decision.
Clinical Application of Monochromatic Spectral Imaging DECT Arthrography
The protocol optimized through the phantom study was prospectively applied to the protocol for patients. The Institutional Review Board approved the study, and we obtained written informed consent from all enrolled participants. In our institution, patients suspected of having internal derangement of the shoulder usually undergo shoulder MR arthrography. However, shoulder CT arthrography is suggested for 1) patients who have previously undergone shoulder surgery, 2) patients who have MR imaging claustrophobia, and 3) patients who refuse MRI for other causes such as financial concerns. From January 2011 to March 2012, a total of 33 consecutive patients underwent shoulder DECT arthrography. We excluded seven of these patients because they had orthopedic metallic devices near the shoulder joints, and metal artifact reduction was not within the scope of this study. We excluded three other patients due to failed intra-articular injection of contrast medium. Thus, 23 patients were included in the study group: 13 before protocol optimization (from January 2011 to August 2011; seven men and six women; mean age, 64 years) and 10 after protocol optimization (from September 2011 to March 2012; seven men and three women; mean age, 63 years). Before protocol optimization, 300 mg/mL of iodinated contrast medium (Omnipaque 300; GE Healthcare, Seoul, Korea) was used, and CT images were reconstructed for review with 65 keV monochromatic energy level. The clinical diagnoses of these patients were rotator cuff tear (n = 9), adhesive capsulitis (n = 4), and labral cyst (n = 1). The other patients had no specifically defined shoulder lesions. The volume CT dose index of shoulder DECT arthrography was 17.77 mGy for all 23 patients, which was almost the same as the volume CT dose index for the phantom study (17.3 mGy).
Image noise, beam hardening artifacts, and image contrast between the contrast medium and muscle were evaluated at the level of the glenoid and sternocleidomastoid muscle. Image noise was calculated by averaging the SD of CT numbers from the three 100-mm2 circular ROIs drawn at the air, contrast medium in the joint space, and the sternocleidomastoid muscle.
The beam hardening artifact was calculated with the aforementioned formula, where N1 was the SD of CT numbers from a ROI drawn at the sternocleidomastoid muscle and N0 was the mean SD of CT numbers from two ROIs drawn about 1 cm away from the articular space at the anterior belly of the deltoid and infraspinatus muscles.
Image contrast was obtained by subtracting the CT number of the infraspinatus muscle from that of the contrast medium in the articular space. The differentiation of the cortical bone from the iodine in the joint space was determined by MD imaging. The locations of bone defects on CT images were recorded.
Statistical Analyses
Paired t tests were used to compare image noise between the VMS and conventional CT images for three different materials (tendon, water, and bone). One-way repeated-measures analysis of variance (ANOVA) was used to compare the image noise of the VMS images at different monochromatic energy levels. One-way repeated-measures ANOVA and paired t tests were used to compare the beam hardening artifacts among different image sets, and Mann-Whitney tests were used to compare image noise and beam hardening artifacts before and after protocol optimization. The assumption of sphericity for repeated-measures ANOVA was assessed using Mauchly's test. Two-sided p values < 0.05 were considered statistically significant. The false discovery rate controlling method of Benjamini and Hochberg (16) was used to adjust p values for multiple testing. All statistical analyses were performed using PASW version 18.0 software (SPSS Inc., Chicago, IL, USA).
RESULTS
Image Noise and Optimal Monochromatic Energy Level in Shoulder Phantom
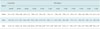
Image noise from the tendon, saline, and the bone on the VMS images of the shoulder phantom is summarized in Table 1. There were significant reductions of noise by VMS imaging between 67 keV and 73 keV for water, and between 69 keV and 77 keV for bone (p < 0.05). Maximum reduction was observed at 69 keV for water and at 75 keV for bone. For tendon, maximal noise reduction was seen at 72 keV, but statistical significance was not reached. At different monochromatic energy levels, there was no significant difference in image noise on the VMS images (p > 0.05 by one-way repeated-measures ANOVA). The energy value of 72 keV was selected to reduce the image noise for the following analyses because it was in the middle of 69 keV (optimal for water) and 75 keV (optimal for bone).
Image Contrast in Shoulder Phantom
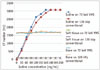
Figure 4 plots the CT numbers obtained from 72 keV VMS and 120 kVp conventional CT images of iodine contrast agent, soft tissue, and bone. For both VMS and conventional CT images, the CT number of the iodine contrast agent increased as the concentration of iodine increased until the maximum CT number (3071 HU) was reached. However, the CT numbers of soft tissue and bone were not significantly affected by the iodine concentration or type of protocol used (17.6 to 24.2 HU for soft tissue, and 1620.8-1720.4 HU for bone). At 60 mg/mL iodine concentration, the image contrast was over 1200 HU between iodine contrast agent and soft tissue (1381 for 72 keV VMS and 1235 for 120 kVP conventional images), and was around 300 HU between iodine contrast and bone (268 for 72 keV VMS and 360 for 120 kVP conventional images).
Beam Hardening Artifacts in Shoulder Phantom
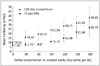
The lower iodine concentrations produced less beam-hardening artifacts. While for conventional CT images these decreases were statistically significant at all iodine concentrations (p < 0.05), for the VMS images these decreases in beam-hardening artifacts were only significant until the iodine concentration decreased down to 60 mg/mL (p < 0.05); there was no difference in beam hardening artifacts between 0, 30, and 60 mg/mL of iodine (p = 0.74 by ANOVA). VMS images produced less beam hardening artifacts than conventional CT images at any given iodine concentrations (p < 0.05) (Figs. 5, 6).
Bone-Iodine Differentiation by MD Imaging in Shoulder Phantom
Material decomposition images with a basis material pair of iodine and bone successfully revealed the bone defects regardless of concentrations of contrast medium (Table 2). However, with conventional CT images and 72 keV VMS images at 60 and 90 mg/mL iodine concentrations, bone defects could not be clearly qualitatively identified by adjusting the window level and the window width. There was no disagreement among the readers in any case.
Clinical Evaluation of DECT Arthrography
The image noise and the beam hardening artifacts were reduced by 35.9% (27.01 to 17.3) and 44.5% (25.42 to 14.5), respectively, by changing the monochromatic energy level from 65 keV to 72 keV and using a concentration of 60 mg/mL iodine contrast agent instead of 300 mg/mL (Table 3, Fig. 7). Table 3 summarizes the protocol, calculated values (image contrast, noise, and beam hardening artifact) from VMS imaging, and the bone-iodine differentiation by MD imaging before and after protocol optimization. Image contrast above 800 HU between the iodinated contrast medium and adjacent soft tissue was acquired with 60 mg iodine/mL. The differentiation of bone and iodine was successfully achieved by MD imaging regardless of the protocol used (Fig. 8). No patient with a bony defect was found in our study population.
DISCUSSION
The results of this study demonstrate the advantages of the VMS imaging of DECT over conventional CT for shoulder arthrography. First, image noise can be reduced with VMS imaging at the proper monochromatic energy level with no increase in radiation dose. Second, beam hardening artifacts caused by the cortical bone and contrast media can also be reduced with VMS imaging. Third, 60 mg/mL of iodinated contrast medium produced enough image contrast for clinical evaluation. Finally, MD imaging can provide visual differentiation cortical bone and contrast agent even when they cannot be differentiated by image contrast.
The image noise of the VMS images varied in relation to the monochromatic energy level. The noise measured from 69-73 keV VMS images were lower than the noise from 120 kVp conventional CT images for water and bone. The noise measured for tendon was also lower with VMS imaging, although the differences were not statistically significant. This could be due to less homogeneous attenuation of tendon, which in turn results in wider SDs of noise measurements. Previous studies have used phantoms to demonstrate that the image quality of VMS images at a 65-72 keV monochromatic energy level is higher than that of 120 kVp conventional CT images in terms of image noise and the contrast-to-noise ratio (13, 14, 17).
Virtual monochromatic spectral imaging produces images with fewer beam hardening artifacts, which typically arise in reconstructed images due to X-ray polychromaticity. We demonstrated this theoretical effect through clinical evaluation and a phantom study. Our results are consistent with those of a recent study that reported the usefulness of VMS imaging in reducing beam-hardening artifacts in the posterior fossa on brain CT (15). Beam-hardening artifacts can also be reduced by lowering the iodine dose while maintaining the image contrast, and this resulted in improved image quality in our study. Undiluted (300 mg iodine/mL) iodinated contrast agent is usually used for shoulder CT arthrography to achieve high image contrast (18). As the iodine concentration of the contrast medium increases, the contrast between the contrast medium and soft tissues increases. This increase eventually provides no further benefit in terms of image contrast, while the beam-hardening artifacts continue to rise significantly. In addition, hyperosmolar iodinated solution can cause post-procedural swelling and pain (19). However, an iodine concentration that is too low may lead to insufficient tissue contrast due to in vivo dilution. Thus, in practice, it is recommended that at least 150 mg iodine/mL diluted contrast agent be used for conventional CT shoulder arthrography (19, 20). In the current study, the fewest beam-hardening artifacts were observed below 60 mg/mL iodine concentration for the 72-keV VMS images (Fig. 5). In addition, the CT number difference was more than 1000 HU in the phantom study (Fig. 4), and it was more than 800 HU in clinical evaluation (Table 3), between 60 mg/mL diluted contrast medium and soft tissue. Although we cannot conclude that 60 mg/mL is the optimal contrast dose for clinical use, the results demonstrated that the dose of iodinated contrast for better image quality with VMS imaging can be reduced.
It is clinically important to detect and evaluate bony defects that cause instability because bony defects have been identified as the primary cause of failed arthroscopic reconstruction, and the surgical approach should be modified in the presence of bony lesions (21, 22, 23). Although a 60 mg/mL concentration of iodine contrast agent was the optimal dose in our phantom study, iodine-bone differentiation is challenging due to iso-density image contrast at this iodine concentration. Although this study demonstrated that the iodine concentration does not affect the subjective diagnostic quality of the MD images, the usefulness of MD imaging for detecting a subtle bony defect could not be assessed because none of our study subjects had bone injury. We only confirmed that relatively thin cortical bone is clearly separated from intraarticular contrast media by using MD imaging. Further studies with large numbers of subjects may be required to determine the clinical values of MD imaging.
Compared to conventional CT arthrography, VMS imaging led to superior image quality in terms of sufficient tissue contrast, fewer beam hardening artifacts, and reduced image noise. The reduction of beam hardening artifacts may be useful for patients who undergo CT arthrography due to MR-incompatible metallic devices inside the body. This imaging technique can also be used for other joints. For example, it could be useful for wrist CT arthrography, which appears to be superior to MR imaging for detection of ligament tears (24, 25).
There are several limitations of this study. The protocol for the VMS imaging scan was optimized through a phantom study. Although the established protocol from the phantom study worked effectively in the clinical evaluation, caution is needed when generalizing our results obtained from comparing two small heterogeneous groups. Another limitation to this study was the optimal concentration of iodinated contrast media used. We used the lowest contrast dose of 60 mg iodine/mL, which produced the fewest beam-hardening artifacts while still allowing sufficient image contrast. Although we obtained satisfactory results in general with the optimized concentration, a few cases showed unsatisfactorily low tissue contrast in clinical evaluation, as evidenced by the large SD for image contrast. This may be attributed to factors including failed or inadequate injection, or dilution of the contrast agent due to preexisting joint effusion. Indeed, there were three cases of inadequate or failed injection in our study, which led to insufficient amounts of contrast media in the shoulder joints. Our results suggested a minimum effective dose of contrast agent for a clinical protocol. Further investigation of the optimal dose of contrast media using a guideline which has been established in this study may help to find an appropriate dose to compensate in vivo dilution.
In conclusion, VMS and MD imaging using DECT have benefits over 120 kVp conventional polychromatic CT shoulder arthrography, which include decreased image noise, reduced beam hardening artifacts, improved evaluation of small bony lesions, and reduction of dose of contrast agent. The protocol established using the phantom study, 72 keV monochromatic energy level and 60 mg/mL iodine concentration, was successfully applied to clinical evaluation.


 XML Download