

 PDF
PDF ePub
ePub Citation
 Print
Print


Juvenile myoclonic epilepsy (JME) is a syndrome of idiopathic generalized epilepsy (IGE) with an age-related seizure onset. The typical clinical features include a family history, myoclonic jerks and awakening generalized tonic-clonic seizures and less frequently these seizures are typically absent (1). The probable polygenic nature of JME has been repeatedly stressed, and the susceptibility genes have been located on chromosomes 6q21.3, 6p11 and 15q (2-5).
Compared to many other functional studies (6-12), structural MRI studies on JME have rarely been performed (13-15). This is due to the fact that JME is an epilepsy that responds very well to antiepileptic drug (AED) medication compared to the other subtypes of epilepsy, and the brain MRI of JME patients appears normal. Yet the advances in the last 10 years of the quantification methods like volumetric MRI with 1.5 millimeters (mm) thin thickness MRI have made it possible to measure the volume of 3 cc structures like the hippocampus with less than 2-3% error (16).
The structural changes seen on brain MRI imply the chronic state of disease relative to the functional change of glucose metabolism or regional blood flow. Even though some functional studies have reported on the abnormality of the frontal lobes (6-11), the anatomical substrate for the JME pathology is still unclear. Thus, more studies about the structural abnormalities of this disease are needed. When we reviewed the results of the JME functional studies, the presence of structural abnormalities was suspected, especially in the subcortical nuclei when considering the generalized ictal seizure (1, 6), the valproic acid (VPA) effect on the subcortical nuclei (17, 18), the presence of psychiatric disorders (11), and the basal ganglia-related circuitry (19). So, we measured the volumes of the frontal lobe and the hippocampus, and the area of corpus callosum, and we also performed optimized voxel-based morphometry (VBM) in JME patients and in the closely age- and gender-matched normal controls to investigate the structural abnormality in the JME brain.
MATERIALS AND METHODS
Subjects
We retrospectively selected 19 JME patients (mean age±standard deviation (SD) = 22.6±4.9 years, 6 men and 13 women) who were diagnosed according to the International League Against Epilepsy (ILAE) classification of epilepsy and epileptic syndrome (20). For these patients, the JME started around puberty and it showed the typical symptoms of bilateral or unilateral myoclonic jerks on the extremities with these being seen more on the arms without disturbance of consciousness. The myoclonic jerks sometimes progressed into generalized tonic-clonic seizures. The patients' neurological examinations were normal, and the electroencephalograms (EEGs) showed generalized spikes, spike-waves or polyspikes with normal alpha rhythms. Only the JME patients who had normal brain MRIs and who showed good response to valproic acid were included in this study. Ten patients were right-handed and the handedness of the remaining patients was not identified. The clinical features of the patients are described in Table 1.
We recruited 19 closely age- and gender-matched normal controls (mean age±SD = 22.9±7.3 years, 6 men and 13 women) who had no familial and personal history of neurological or psychiatric diseases, and no head trauma. All the normal subjects were right handed as accessed by the Edinburgh Handedness Inventory (EHI). There were no structural or signal abnormalities on the Spoiled Gradient that was recalled on the steady state (SPGR), T2-weighted and Fluid Attenuated Inversion Recovery (FLAIR) MRIs.
MRI Acquisition
MRI scanning was performed with a GE Signa 1.5 Tesla scanner (GE Medical System, Milwaukee, WI). All the subjects underwent the SPGR, T2-weighted and FLAIR imaging protocols. The coronal SPGR MRIs were obtained with scanning variables of a 1.6-millimeters (mm) thickness, no gap, 124 slices, a repetition time/echo time (TR/TE) = 30/7 milliseconds (msec), a flip angle (FA) = 45 degrees (°), 1 for the number of excitations (NEX), a matrix = 256×192 and a field of view (FOV) = 22×22 centimeters (cm). The voxel dimension of the SPGR MRI was 0.86×0.86×1.6 mm. The oblique coronal FLAIR MRI was scanned with a 4.0 mm thickness, a 1.0 mm gap, 32 slices, a TR/TE = 10,002/127.5 msec, 1 NEX, a matrix = 256×192 and a FOV = 20×20 cm. The oblique coronal T2-weighted MRI was obtained with a thickness of 3.0 mm, a 0.3 mm gap, 56 slices, a TR/TE = 5,300/99 msec, a FA = 90°, 3 NEX, a matrix = 256×192 and a FOV = 20×20 cm. All the MRIs of the JME patients and the controls were reviewed by a neuroradiologist and they were reported as being normal.
MRI Volumetry
1. Neuroanatomical Landmarks for Measurements
1) Cerebrum and corpus callosum
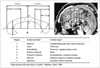
The cerebrum was delineated by the border between the CSF and the gray matter. The cerebellum and pons were excluded. The boundary of the midsagittal cerebral area (CA) was outlined at the level of the outermost part of the dura matter with excluding the cerebellum and corpus callosum. The exact midsagittal area of the corpus callosum was manually traced and then divided into seven subregions according to Witelson's criteria (Fig. 1) (21).
2) Hippocampus
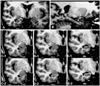
The entire hippocampus was measured from the most anterior head to the posterior tail, including the cornu ammonis, gyrus dentatus, hippocampus, alveus and subiculum (19, 22). The most anterior boundary was identified as being the alveus and the three simultaneous dimensional position markings on the coronal and sagittal views (Fig. 2). The most posterior hippocampus was measured to the end of the tail of the hippocampus.
3) Frontal lobe
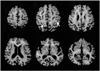
The anatomical landmarks for the anterior boundaries of the frontal lobe were the frontal pole and the superior pole of the frontal lobe for the anterior-superior boundary, and the orbito-frontal lobe and subcentral gyrus for the inferior-anterior boundary. The hand knob in the precentral gyrus was found to identify the central sulcus on the reconstructed axial SPGR MRI (23). The central sulcus was used as a landmark to separate the frontal lobe from the parietal lobe (Fig. 3). The other detailed boundary criteria of the frontal lobe were applied from Aylward EH's work (24).
2. Quantitative Analysis
Preprocessing of the SPGR MRI and the volume measurements were performed using a Sun Ultra 1 Creator workstation (Sun Microsystems, CA) and Analyze 7.5 (Biomedical Imaging Resource, Mayo Foundation, Rochester, MN). The midsagittal cerebral and corpus callosum areas were measured with using a Pentium III 500Mhz computer and Scion image 4.0.2, and the windows version of the NIH image (the U.S. National Institute of Health). For measurement of the frontal lobe volume, all the images' cerebrums were segmented with a semi-automated region growth method and a manual editing method. The segmented coronal SPGR MR images were rescaled from the anisotropic voxel dimension of 0.86 (x axis)×0.86 (y axis)×1.60 (z axis) mm to the isotropic voxel dimension of 0.86×0.86×0.86 mm.
1) Cerebrum
The cerebrum was segmented with a semiautomated method with using the pixel intensity based on region growth and manual tracing. The border intensity between the gray matter and the CSF was determined by the mean of the maximum gray matter intensity value and the minimum CSF intensity value. Non-cerebral structures that were connected to the cerebrum were excluded by manual deletion. The non-cerebral structures' intensity values were set to zero. Thereafter, the non-zero intensity voxels were automatically counted. The cerebral volume was calculated by multiplying the total voxel counts by the voxel volume (25).
2) Corpus callosum
To acquire the exact midsagittal MR image, the rescaled SPGR MRI was translated and rotated to the X, Y and Z axes at the level of the interhemispheric fissure and the septum pellucidum. The reconstructed sagittal images were rotated parallel with the anterior commissure-posterior commissure line. This process is important for obtaining an anatomically consistent image. An inconstant midsagittal image could produce variable results during the area measurement due to the variations of the corpus callosums' shapes (Fig. 1A). The exact midsagittal MR images were two dimensionally snapped and then saved in the Tag Image File Format (TIFF). The snapped images were transferred to a PC workstation (Pentium-III, Windows 2000) with using a file transfer protocol of the physical network. The midsagittal MR images were loaded onto the Scion image and then magnified 3 times to reduce the manual tracing errors. The contour of the corpus callosum was manually traced according to the anatomical boundary criteria. To keep the measurement consistent, the investigator drew a tracing line on the mean intensity valued voxels between the corpus callosum and the CSF. The subregions of the corpus callosum were automatically determined by the programmed macro function of Witelson's criteria. Once the investigator drew vertical lines at the most anterior margin of the corpus callosum (ACC) and the most posterior margin of the corpus callosum (PCC), one half line, two one-third lines and one one-fifth line from the PCC were vertically drawn automatically. The voxel numbers of the seven subregions were automatically counted and each area was calculated by multiplying the voxel number by a voxel area. The tracing line was excluded in the calculated area.
3) Hippocampus
To reduce manual tracing errors, the SPGR MRI was magnified by four times and then interpolated (16). The entire hippocampus was measured from the most anterior head to the posterior tail. The investigator pointed out the suspicious boundary pixels from the coronal view, and the function of the orthogonal view displays the same positioned pixel of the sagittal view. On the sagittal MRI, the hippocampus could be easily differentiated from the amygdala (Fig. 2). According to the previously defined hippocampus boundary criteria, the rater manually outlined the hippocampus on the alveus with a track ball mouse.
4) Frontal lobe
The rescaled and segmented SPRG MRI was reconstructed to the axial image with the final image dimension of 0.86 (x)×1.6 (y)×0.86 (z) mm, and then this was magnified two times and interpolated to reduce the tracing errors. After the central sulcus was identified by the hand knob according to the boundary criteria, the frontal lobe was segmented and the pixel value of the extra-frontal lobe was set to zero. Then the total non-zero voxels were counted and the frontal lobe volume was calculated.
All the MRI data of the JME patients and controls were mixed in the same directory without referring to any clinical information before the measurement. The volumes of the hippocampus, frontal lobe and cerebrum were expressed in cm3 units, and the area of the corpus callosum was expressed in mm2 units.
3. Intra-rater Reliability
An experienced investigator (W.S.T.) performed the measurement twice (one week apart) in 19 controls in a "blinded" fashion. The intraclass correlation coefficients (ICC) of measurements were then calculated. The ICCs were 0.988 for the right hippocampus, 0.967 for the left hippocampus, 0.925 for the frontal lobe, 0.992 for the cerebrum, 0.853 for the rostrum (a1); 0.970 for the genu (a2); 0.935 for the rostral body (a3); 0.907 for the anterior midbody (a4); 0.882 for the posterior midbody (a5); 0.847 for the isthmus (a6); 0.924 for the splenium (a7); and 0.955 for the entire corpus callosum (aT).
4. Area and Volume Normalization
The areas of the entire corpus callosum (aT) and the subregions (a1~a7), and the volumes of the hippocampus and frontal lobe were normalized by dividing them with each subject's cerebral volume (CV) and then the normalized areas of a1~a7 and aT were renamed to N_a1~N_a7 and N_aT, respectively. The normalization formula was (Individual volume or area/CV)×1,000,000. To solve the possible problem that could be caused by simple ratio normalization (26), the analysis of covariance (ANCOVA) was performed with age and CV as the covariates.
5. Statistical Analysis
Statistical analysis was performed with SPSS 10.0 (SPSS Inc., Chicago, IL). The normality of the distribution was tested using the Kolmogorov-Smirnov test and a normal plot test. Pearson's correlation coefficients were calculated between the volumes of the structures and the clinical information, and Spearman's correlation was used when the data was not in normal distribution. Gender differences between the groups were tested by the Chi square test. Student's t-test was used to test the differences between group means, and paired t-tests were used to test the right-left asymmetry. Because age and CV are well known as the main factors that influence the size of the corpus callosum (27), ANCOVA was performed with adjustments for age and CV. All the tests were two tailed, and the level of significance was p < 0.05.
Voxel-Based Morphometry
With using SPM2 (Wellcome Department of Cognitive Neurology, Institute of Neurology, University College London, UK) and MATLAB 6.5 (The MathWorks, MA), the optimized VBM protocol (28) was used for the analysis of the brain tissue concentration and the regional volume changes. All the coronal SPGR MRIs (n = 38 scans) were reformatted to 1×1×1 mm axial images with using Analyze 7.5, and the center point was placed on the anterior commissure.
1. Creating Template and Priors
To create the customized templates and the prior images of the gray mater and white matter, all the MRIs of the JME patients and the normal controls were spatially normalized to a standard T1 template of the SPM (stastical parametric mapping). Spatial normalizations were applied with the parameters of voxel size: 1×1×1 mm, cutoff spatial normalization: 25 mm cutoff, nonlinear regularization: medium regularization and 16 nonlinear iterations. The normalized images were segmented into the gray matter and white matter, and they were sub-sampled into the voxel size of 2×2×2 mm. The spatially normalized raw images of the segmented gray matter and white matter were averaged and they were then were saved into the customized T1 template of the gray and white matter prior images, respectively. Finally, the customized T1 templates of the gray and white matter prior images were smoothed with an 8-mm full-width at half-maximum (FWHM) isotropic Gaussian kernel.
2. Optimized Voxel-Based Morphometry
The raw T1 images of all the subjects (n = 38) were automatically segmented into gray matter, white matter and CSF partitions in native space, and then the volumes of the gray and white matter images were calculated. The spatial normalization parameters were estimated by matching the gray matter with our own gray matter template, and then spatially normalized versions of the original images were created. The spatially normalized images were segmented using our own prior images (gray matter, white matter and CSF partitions). All the spatially normalized images, the segmented gray images and the white matter images were modulated for the analysis of regional volume change. The modulated and unmodulated images were smoothed using a 12-mm FWHM isotropic Gaussian kernel. The final voxel size was 1×1×1 mm.
3. Statistical Analysis
A one way analysis of varience (ANOVA) model (with a constant) was applied for the concentration analysis of the unmodulated gray and white matter images. For the regional volume change analysis with using the modulated images, we used both the ANCOVA model with the covariate of the gray matter volume and the one way ANOVA model (with a constant) without a covariate.
To correct for multiple comparisons, the results were corrected with a false discovery rate (FDR) correction at a height threshold of a p < 0.05 (T = 4.34) level, and the voxel clusters were corrected with an extent threshold of k > 100 voxels. The coordinates were represented in the Talairach coordinate system.
RESULTS
The patient characteristics are summarized in Table 1. There was no statistical significance in the comparison of the cerebral volume between the JME and normal control groups (Table 2).
Volumetry
The rostrum (a1, N_a1) of the JME group was significantly smaller than that of the control group (p < 0.0001) while the left frontal volume of the JME group was significantly larger than that of the control group (p = 0.004). The rostral body (a3, N_a3) and the left hippocampus of the JME group appeared smaller, but this had no statistical significance (0.05 < p < 0.08).
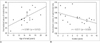
On ANCOVA testing, the rostrum (a1, adjusted R2 = 0.443), the rostral body (a3, adjusted R2 = 0.158), and the left hippocampus (adjusted R2 = 0.170) were significantly smaller in the JME patients, whereas the left frontal lobe (adjusted R2 = 0.529) was significantly larger in the JME patients. In the controls, there was no asymmetry in the hippocampal volumes (p = 0.163). However, the left hippocampus was significantly smaller than the right hippocampus (p = 0.016) in the JME patients. The rostral body area (N_a3) was positively correlated with the age of seizure onset, and the right frontal lobe volume was negatively correlated with the duration of the epilepsy history (Fig. 4). The other structures did not show any significant correlation with the age of onset or the duration of the epilepsy history.
Voxel-Based Morphometry
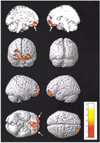
On the analysis of the unmodulated gray matter image, the gray matter concentration (GMC) was decreased in the bilateral gyri rectus (right: x, y, z = 5, 28, -25, z = 4.61, corrected p = 0.032; left: x, y, z = -9, 39, -22, z = 4.07, corrected p = 0.040), anterior orbital gyri (right: x, y, z = 14, 62, -20, z = 4.56, corrected p = 0.042; left: x, y, z = -21, 51, -14, z = 4.33, corrected p = 0.034), left middle frontal gyrus (x, y, z = -37, 52, -10, z = 5.02, corrected p = 0.032), and the right superior frontal gyrus (x, y, z = 29, 57, -5, z = 5.00, corrected p = 0.032) in the JME group (Fig. 5). But no brain regions showed an increased gray matter concentration.
On three different analyses of the modulated gray matter image (1. ANOVA without covariates, 2. ANCOVA with covariates of the gray matter volume, 3. ANCOVA with covariates of the gray and white matter volumes), no brain regions showed a significant change in the gray matter concentration in the JME patients.
No significant finding was found on the analysis of the unmodulated or modulated white matter images.
DISCUSSION
THE ATROPHY of CORPUS CALLOSUM
The corpus callosum is a major interhemispheric connection pathway. On in vitro study, the anatomical relation was revealed between each subregion of the corpus callosum and the regional cerebral cortex (21). The number of neurons is positively correlated with axonal generation. The regional degeneration or the pathological abnormality of the cerebral cortex may cause the atrophy of the corresponding corpus callosum subregions (29-32).
In our study, the rostrum and rostral body of the JME patients were atrophic compared to the controls. These results may be associated with the significant disease duration-related rCBF hypoperfusion observed in the caudal and orbital prefrontal cortex (corresponding to the rostrum) and the premotor, supplementary motor area (corresponding to the rostral body) of the frontal lobe (Tae WS, unpublished data). The positive correlation between the age of seizure onset and the rostral body area indicates the possible developmental abnormality in the frontal lobe (1). The dystopic neurons in the frontal lobe of the JME (14) or the recurrent seizures could be the cause of the abnormal development or the axonal damage, which may explain the decreased area of the anterior corpus callosum in our study.
THE ABNORMAL VOLUME of the FRONTAL LOBE
An increased gray matter concentration was reported in the superior frontal gyrus of JME patients, and the researchers suggested that the finding of an increased gray mater concentration could reflect microdysgenesis (14, 15). The relatively large volume of the frontal lobe in our study could be explained by microdysgenesis of the frontal lobe. On the other hand, the negative correlation between the normalized volume of the right frontal lobe and the duration of disease suggests the progressive damage of the right frontal lobe in JME patients (Fig. 4B).
The characteristic ictal EEG pattern in JME patients is one of bilateral symmetric polyspike-wave complexes with frontocentral accentuation (1). A previous study using the dipole source localization with polyspike and wave complexes (PSWC) in JME patients has reported the dipoles of the polyspike component are located in the medial frontal gyrus, the orbito-frontal region and the medial parieto-occipital region (6). Slow component analysis of PSWCs showed a dipole on a large zone of the medial frontal gyrus, the para-central lobule and the left temporal lobe in all patients. The researchers suggested that the medial prefrontal regions contain hyperexcitable neurons because generalized spike waves and PSWCs signal a short excitation period in neurons. In contrast, they implied that slow wave current sources are sparse in many cortical regions, and this reflects a more diffuse inhibitory process.
On MR spectroscopy study, a significantly reduced concentration of N-acetyl aspartate (NAA) was observed in the medial prefrontal lobe. This finding suggests the possibilities of general neuronal dysfunctions such as mitochondrial dysfunction, neuronal lesion leading to the release of N-acetyl-L-aspartate aminohydrolase and the degradation of NAA, or neuronal loss (7).
[11C]flumazenil (FMZ) positron emission tomography (PET) studies in patients with ten IGEs, including five JME patients, demonstrated a significantly higher mean [11C]FMZ volume of distribution (FMZVD) in the cerebral cortex, but the thalamus of JME patients did not show this FMZVD difference. They suggested that the finding of an increased FMZVD could reflect microdysgenesis or a state of cortical hyperexcitability (9).
The frontal lobe dysfunction in JME patients has also been reported on in a structuralized neuropsychological study. The researchers suggested that frontal lobe dysfunction may have maladaptive behavioral consequences that are suggestive of personality dysfunction (8). The evaluation study of psychiatric disorder using the DSM IV revealed psychiatric disorders in 45 out of 170 JME patients (11). Personality disorder (24 cases), including borderline personality (11 cases) was the most common, and generalized anxiety disorder (6 cases), dependent personality (5 cases), psychotic disorder (5 cases), and depressive disorder (3 cases) were reported.
THE ATROPHY of HIPPOCAMPUS
A serotonin 1A receptor PET study recently reported on the reductions of serotonin 1A receptor binding potential in the raphe nucleus of the pons, hippocampus and dorsolateral prefrontal cortex of JME patients, and the researchers suggested there is an affected serotonin system in JME patients (33). The interictal SPECT analysis of drug naive JME patients revealed the decreased cerebral blood flow in the areas of the left hippocampus, thalamus and brain stem (unpublished data). These findings were concordant with the finding of an atrophic left hippocampus in this study.
THE DECREASED GRAY MATTER CONCENTRATION of the PREFRONTAL LOBE
The decreased gray matter concentration was shown in the prefrontal area in this study (Fig. 5), but this finding is different from the previous reports of increased GMC in the superior frontal gyrus (14, 15).
When we consider that the rostrum of the corpus callosum is the pathway of the orbital prefrontal area (21), the decreased GMC of the bilateral gyri rectus and the anterior orbital gyri is consistent with the finding of atrophy of the rostrum in our study.
The pathophysiology of the decreased gray matter concentration in the JME patients' prefrontal lobe is still unclear. But the personality dysfunction (8) and psychiatric disorders (11) that are noted in JME patients may support the notion of prefrontal lobe abnormality. The volume reductions in the gray matter of the gyrus rectus and the orbitofrontal lobe were reported in elderly depressed patients (34).
The decreased GMC in the prefrontal area on the unmodulated gray matter image indicates a relatively low neuronal concentration in the JME group compared to the normal controls, whereas the dearth of significant findings on the analysis of the modulated images suggests the lack of regional brain volume change (28). However, discordance between manual volumetry and VBM was reported (35, 36). Although manual volumetry has a difficultly to define small structures, it is time consuming and it may pose its own problems in terms of reliability, manual volumetry still remains the "gold standard" for conducting a study of regional brain volume changes (35).
In summary, volumetry study of the brain MRIs in JME patients showed structural brain abnormalities, i.e., a smaller left hippocampus, a larger frontal lobe volume and atrophy of the rostrum and rostral body of the corpus callosum, and the VBM revealed a decreased gray matter concentration in the prefrontal region. These structural abnormalities in our study seem to be the first such findings in JME patients.
 XML Download