

 PDF
PDF ePub
ePub Citation
 Print
Print


INTRODUCTION
Cardiovascular disease (CVD) is the leading cause of death worldwide; it is responsible for more than 30% of the global mortality (1). Therefore, many efforts in multiple research institutions and countries are being made to analyze the risk factors and to prevent CVD. Risk assessment with established CVD risk factors, such as the Framingham risk score, does not fully explain the development of the disease; therefore, other methods or biomarkers have been proposed to assess the incremental prognostic value (234). The prognostic value of the coronary artery calcium score (CACS), coronary computed tomography angiography (CCTA) findings, or representative indices for systemic atherosclerosis (e.g., ankle-brachial index [ABI] and carotid intima-media thickness [CIMT]) have been demonstrated in previous studies (567). In particular, several recent studies have reported the prognostic value of CCTA and described its usefulness in characterizing atherosclerotic plaques of the coronary artery and evaluating their anatomic location (89101112).
In November 2013, the American College of Cardiology/American Heart Association (ACC/AHA) proposed a new guideline for the management of blood cholesterol and statin therapy (13). This guideline stratified statin therapy candidates based on the 10-year atherosclerotic cardiovascular disease (ASCVD) risk, which can be calculated with conventional risk factors without considering other reported atherosclerosis indices such as CCTA findings, CIMT, or biomarker status. However, there have been concerns regarding the substantially increased number of patients eligible for statin therapy based on this guideline (14).
Thus, the aims of this study are (1) to analyze the cardiovascular outcomes of statin medication in individuals retrospectively categorized on the basis of the 2013 ACC/AHA guideline risk assessment and (2) to determine the additional prognostic value of CCTA in assessing CVD risk for further stratification in statin therapy.
MATERIALS AND METHODS
Study Population
The Institutional Review Board approved the study protocol, and all of the patients gave written informed consent for coronary artery disease (CAD) evaluation using CCTA.
The study population was obtained from a registry of 5142 subjects who had undergone CCTA for health screening between January 2006 and December 2007 at a metropolitan tertiary hospital. Among these, we excluded individuals with 1) a previous history of coronary artery intervention, 2) clinical ASCVD, 3) malignancy, 4) inadequate medical records, 5) statin prescription at the point of the CCTA scan, and 6) coronary intervention within 90 days after CCTA that was considered as a CCTA-derived percutaneous coronary intervention. A total of 4255 patients were enrolled in this study.
Risk Assessment and Recommendation Groups
Basic demographic data, including information regarding age, sex, and body mass index were acquired from medical charts. Medical history of myocardial infarction, angina, hypertension, stroke, and diabetes mellitus, family history of premature CAD (male first-degree relatives < 55 years and female first-degree relatives < 65 years), current medication profile, and smoking status were systematically acquired through personal interviews.
A total of 4255 individuals were retrospectively classified into two groups according to the 2013 ACC/AHA guideline: the statin-recommended (SR) group included patients who were eligible for statin therapy for primary prevention, and the statin not recommended (SNR) group included individuals who did not require statin therapy. Since the guideline stratified statin therapy intensity on the basis of risk assessment, the SR group was categorized on the basis of the risk stratification guideline: 1) those with a low-density lipoprotein cholesterol (LDL-C) level > 190 mg/dL, 2) those aged between 40 and 75 years with type II diabetes, and 3) those with a 10-year risk of ASCVD > 7.5%. Patients with clinical ASCVD were excluded because this population requires statins for secondary prevention based on the guideline (13). The 10-year ASCVD was estimated, as recommended in the ACC/AHA guideline, using the new Pooled Cohort Risk Assessment Equations developed by the Risk Assessment Work Group (15).
Serum/Laboratory Test Results
Lipid profiles were retrospectively reviewed via medical records. The standard lipid profiles in our center consisted of total cholesterol, high-density lipoprotein cholesterol (HDL-C), LDL-C, and triglyceride measurements. Serum levels of fasting blood glucose and high-sensitivity C-reactive protein were additionally obtained. We collected data at the initial visit, CCTA scan, visits due to a major adverse cardiac event (MACE), or those at a later point in time. We calculated the change in LDL-C level by subtracting baseline LDL-C level from the final LDL-C level.
Statin Medication
Information regarding statin prescription was acquired by reviewing medical records. This information included generic and brand of the statin, dose, and period of the medication. The intensity of the statin was categorized according to ACC/AHA guidelines into low, intermediate, and high intensity (13). Comparisons between the guideline recommendation and actual statin prescription, including its intensity, were made for each individual. Statin prescriptions that were consistent with the ACC/AHA recommendation were defined as “standard intensity.”
CT Protocol and Data Acquisition
All patients underwent CACS and CCTA with a 64-slice CT scanner (Brilliance 64; Philips Healthcare, Best, the Netherlands) with a 64 × 0.625 mm detector collimation and 420-ms tube rotation time. The scanning protocol for CACS included a 120-kV tube voltage, 200-mAs tube current, and 2.5-mm scan thickness. Prior to CCTA, all patients with a baseline heart rate > 70 bpm received 10–30 mg of intravenous Esmolol (Jeil Pharm, Seoul, Korea). Sublingual nitroglycerin (0.6 mg) was then administered just before contrast media injection unless patients had any contraindications. During data acquisition, a bolus of iomeprol 80 mL (Iomeron® 400, Bracco, Milan, Italy) was administered intravenously with a flow rate of 4 mL/sec followed by 50 mL (3 mL/sec) of saline chaser. Automated detection of peak enhancement in the descending aorta was performed, and the scan was initiated when the time selected threshold (150 Hounsfield units [HU]) was reached. Retrospective segmental data reconstruction was performed with simultaneous registration of the patients' electrocardiography data. All scans were performed with electrocardiogram-gated dose modulation. All CT images were transferred to a three-dimensional workstation (Extended Brilliance Workspace, Philips Healthcare) for further analysis by using multiplanar reformation, maximum intensity projection, volume-rendering, and curved multiplanar reformation techniques. The CACS was calculated with the Agatston score by using a threshold of 130 HU.
CCTA Image Analysis
Two experienced radiologists (with 14 years and 4 years of experience in CCTA imaging, respectively) independently analyzed images by using a dedicated workstation described above, and the final assessments were reported by consensus.
On the basis of the 16-segment AHA model (11), we analyzed the stenosis degree, plaque burden, and plaque type. The degree of coronary artery stenosis was graded according to the proportion of luminal reduction: none (0%), insignificant CAD (1–49%), or significant CAD (≥ 50%). Plaque burden was determined on the basis of the segment involvement score (SIS), which reflects the number of segments with plaques irrespective of stenosis severity, and the segment stenosis score (SSS), the sum of the extent of stenosis in all 16 individual segments, with the total score ranging from 0 to 48 (12). Plaque types were categorized as follows: 1) calcified plaque, 2) non-calcified plaque, or 3) mixed plaque. In particular, the “high-risk plaque,” defined as lipid-containing plaque < 30 HU with positive arterial remodeling ≥ 1.1 or with a napkin ring sign, was characterized by low intraplaque attenuation surrounded by a higher attenuation rim or spotty calcification < 3 mm within the plaque (1116).
Follow-Up and Primary Endpoint
During a median follow-up period of 87 months (interquartile range: 38–97 months), follow-up information was obtained from the hospital medical records or National Health Insurance Corporation data by two trained researchers independently. For the main outcome, we evaluated MACEs including the following: 1) cardiac death, 2) nonfatal myocardial infarction, and 3) unstable angina requiring hospital stay.
Statistical Analysis
Statistical analysis was performed using a commercial version of SPSS version 20 (IBM Corp., Armonk, NY, USA). Continuous variables were expressed as mean ± standard deviation, and categorical variables were expressed as frequency and percentage. For the comparison of clinical characteristics, demographic, and serum/laboratory test results, the chi-squared test was used. For the comparison of continuous variables, we conducted a t test. Kaplan-Meier survival analysis was used to compare survival with and without statin use. A univariate and multivariate Cox regression analysis was used to evaluate independent predictors of MACEs. A p value less than 0.05 was defined as statistically significant.
RESULTS
Study Population
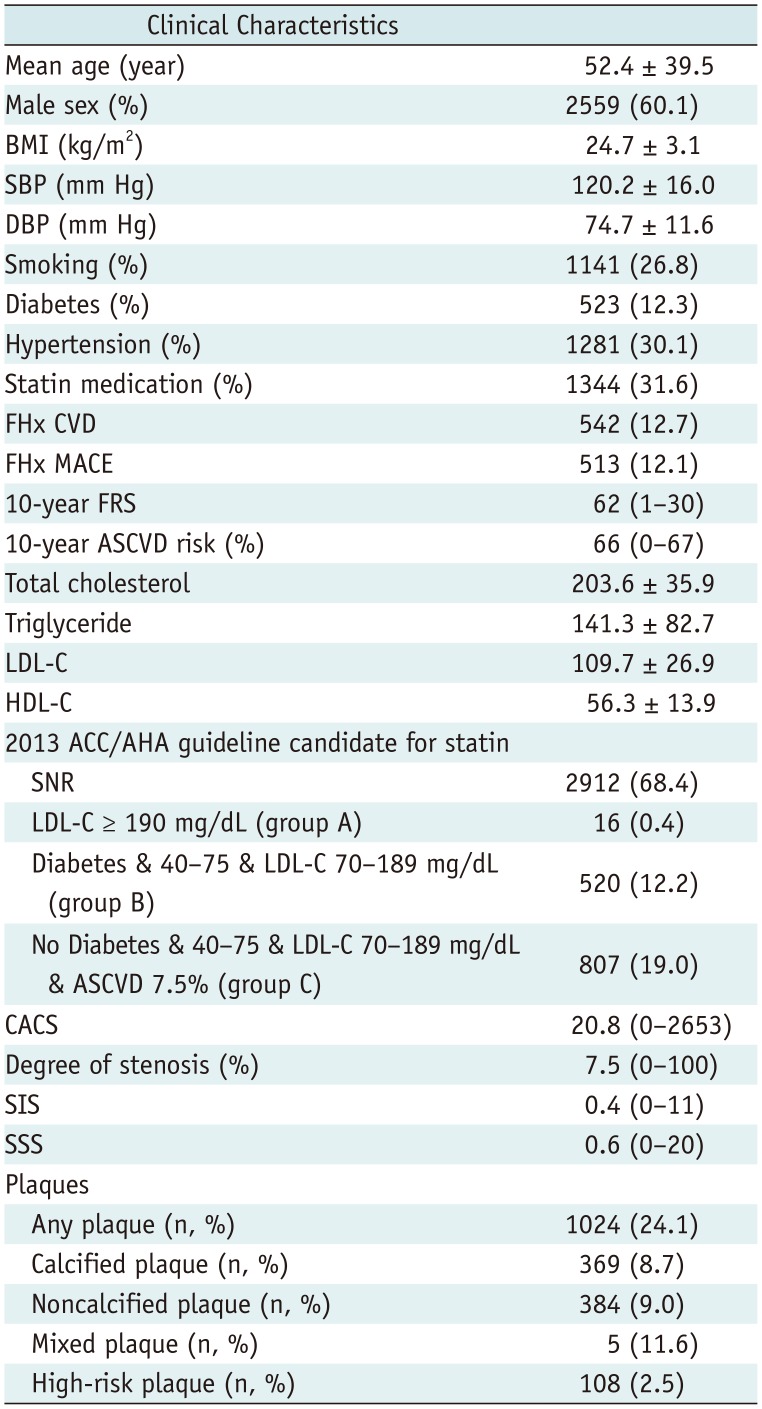
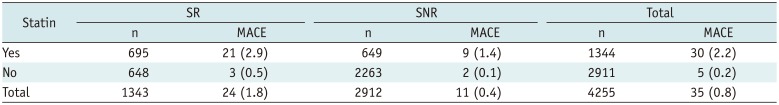
The study population included 4255 patients with a mean age of 52.4 ± 39.5 years. Baseline demographic and clinical characteristics are presented in Table 1. Based on the 2013 ACC/AHA guidelines, 1343 individuals were in the SR group and were eligible for statin therapy for primary prevention of ASCVD.
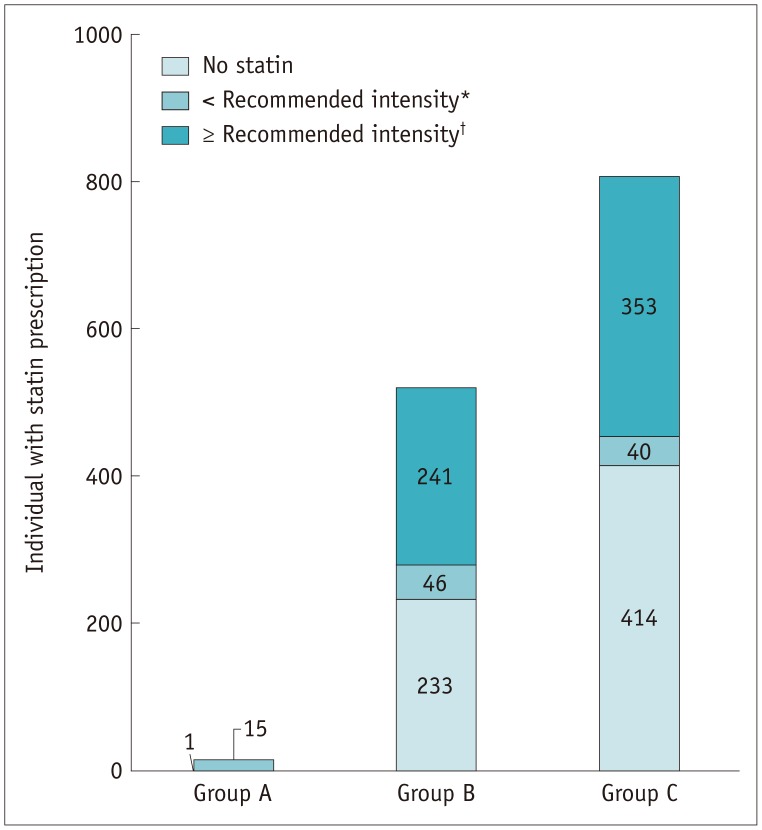
The discrepancies between the recommendation and actual prescription of statin medication are summarized in Figure 1. Among the 1343 individuals in the SR group, 695 were statin users; of these, 20, 588, and 87 patients received high-intensity statins, intermediate-intensity statins, and low-intensity statins, respectively. Among these, standard-intensity statins were prescribed to 594 patients based on the 2013 ACC/AHA guidelines, while 101 patients received a lower intensity than recommended.
MACE Occurrence according to Statin Eligibility Criteria
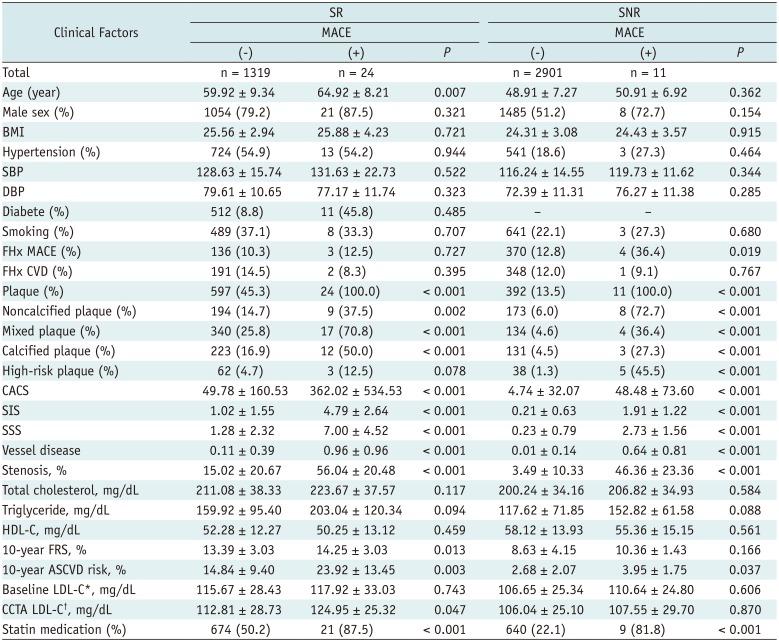
Among the 4255 patients, MACEs occurred in 35 (0.8%) patients. In the SR group, out of 1343 patients, 695 received statin medication and MACEs occurred in 21 (1.6) patients (1 cardiac death, 5 myocardial infarction, and 15 unstable anginas). In the SNR group, MACEs occurred in two (2 unstable anginas) out of 2263 patients. The clinical characteristics of patients according to the occurrence of MACEs and statin therapy recommendation based on the ACC/AHA guidelines are shown in Table 2. In the SR group, patients with and without MACEs showed significant differences in the 10-year ASCVD risk and CCTA findings, including CACS, non-calcified plaque, calcified plaque, mixed plaque, SIS, SSS, degree of stenosis, and LDL-C level at the time of the CCTA scan. However, patient age was the only conventional risk factor that showed significant difference between these two groups (p = 0.01).
Event-Free Survival of MACEs according to CCTA and Statin Intensity in the SR Group
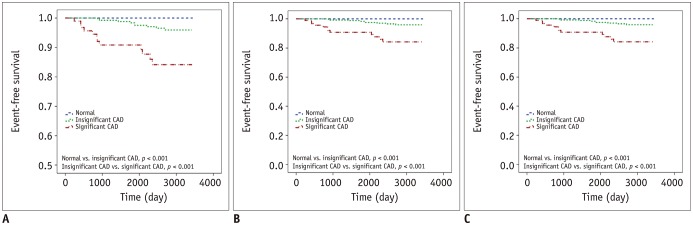
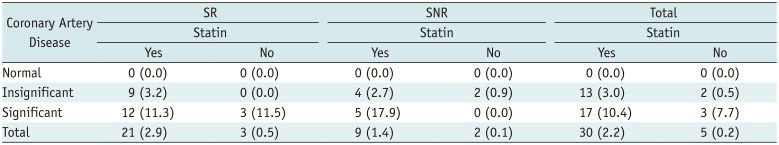
The occurrence of MACEs in the SR and SNR groups, stratified by degree of coronary artery stenosis, is summarized in Table 3. In individuals with a normal coronary artery on CCTA, MACE did not occur regardless of statin medication. MACE occurrence was significantly higher in individuals with significant CAD than in those with insignificant CAD in the SR group (p < 0.001). Among the statin users with insignificant CAD, MACE occurred in 9 out of 285 patients in the SR group; in statin users with significant CAD, MACE occurred in 12 of 106 patients in the SR group. In SR group individuals with significant CAD, there was no significant difference between statin users and non-users (p = 0.810). However, in individuals with insignificant CAD, the event-free survival was significantly lower in statin users (p = 0.034).
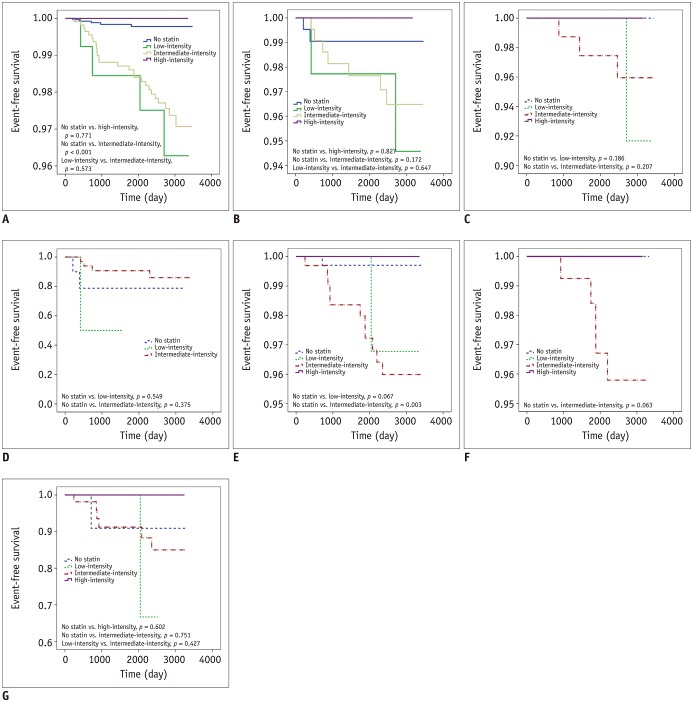
MACEs occurred in 18 of 588 patients who received intermediate-intensity statins and in 3 of 87 patients who were prescribed low-intensity statins. MACEs did not occur in 20 patients who were receiving high-intensity statins (Table 3). MACEs occurred in 18 of 594 patients who had a standard or higher intensity statin medication than recommended. The event-free survival was significantly lower in individuals receiving intermediate-intensity statins. There was no significant survival difference in individuals receiving low- or high- intensity statins (Fig. 2A).
In the SR group with LDL-C ≥ 190 mg/dL (group A), none of the patients received the recommended intensity statin. However, MACEs did not occur. In this group, 11 patients had a normal coronary artery and five had insignificant CAD on CCTA (Fig. 1, Table 4).
In the SR group with diabetes (group B), 5 patients received high-intensity statins and no MACEs occurred. However, MACEs occurred in 2 of the 46 patients who were prescribed intermediate-intensity statins and in 7 of the 236 who received low-intensity statins. The occurrence of MACEs was significantly higher in patients with insignificant CAD than in those with no CAD, and in patients with significant CAD than in those with insignificant CAD (p < 0.001 and p < 0.001, respectively), regardless of statin medication. The event-free survival was not significantly different among patients with different statin intensities (Fig. 2C). However, in patients with significant CAD, the event survival was significantly lower among those receiving low-intensity statin therapy than in those with intermediate-intensity statin therapy (Fig. 2D).
In the SR group with a 10-year risk of ASCVD > 7.5% (group C), 15 patients received high-intensity statins, and MACEs did not occur. However, MACEs occurred in 11 out of 338 patients who were prescribed intermediate-intensity statins and in 1 of the 40 who received low-intensity statins. There was no statistically significant difference in event-free survival among them. The patients who were prescribed intermediate-intensity statins had a lower event-free survival than statin non-users (p = 0.003) (Fig. 2E). There was also no significant difference after the stratification based on CAD degree (Fig. 2F, G).
However, surprisingly, there were statistically significant differences in event-free survival between the degree of CAD with or without statin medication (Fig. 3).
Independent Predictors of MACEs in the SR Group with Intermediate-Intensity Statins
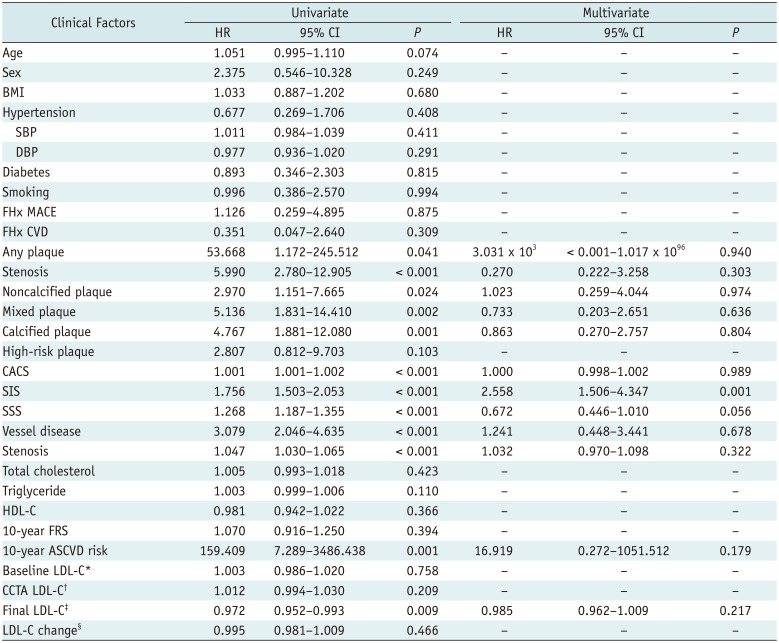
Among the 1327 patients in groups B and C, 43.2% (n = 574) received intermediate-intensity statins, which is the recommended dose for these groups. MACEs occurred in 18 subjects (1 cardiac death, 4 myocardial infarction, and 13 unstable anginas). As shown in Table 5, the unadjusted risk of MACEs was associated with presence of plaque, significant CAD, non-calcified plaque, mixed plaque, calcified plaque, CACS, SIS, SSS, number of vessel diseases, degree of stenosis, 10-year ASCVD risk, and final LDL-C level. In the multivariable analysis, only SIS was a significant independent predictor of MACE (hazard ratio 2.558, p = 0.001).
DISCUSSION
When applying the 2013 ACC/AHA cholesterol treatment guidelines (13), our study revealed that nearly one-thirds of asymptomatic subjects were potentially eligible for statins. Approximately one-half of these statin candidates showed normal CCTA findings. This finding is similar to those reported in a previous study using CACS in asymptomatic statin candidates (17). Moreover, MACE occurrence was significantly higher in individuals with significant CAD than in those with insignificant CAD. This observation is consistent with prior reports highlighting the prognostic value of CCTA.
Recent studies have revealed that the impact of the updated recommendations will be higher treatment rates among those expected to have future cardiovascular events (18). Thus, accurate risk assessment that can identify these lower-risk subjects can potentially have a profound impact in facilitating appropriate resource allocation and shared decision-making to allow flexible treatment choices (17). Our study results suggest that the presence of normal CCTA findings can address these challenges by providing incremental information that may move many people from risk levels wherein treatment is recommended to risk levels where it is not.
The concept of screening for asymptomatic atherosclerosis has already been described (519). The 2013 ACC/AHA guidelines classified CACS and ABI under recommendation class IIb if treatment decisions are uncertain. CIMT was also not recommended and CCTA was not even mentioned (1315). Several recent studies estimated the CVD risk of patients who did not take statins according to the 2013 ACC/AHA and National Cholesterol Education Program-Adult Treatment Panel III (NCEP-ATP III) guidelines by performing a retrospective review of medical records and CCTA and CACS findings. These studies compared the calculated risk and the actual outcome over a few years of follow-up. They concluded that the new revised guidelines would be useful for risk assessment in asymptomatic coronary atherosclerosis or moderate-risk groups (2021). A few studies have studied the beneficial effect of statins on patients with insignificant or significant CAD (222324). Our study revealed that the SIS on CCTA was the only independent predictor of MACEs. Hulten et al. (25) reported a significant increase in survival rate only when SIS > 4, which is similar to our findings. Moreover, MACE occurrence was significantly higher in individuals with significant CAD than in those with insignificant CAD. The results of the present study suggest that CCTA may be helpful in assessing CVD risk and determining statin treatment. In particular, patients contraindicated for statins or those with statin intolerance can avoid unnecessary medication by further risk stratification with CCTA. In addition, a risk-benefit analysis considering the costs and potential adverse effects of statins or contrast media is needed to provide a complete assessment of the effects of the change in statin eligibility guidelines on the healthcare system (15). Further clinical trials should be undertaken to investigate the specific statin dose or treatment strategy and evaluate its effect.
Interestingly, in this study, the event-free survival was significantly lower in statin users with insignificant CAD of the SR group. However, for individuals with significant CAD in the SR group, no significant difference in event-free survival was observed between statin users and non-users. Comparisons between statin users and non-users showed significant differences in CCTA findings, even though the conventional risk factors did not indicate any differences. Therefore, the discrepancy between the results of the previous studies and the present study is presumed to be due to differences in statin dose, intensity, and CCTA findings (Table 6). Very recently, 2018 Cholesterol Clinical Practice Guidelines emphasized the selective use of high-intensity statin therapy as well as non-statin therapy such as ezetimibe in selective patients with high risk (26). However, in this study, most patients received intermediate statins only. We speculated that this discrepancy is a potential cause of the lack of significant differences in event-free survival between statin users and non-users in patients with SR group with significant CAD.
There were several limitations to our study. First, it was a retrospective study; the criteria for prescribing statins varied with each physician and patient, and prior statin guidelines involved target LDL-C levels instead of specific statin intensity. Second, only a small number of patients received high-intensity statins. This therefore limited the detection of a significant difference in survival between low- or intermediate-intensity statin groups, although no MACEs occurred in patients receiving a high-intensity statin. Third, changes in prescription during the follow-up were not considered and patients who received prescriptions from their primary clinic were regarded as follow-up loss. The effect of each type of statin was also not evaluated. Finally, the study population was drawn from the same ethnic background and geographical region.
In conclusion, significant heterogeneity for risk stratification exists among statin candidates according to the 2013 ACC/AHA Cholesterol Management Guidelines. The normal CCTA could reclassify approximately one-half of statin candidates as not eligible. Among CCTA findings, SIS was an independent significant predictor for MACE, beside the risk assessment based on the guideline, which might explain the higher MACE occurrence in the low-risk group. CCTA might facilitate risk stratification of CVD in asymptomatic individuals for the blood cholesterol management.
 XML Download