

 PDF
PDF ePub
ePub Citation
 Print
Print


INTRODUCTION
Alzheimer's disease (AD) is the most common form of dementia in the elderly population. Numerous studies have examined neuroimaging biomarkers using structural and functional magnetic resonance imaging (MRI). Structural imaging in patients with AD revealed a general reduction in cortical thickness (CThk), with specific atrophy patterns in the medial temporal, dorsolateral frontal, and posterior cingulate cortical regions (123). Using resting-state functional MRI (rsfMRI), the long-distance functional connectivity (FC) between the medial prefrontal cortex (mPFC) and posterior cingulate cortex (PCC) in the default mode network (DMN) has been found to be diminished in AD (456), supporting the perspective of the disease as a disconnection syndrome (578). Both structural and functional changes are closely linked to the pathophysiology of AD, occurring where amyloid protein deposition and reduced glucose metabolism are found (1910).
Recent work using the Alzheimer's Disease Neuroimaging Initiative (ADNI) reported that improved AD diagnostic accuracy may be achieved using a combination of CThk from MRI, FDG-PET, cerebrospinal fluid, and clinical variables (11). This study suggests that a proper combination of biomarkers is likely to improve the ability to discriminate AD from other disorders. However, diagnostic studies in AD using information combined from structural and functional MRI have been limited, partly because the CThk of the medial temporal regions, the most commonly used structural measures, correlates poorly with functional measures of DMN (1213).
We hypothesized that a proper combination of structural and functional neuroimaging data that includes CThk and FC would improve the diagnostic accuracy of AD. To address this, we identified potential regions of correlation between CThk and DMN FC that demonstrated differences between AD and healthy control (HC) groups. The purpose of this study was to identify potential imaging biomarkers of AD by combining brain CThk and FC, and to test diagnostic accuracy in a validation dataset.
MATERIALS AND METHODS
Study Population
Study Set
This retrospective study was approved by the Review Board of our institution, and the requirement for informed consent was waived. We included data from patients with clinical diagnosis of AD according to diagnostic guidelines of the National Institute on Aging-Alzheimer's Association workgroups (14). In all cases, AD was diagnosed by two experienced neurologists, and the severity of clinical symptoms was assessed with the Mini-Mental State Examination (MMSE) and Clinical Dementia Rating Scale (CDR).
The records of 77 consecutive adult patients that underwent rsfMRI and had structural imaging and neuropsychiatric examination data, including the MMSE and CDR, March 2013-March 2016 were selected from our hospital database. We excluded patients younger than 60 or older than 80 and those with poor rsfMRI image quality (e.g., movement artifacts). Forty-one patients were found eligible for the study according to the following inclusion criteria: 1) a clinical diagnosis of AD, 2) right-handedness, 3) no history of major medical disorders (neoplasm or heart disease) or other neurologic disorders, 4) no ongoing pharmacologic treatment or alcohol abuse, and 5) adequate rsfMRI imaging and structural imaging data acquisition.
After informed consent was obtained, 22 subjects were enrolled as HCs. These individuals underwent the same functional and structural imaging and neuropsychiatric examinations as the AD patients. Their ages ranged from 60-80 (mean, 67.9 years). The HCs met the following inclusion criteria: 1) MMSE score of 29 or 30, CDR score of 0, and Geriatric Depression Scale score of 0; 2) righthandedness; 3) no history of major medical (neoplasm or heart disease) or neurologic disorders; 4) no ongoing pharmacologic treatment or alcohol abuse; and 5) adequate rsfMRI imaging and structural imaging data acquisition.
Validation Set
For a validation set, we selected records of patients with AD and HCs from a multicenter biomarker study, the ADNI database (http://www.loni.usc.edu). All subjects had undergone rsfMRI and structural imaging March 2011-July 2015. To keep the imaging protocol homogeneous within the study set, we only included the ADNI-GO and ADNI2 study phase databases, and only those obtained with a 3T MRI scanner (Philips Healthcare, Best, The Netherlands); this produced a starting sample size of 161 subjects. After a visual inspection and review of the data by an expert, a significant number of patients were excluded due to motion artifacts, field-of-view cuts, and low rsfMRI quality. After the series of exclusions, we chose patients that were agematched and sex-matched with our study set. This resulted in 35 subjects (16 patients with AD and 19 HCs). Subjects enrolled in ADNI met the following criteria: 1) age 60-80 with no other significant neurologic conditions, 2) available results of cognitive and neuropsychiatric examinations, and 3) adequate rsfMRI imaging and T1-weighted imaging acquisition.
Imaging Data Acquisition and Processing
Structural Imaging Data
MRI was performed with a 3T system (Achieva; Philips Medical Systems, Best, The Netherlands) using an eightchannel sensitivity-encoding head coil. A high-resolution anatomical 3D volume image was obtained using a 3D gradient-echo T1-weighted sequence with the following parameters in accordance with ADNI protocol: repetition time/echo time, 9.9/4.6 msec; flip angle, 8°; field of view, 224 mm; matrix, 224 × 224; and slice thickness, 1 mm with no gap. The T1-weighted images were segmented by using the default automated gyral-based parcellation method of FreeSurfer (version 5.3.0; http://surfer.nmr.mgh.harvard.edu), which yielded 83 cortical and subcortical regions of interest (15). The cortical surface was reconstructed using a meshwork of 150000 triangles for each subject. Each point of intersection between triangles is known as a vertex, and each vertex has an associated xyz coordinate. CThk was extracted directly using the automated segmentation tool of FreeSurfer and normalized for head size using the total intracranial volume (also taken from FreeSurfer).
Functional Imaging Data
Resting-state functional MRI images were acquired parallel to the anterior commissure-posterior commissure plane after anatomical imaging acquisition. Blood-oxygenlevel-dependent contrast functional images were acquired using single-shot gradient-echo/echo-planar imaging with the following parameters: repetition time/echo time, 3000/30 msec; flip angle, 90°; field of view, 212 mm; matrix, 64 × 64; slice thickness, 3 mm with no gap; number of slices, 47; number of dynamics, 140; and acquisition time of 7 minutes 3 seconds. Subjects were instructed to close their eyes and not to fall asleep during image acquisition. The imaging acquisition protocol for the ADNI data is described in the Supplementary (in the online-only Data Supplement).
The functional imaging data were processed by two imaging scientists (with one and nine years of experience in image analysis, respectively) using Functional Magnetic Resonance Imaging of the Brain Software Library (FSL; http://www.fmrib.ox.ac.uk/fsl/). The first six volumes of the functional images were discarded to prevent possible effects of imaging instability. Correction for head motion and slice timing, removal of linear trends, and filtering of the temporal bandpass (0.01-0.1 Hz) were performed. The functional images were then spatially normalized into the Montreal Neurologic Institute template with a resampled voxel size of 4 × 4 × 4 mm3. Finally, images were spatially smoothed with a 5-mm full-width at half-maximum isotropic Gaussian kernel.
The independent component analysis (ICA) procedure provided by software (Group ICA of fMRI Toolbox (16)) was used to identify networks differing between the AD and HC groups. A spatial template-matching procedure was performed as previously described (17) to identify default mode, left and right executive, salience, motor, auditory, and visual functional networks.
Identifying Regions of Significant Group-Wise Differences in Correlations between CThk and FC
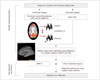
The group ICA identified the DMN as a functional network differing between the AD and HC group (Fig. 1). Once identified, the mean blood-oxygen level-dependent signal time series was extracted from the DMN template using the template-matching procedure of the ICA to estimate FC. A correlation value was computed according to standard methods using time series extracted from the seed regions of interest by averaging overall included voxels. In each subject, the correlation value (r) between the mPFC and PCC (mPFC-PCC FC) was extracted.
To perform the group analysis between the AD and HC groups, we used the following protocol: 1) CThk values of all vertices in each individual were obtained in FreeSurfer and 2) r values for DMN FC for each individual were loaded into Query, Design, Estimate, Contrast (QDEC). The design question for the generalized linear model in QDEC was “Is CThk in each subject explained by r values for DMN FC?” Thus, the correlation between CThk values of all vertices and r values for DMN FC for each subject was calculated. Then vertices revealing significant group differences in the correlation between AD and HC groups are displayed on a spatial map, with smoothing of 10 mm by fitting of a generalized linear model at each vertex. The regions with significant differences in correlation were identified after correcting for the false discovery rate for multiple comparisons. When a specific vertex is selected, a plot of r values (x-axis) versus CThk values (y-axis) is generated, and each data point is representative of an individual subject. A schematic diagram for identifying regions with groupdifference between AD and HC is shown in Figure 2.
Raw structural and functional data were retrieved from the ADNI, with data anonymized. Protocol parameters and up-to-date information are described in the ADNI Procedure Manual (http://adni.loni.usc.edu/methods/documents/mriprotocols/). All structural and functional images in ADNI were preprocessed as described above for subjects' data.
Statistical Analysis
Comparison of Clinical Variables, CThk, and FC
Statistical analyses were performed using the SPSS package (version 21.0; SPSS Inc., Chicago, IL, USA). Students' t test was used to compare the clinical characteristics, global CThk, and the differences in the r value of mPFC-PCC FC between patients with AD and HCs. All tests were two-sided. A p value of 0.05 was considered to indicate a significant difference.
Diagnostic Accuracy of Combining CThk of Identified Regions and FC
We used a support vector machine (SVM) algorithm implemented in Matlab 2013a (MathWorks, Natick, MA, USA) (18) after training with the results from the study set to calculate the diagnostic accuracy in the ADNI validation set. Briefly, the SVM separates a given data set of binary labeled training data by means of a hyperplane that has a maximum distance between the two classes (1920). The greater the distance of a subject from the hyperplane, the higher the likelihood that the subject belongs to a specific class. Using the CThk of the identified locations from the QDEC tool and the r value of mPFC-PCC FC, the hyperplane with the highest diagnostic accuracy was determined in our study set. The hyperplane was trained by using the study set data, and the SVM was applied to the independent data of the ADNI set to calculate diagnostic accuracy. No ADNI data was used during training of the SVM models.
RESULTS
Clinical Variables, CThk, and mPFC-PCC FC
Clinical characteristics of the subjects are presented in Table 1. No difference in age, sex, or handedness was found between patients and controls in either the study or ADNI sets. Compared with HCs, patients with AD had a significantly lower MMSE score (p < 0.001) but a significantly higher CDR score (p < 0.001) in the study and ADNI sets. Patients with AD also had significantly fewer years of education (p < 0.001) in the study set. Global CThk was significantly lower in patients with AD than in HCs (2.17 ± 0.13 mm in patients vs. 2.36 ± 0.08 mm in HCs, p < 0.001). The various regions demonstrating significant differences in CThk between AD and HC groups are shown in the Supplementary Tables 1, 2 (in the online-only Data Supplement).
Patients with AD had a significantly lower r value for mPFC-PCC FC than HCs (0.569 ± 0.202 vs. 0.718 ± 0.123, p = 0.002) (Table 2).
Regions with Significant Differences in Correlation between CThk and mPFC-PCC FC between Patients and Controls
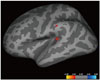
Group-wise computation was performed to identify regions showing significant differences between the CThk and r values of mPFC-PCC FC in a vertex-wise comparison using the QDEC module. No focal regions were present in the right hemisphere. The left hemisphere revealed two regions with significant differences between patients and controls: the superior temporal gyrus (STG) (p < 0.001; area, 92.64 mm3; [x, y, z on Talairach coordinates] = [-42.0, -34.9, 5.9]) and supramarginal gyrus (SMG) (p = 0.007; area, 16.94 mm3; [x, y, z] = [-57.5, -28.4, 31.1]) (Fig. 3).
Combining CThk from Identified Regions
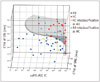
An illustration of the SVM model hyperplanes in our study set to differentiate between patients with AD and HCs is shown in Figure 4. After training, the SVM-based diagnostic accuracy for the ADNI set was calculated (Table 3). Adding the STG and SMG CThk of the left cerebral hemisphere to mPFC-PCC FC yielded a 16.7% greater diagnostic accuracy than adding the CThk of both medial temporal lobes, and a 14.6% greater diagnostic accuracy than the combination of the CThk of both medial temporal lobes and mPFC-PCC FC.
DISCUSSION
In our study, we demonstrated that a proper combination of structural and functional information can improve the diagnostic accuracy of AD. Combining mPFC-PCC FC with the CThk of the STG and SMG of the left cerebral hemisphere rather than with the conventionally used CThk of the bilateral medial temporal lobes improved diagnostic accuracy.
Previous studies independently revealed impaired functional or structural topology in patients with AD including reduced FC in the DMN (12122) and structural atrophy in the medial temporal regions (323). However, there are few studies which correlated or combined functional and structural imaging. Liu et al. (5) found that the strength of long-distance functional connections measured on a whole brain scale was linked with a reduced cortical volume of the posterior DMN components. Our study hypothesized that differences between patients with AD and HCs may exist when correlating regional CThk and longdistance functional connections, enabling differentiation between AD and healthy brains.
Though hippocampal atrophy is a representative structural metric for diagnosing AD, it correlates poorly with DMN FC (132425). However, studies found potential links between DMN FC and the neocortex, such that the entorhinal cortex mediates the connections between the hippocampus and the DMN-related regions of the neocortex (262728). Additionally, white matter bundle integrity of the DMN is linked with medial temporal lobe atrophy; it also explains interaction between the medial temporal lobe and parietal lobe (29). Therefore, we hypothesized that certain locations may be closely linked to DMN FC, and therefore mediate the structural atrophy in the neocortex beyond the medial temporal lobe.
The regions we identified-the STG and SMG-were in the left cerebral hemisphere, the dominant hemisphere in right-handed individuals, and the one expected to be more vulnerable to neuropathological disruptions of cognitive function. Regions near the temporoparietal junction have revealed higher diagnostic accuracy for AD. A previous study using computational modeling of neural dynamics revealed that structural disruption of the temporoparietal junction significantly impacts functional connections (30). In the normal aging process, a compensation system maintains a cognitive reserve (6) in which long-distance FC declines while local connectivity in the frontal and parietal regions increases. In patients with AD, the disrupted correlation between the DMN and CThk at the temporoparietal junction revealed in our study may be related to a failed compensatory mechanism.
In our study, the DMN was identified on rsfMRI as the network revealing significant differences between patients and controls. This network plays a fundamental role in brain function related to attention processing and cognitive control (3132). A combination of mPFC-PCC FC and structural data has been investigated (32), but the diagnostic accuracy of combining FC with CThk has not been previously tested. The strength of our study is the validation of diagnostic accuracy using an external validation set from ADNI data. Our findings further support the concept that the appropriate combination of biomarkers can improve diagnostic accuracy in AD (1133). Our methods can be applied in subsequent studies.
Of note, the sensitivity of our model was somewhat low (68.7%), although specificity was high (94.7%). Among imaging substrates, hippocampal atrophy revealed the highest sensitivity in diagnosing AD (34). However, high sensitivity can generate false positives (over-diagnosis) in subjects with medial temporal lobe atrophy, and therefore reduces accuracy. The accuracy of our model was higher than when using only CThk of the medial temporal lobes, or when using the combination of CThk of the medial temporal lobes and mPFC-PCC FC, although such models may produce higher specificity.
The present study has several limitations. First, the number of subjects in each group was relatively small. In a study on rsfMRI biomarkers for AD, Liu et al. (5) reviewed previous studies and observed the median total sample size was 37 and the median size of the patient groups (with AD and/or mild cognitive impairment) was 18. Our sample size was therefore comparable to prior studies. We separately analyzed an independent data set from ADNI to validate our findings and strengthen the generalizability of the biomarkers identified. Second, we did not include patients with mild cognitive impairment. The purpose of our study was to identify potential biomarkers in patients with AD that are significantly different relative to those in the healthy elderly population. We therefore specifically included only patients with progressive AD of sufficient severity to provide accurate results. Further prospective analyses including those with mild cognitive impairment may be needed to determine if these specific regions are affected early in the disease process.
In conclusion, a proper combination of structural and functional information is useful in the diagnosis of AD. We found that combining mPFC-PCC FC with CThk of STG and SMG of the left cerebral hemisphere rather than with CThk of the bilateral medial temporal lobes had improved diagnostic accuracy. This multimodal MR approach was revealed to be robust by external validation, thus supporting studies of these specific cerebral regions for future investigation of AD.


 XML Download