Journal List > Korean J Radiol > v.17(6) > 1027281

Park and Moon: Structural MR Imaging in the Diagnosis of Alzheimer's Disease and Other Neurodegenerative Dementia: Current Imaging Approach and Future Perspectives

Abstract

With the rise of aging population, clinical concern and research attention has shifted towards neuroimaging of dementia. The advent of 3T, magnetic resonance imaging (MRI) has permitted the anatomical imaging of neurodegenerative disease, specifically dementia, with improved resolution. Furthermore, more powerful techniques such as diffusion tensor imaging, quantitative susceptibility mapping, and magnetic transfer imaging have successfully emerged for the detection of micro-structural abnormalities. In the present review article, we provide a brief overview of Alzheimer's disease and explore recent neuroimaging developments in the field of dementia with an emphasis on structural MR imaging in order to propose a simple and easily applicable systematic approach to the imaging diagnosis of dementia.

INTRODUCTION

The prevalence of dementia is rapidly increasing in developed countries because of significant increase in aging population. According to the 2014 World Alzheimer's Report, dementia affects approximately 44 million people worldwide, and the incidence of Alzheimer's disease (AD) is expected to triple by the year 2050 (1). Accordingly, the extent of research on the neuroimaging of dementia has expanded tremendously in the last decade, thus enabling easier differential diagnosis of dementia and more precise monitoring of disease progression using structural and physiological magnetic resonance (MR) imaging features. The 3T MRI in particular provides better resolution of structural imaging, and more robust performance of advanced techniques such as diffusion tensor imaging (DTI), perfusion-weighted imaging, MR spectroscopy, and functional MRI. In addition, development of new positron emission tomography (PET) ligands specific for pathological substances such as β-amyloid (Aβ) provides new perspectives on the diagnosis of dementia.
Despite advancements made in MR imaging, radiologists are often reluctant to make a specific diagnosis of clinical dementia due to lack of specific findings. At times, subtle findings such as mild regional atrophy are neglected and imaging diagnosis of dementia is regarded as useless. Therefore, introduction of a systematic and practical approach to the imaging diagnosis of dementia is required. The imaging of dementia has not only diagnostic and prognostic potential, but may also grant unique insights into dementia itself. Therefore, the objective of this review article is to provide a brief overview of AD, and investigate recent neuroimaging developments in the field of dementia with an emphasis on structural MR imaging in order to propose a systematic approach for the imaging diagnosis of dementia.

Alzheimer's Disease

Alzheimer's disease is the most common cause of dementia. AD is characterized by progressive neurodegeneration accompanied by cognitive impairments that interfere with the activities of daily living and ultimately impose heavy economic burdens on the patient and the patient's family (2).

Characteristic Pathology and Pathogenesis Model of AD

Alzheimer's disease is characterized by the accumulation of two abnormal proteins: extracellular Aβ protein and intracellular tau protein (34). Amyloid and tau deposition progress spatiotemporally in a predictive manner. Amyloid first accumulates in the basal part of the frontal, temporal, and occipital lobes, and subsequently spreads to the entorhinal cortex, hippocampus, amygdala, insular cortex, and cingulate cortex, sparing the primary visual and sensorimotor cortices. Conversely, neurofibrillary tangle deposition progresses in the following order: transentorhinal cortex, entorhinal cortex, hippocampus, temporal cortex, association cortices, and finally the primary sensorimotor and visual cortices (5).
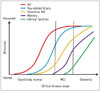
The Aβ hypothesis, the dominant theory of AD, suggests that overproduction or inadequate clearance of Aβ is a causative factor for AD; AD begins with the abnormal metabolism of the transmembrane amyloid precursor protein (APP). β- and γ-secretases cleave APPs to form several Aβ peptide fragments (1). Of these, the most important is Aβ42, which is highly prone to aggregation and resultant plaque formation (6). Although amyloid deposits are typically observed in the extracellular space, Aβ is also found within neurons, and this may be related to the aggregation of other cellular proteins such as tau protein in AD (7). Subsequently, abnormal phosphorylation of the microtubule-associated tau protein in neurons and the formation of neurofibrillary tangles are thought to result in the disruption of normal neuronal function (1). Oxidative and inflammatory stresses from Aβ also contribute to the loss of synaptic and neuronal integrity, and finally, neuronal loss and brain atrophy. This downstream pathological cascade has been re-interpreted by the hypothetical model of Jack et al. (8) (Fig. 1). Conversely, Braak and Del Tredici (9) observed hyperphosphorylated tau protein in the absence of Aβ deposition in the medial temporal limbic isocortex of young individuals. Furthermore, recent evidence suggests that tau deposition is a requisite for amyloid toxicity in vivo (10). These findings raise questions regarding the role of Aβ as an initiator of the AD pathophysiological cascade.

Mild Cognitive Impairment or the Prodromal Phase of AD

The time course of AD is approximately 20–30 years from preclinical (cognitive normal) to prodromal (mild cognitive impairment [MCI] or pre-dementia) to overt AD. The prodromal phase of AD is commonly referred to as MCI, which is characterized by the onset of cognitive symptoms (e.g., memory or other cognitive dysfunctions) that do not meet the criteria for dementia (811). The prevalence of MCI in non-dementia individuals over the age of 70 years is approximately 15% with a 2:1 ratio of amnestic to non-amnestic types (1213). Previous studies have indicated that approximately 10–15% of MCI patients progress to AD yearly, and predictors of this conversion include the APOE4 allele of the apolipoprotein E gene (APOE), clinical severity, brain atrophy, certain cerebrospinal fluid (CSF) biomarkers, changes in cerebral glucose metabolism, and Aβ deposition (14). The National Institute on Aging-Alzheimer's Association recently developed new diagnostic criteria for AD, MCI due to AD, and preclinical AD that integrate biomarker evidence into the diagnostic frame (1516). In these criteria, concomitant observation of amyloid deposition (PET or CSF) and neuronal injury (tau, FDG-PET, MRI) indicates a high likelihood of MCI due to AD, while the presence of only one of these factors indicates an intermediate likelihood of MCI due to AD (16). Recent International Working Group-2 criteria further simplified the diagnosis of AD based on the requirement of only the presence of an appropriate clinical phenotype at any stage and presence of amyloid biomarker (e.g., decreased Aβ in CSF, or increased tracer retention on amyloid PET) (17).

Structural Imaging

Structural Imaging as a Mirror of Dementia Pathology

Structural MR imaging is recognized as an important diagnostic tool for AD, as it can both differentiate AD from non-AD dementia and potentially estimate preclinical or prognostic tissue damage in vulnerable regions such as the hippocampus and entorhinal cortex (18). Structural MR imaging is also important for the exclusion of meningioma, glioma, subdural hematoma, vascular malformation, and normal pressure hydrocephalus (19).
Specific patterns of cortical atrophy and vascular pathology distinguish typical AD from other neurodegenerative dementias including frontotemporal dementia (FTD), corticobasal degeneration (CBD), progressive supranuclear palsy (PSP), and vascular dementia (19). Thus, identification and classification of cortical atrophy patterns and vascular pathology are of utmost importance for accurate and effective usage of MR imaging in patients with cognitive impairment.

Cortical Atrophy

Cortical Atrophy in AD and Other Dementias

Accumulation of amyloid plaques and neurofibrillary tangles in AD is contemplated to induce neural and synaptic loss that finally leads to cortical atrophy. Cortical atrophy typically occurs first in the hippocampus and associated entorhinal cortex prior to pervasive progression, and is considered to be an early marker of neurodegeneration (20). Furthermore, the degree of hippocampal atrophy on antemortem MRI has been demonstrated to be correlated with the postmortem severity of neuropathological changes in AD (21). These data suggest importance of accurate recognition of specific atrophy patterns. In the following section, we will discuss specific atrophy patterns and atrophy scales employed for quantitation (Table 1).

Diffuse Cortical Atrophy

Diffuse cortical atrophy is a common finding in various pathological states such as stroke, radiation treatment, and neurodegenerative disorders as well as in normal aging. The global cortical atrophy (GCA) scale was first introduced as a tool to quantify this kind of atrophy in stroke patients with or without dementia. The GCA evaluates atrophy in 13 different brain regions (frontal, parieto-occipital, and temporal sulcal dilation, and dilatation of the ventricles) and assigns a subscore (0 to 3) at each of these levels (22). Studies have demonstrated the predictive value of the GCA for dementia and associated mortality, and confirmed good inter-observer agreement (κ = 0.84) (2324). However, considering that GCA evaluates large brain areas, it is more likely to be confounded by age than other atrophy scales, and is primarily utilized for larger diagnostic assessments (2425). As an alternative, a four-point ventricular enlargement scale (0 to 3) was developed to quantify enlargement of the lateral ventricles in an axial orientation, and this scale has also demonstrated very good inter-observer agreement (intra-class correlation coefficient = 0.85) (26). However, poor diagnostic performance (sensitivity/specificity of 94%/40%) was reported for distinguishing patients who have AD and dementia with Lewy bodies as compared to healthy controls (26). The reason is hypothesized as substantial variation in ventricular size even between healthy individuals (25).

Medial Temporal Lobar Atrophy

Atrophic changes of the medial temporal lobe are commonly found in association with different stages of AD and MCI, but are less commonly related to normal aging (212728). Recently, the NINCDS-ADRDA suggested incorporation of structural MRI of the medial temporal lobe into the criteria for probable AD, but this suggestion did not specify a method for atrophy evaluation.
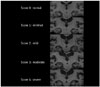
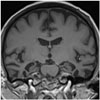
Medial temporal lobe atrophy (MTA) was first quantified by Scheltens et al. (29) using a 5-point subjective scale (0–4) surveying the width of the surrounding CSF spaces and the height of the hippocampal formation; results showed significant differences in MTA between patients with AD and healthy controls in association with good correlation between scale values and linear measurements (Table 2). These findings suggest that visual MTA ratings might provide constructive and rapid assessment for diagnosing or excluding AD in clinical practice (30); however, in a research setting, low inter-observer reliability for this scale (κ = 0.59–0.62) might be problematic (Fig. 2) (3132). Additionally, Scheltens' coronal plane was obtained parallel to the brain stem axis from a midsagittal scout image with a slice thickness of 5 mm and an interslice gap of 1 mm on 0.5 or 0.6T MRI (29), which is different from the current MR acquisition technique to some extent. Recent studies employing the Scheltens 5-point scale with a modified oblique coronal plane perpendicular to the anterior-posterior commissure line with slice thicknesses between 0.8–4 mm have shown more promising results and better inter-observer reliability (weighed κ = 0.65–0.84) (2333).
Duara et al. (34) and Urs et al. (35) also developed a visual rating system for MTA using the mammillary bodies as a landmark to include more standardized portions of the hippocampal head, entorhinal cortex, and perirhinal cortex. Based on this method, standardized atrophy ratings are obtained using software and a 5-point rating scale (0 to 4). This visual rating system showed good diagnostic performance for both MTA and AD (sensitivity/specificity: 82%/82% and 85%/82%, respectively) (3435), but the studies had some limitations. A modified visual rating system for MTA in the axial plane was recently proposed and showed a good correlation with results of the well-known coronal visual rating system designed by Scheltens et al. (κ = 0.772) and fairly good performance for discriminating AD from healthy controls (sensitivity/specificity 76%/80%) (36).

Posterior Cortical Atrophy

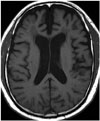
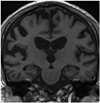
Early posterior cerebral involvement has emerged as an important aspect of AD, and appears to be a feature of early-onset rather than late-onset AD. Therefore, posterior cortical atrophy (PCA) combined with relative sparing of the medial temporal lobe may characterize atypical presentations of AD patients (Fig. 3) (3738394041). The Koedam scale is a 4-point rating scale (0–3) based on the presence of atrophy in sagittal, axial, and coronal orientations of selected anatomical regions: the posterior cingulate sulcus, precuneus, parieto-occipital sulcus, and parietal cortices (42). This scale demonstrated good inter-observer agreement (weighted κ = 0.73) and a sensitivity/specificity of 58%/95% for distinguishing AD; additionally, a subsequent study validated the ability of the Koedam scale to discriminate AD patients from healthy controls (area under the curve [AUC] = 0.74) and frontotemporal lobar dementia patients from AD patients (AUC = 0.66), respectively (38). Recent quantitative validations of this scale have allowed it to be considered as a fast and easily applicable tool in clinical practice (43).

Frontotemporal Lobar Atrophy

A scale for frontotemporal lobar atrophy (FTLA) was first developed based on the assessment of postmortem specimens of FTD (44), and assessed two coronal slices at the level of the anterior temporal lobe and lateral geniculate nucleus using a 5-point scale (0–4). The scale initially showed potential as an outcome predictor for FTD (Fig. 4) (45). Kipps et al. (46) further extended the scale to include the posterior temporal lobe, and observed a sensitivity of 100% for semantic dementia (SD) and 53% for behavioral variant FTD. It is noteworthy that FTLA scales have been developed with selective focus on the differential diagnosis of FTD, rather than its differentiation from AD.

Anterior Temporal Lobar Atrophy

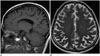
Semantic dementia is a syndromic variant of FTD, and is typified by semantic memory impairment with preservation of episodic memory. While this is a key clinical feature that differentiates SD from AD (47), distinction is not so easily achieved in the earlier stages of disease. One study observed primary involvement of the left anteroinferior and anteromedial temporal lobe with relative sparing of the posterior temporal lobe in SD, as opposed to generalized atrophy in AD (48). Thus, it is proposed that focal anterior temporal lobe atrophy may be a helpful differential diagnostic clue for SD (Fig. 5).

Asymmetric Cortical Atrophy

Bilateral asymmetric perisylvian atrophy can be seen in primary non-fluent aphasia variant of FTD (Fig. 6) (19). CBD produces striking asymmetrical parietal and frontal atrophy while sparing the medial temporal regions, as opposed to near-proportionate atrophy of the fronto-temporo-parietal cortices in AD (Fig. 7) (49). While there are some cases of asymmetrical cerebral atrophy in AD (5051), the observation of asymmetrical cerebral atrophy is usually not in favor of diagnosis of AD.

Quantitative Assessment of Cortical Atrophy

In addition to visual ratings, volumetric and voxel-based measures of brain atrophy have demonstrated close correlations with actual atrophy, neuropathological changes, and cognitive impairment (525354). Given that rates of brain atrophy have been correlated with rates of concurrent cognitive decline, quantitative measurement might serve as an accurate and reproducible surrogate for neurodegenerative pathology (55). However, the labor-intensive nature of such measurements has limited generalization to routine clinical practice (56). Consequently, recent commercial development of automated volumetric measurements of anatomical structures may prove useful in future (5758).

White Matter Hyperintensity

White matter hyperintensity (WMH) has emerged as a strong correlate of cognitive aging and AD (596061). In 1987, Fazekas et al. (62) first described WMH as a periventricular halo, punctate, or early confluent hyperintensity observed in AD. WMH later became known by other terms such as leukoaraiosis, white matter lesion, leukoencephalopathy, and white matter disease, with various definitions that have hampered the integration of previous research on risk factors, pathophysiology, pathological correlations, and clinical implications (63). Recently, the Standards for Reporting Vascular Changes on Neuroimaging (STRIVE) defined WMH as a presumed vascular-origin signal abnormality of variable size in the white matter, showing hyperintensity on T2-weighted images without cavitation, exclusive of subcortical grey matter or brainstem lesions (63).
White matter hyperintensity can be classified as smooth periventricular or irregular periventricular (located in the periventricular system) or deep white matter lesions (found in the subcortical white matter) (6465). Postmortem studies have reported that smooth periventricular WMH presents as a loosening of the fiber network with myelin loss around the tortuous venules, irregular periventricular WMH demonstrates confluent areas with fiber and myelin loss around the perivascular space with reactive gliosis, and deep WMH shows perivascular rarefaction of myelin with varying degrees of axonal loss, astrogliosis, and spongiosis (6667686970). These findings imply that smooth periventricular WMH is likely caused by altered periventricular fluid dynamics, while irregular periventricular WMH and deep WMH reflect ischemic tissue damage (677071). Recent studies have provided strong evidence that WMH plays a causative role in cognitive decline and dementia (72737475), and might lead to AD by contributing in an additive or synergistic manner to disease pathogenesis (597677).
White matter hyperintensity has been considered to be a primary pathology in subcortical ischemic vascular dementia. However, the histopathological features of WMH are also comparable with that of AD, suggesting that subcortical ischemic vascular dementia and AD may be part of a pathological continuum (7879). There are only few pure conditions of AD and subcortical ischemic vascular dementia that have been reported, and rather varying degrees of neurodegenerative and vascular pathologies comprise the spectrum of AD and vascular dementia (80). Furthermore, AD and subcortical ischemic vascular dementia share common risk factors such hypertension, atherosclerosis, diabetes, hypercholesterolemia, obesity, metabolic syndrome, and smoking (80).
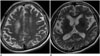
The severity of WMH can be quantified semiquantitatively or quantitatively, but a gold standard has not been established until date. The Fazekas scale is most commonly used, which distinguishes periventricular versus deep WMH and scores them according to a 4-point scale (0–3) (Fig. 8) (62). Another well-known scale is the Age-Related White Matter Changes scale, which defines WMHs as ill-defined hyperintensities ≥ 5 mm and scores them according to a 4-point scale in five different regions of each hemisphere (0–30) (81). Fazekas et al. (82) also proposed a WMH grading scale based on type, location, number, and size (0–84). Another new rating system according to the ratio of periventricular versus deep WMHs has been recently proposed by the Clinical Research for Dementia of South Korea (83). These semiquantitative scales have shown good intra-observer and inter-observer agreement and close correlations with volumetric assessments; however, they were designed to measure WMH at a single time point and are not suitable for evaluating WMH progression (848586).

Lacunes

The term "lacune" is derived from the French word for a small fluid-filled cavity, and has historically represented the late stage of a small deep brain infarct (87). The STRIVE criteria define lacunes as a "round or ovoid, subcortical, fluid-filled (similar signal as CSF) cavity measuring between 3 mm and 15 mm in diameter, consistent with a previous acute small deep brain infarct or hemorrhage in the territory of one perforating arteriole" (37). In most cases, lacunes have a CSF-like hypointensity at the center with a surrounding rim of hyperintensity on fluid-attenuated inversion recovery images, which is helpful for differentiating them from enlarged perivascular space along size (< 3 mm) and location criteria (lower basal ganglia region) (888990). Lacunes are assumed to exist as remnants of symptomatic or silent small subcortical infarcts, appearing central to the most common cause of vascular dementia (37). Though there is no consensus regarding the number or location of lacunes required for diagnosis of vascular dementia, two or more lacunes outside the brain stem are considered to be sufficient to support the diagnosis (91).
Lacunes are known to be associated with stroke and gait disturbance in elderly individuals (9293). Furthermore, patients with AD are more likely to have lacunes on MRI than individuals without dementia (7794). Previous pathological studies have also revealed that patients with lacunes are more likely to have dementia for the reason that patients with infarcts require a lower burden of plaques and tangles for clinical diagnosis of AD (959697). Moreover, the location of lacunes is an important factor in dementia, as thalamic and basal ganglia lesions are associated with poor cognition (98). The underlying mechanism relating lacunes and cognitive impairment remains unclear, and may be resultant from the coexistence of other factors such as WMH, cortical microinfarcts, or other unidentified factors (99).

Microbleeds

Microbleeds are well-known MRI expression of small vessel disease as well as lacunes and WMH. Cerebral microbleeds refer to small, round, or ovoid hypointensities, ranging 2–10 mm in diameter on T2* gradient-recall echo (GRE) or susceptibility-weighted (SWI) MR sequences, which provide a high contrast-to-noise ratio between the brain parenchyma and paramagnetic materials (100101102). Histopathological-radiological correlation studies have shown that hypointensities found on MRI correlate with areas of hemosiderin deposition with impaired vessel integrity, such as in the case of lipofibrohyalinosis or vascular Aβ deposition in patients with dementia (103104). These hypointensities can be classified into two different patterns of distribution according to their etiology and location: deep or infratentorial location with the presence of vascular risk factors (e.g., hypertension), and lobar (cortico-subcortical) location associated with APOE ɛ4 carrier status or cerebral amyloid angiopathy (CAA) (Fig. 9) (103105106).
With regard to dementia, microbleeds have drawn research attention as potential mediators of cognitive impairment. Microbleeds are more commonly found in patients with MCI, AD, and vascular dementia (107108109110). The mechanism of cognitive impairment due to microbleeds is not fully understood, but is hypothesized to be due to focal dysfunction or damage to the surrounding tissue, or due to more generalized processes such as small vessel disease or extensive CAA (103111). According to the Boston Criteria, for patients older than 55 years who present with lobar intracerebral hemorrhage, the imaging diagnosis of CAA can be made based on either MRI or CT findings: 1) probable CAA: multiple hemorrhage restricted to lobar, cortical, or cortico-subcortical regions; and 2) possible CCA: single lobar, cortical, cortico-subcortical hemorrhage (112).
Microbleeds are also frequently encountered in the context of Aβ immunotherapy for AD (amyloid-related imaging abnormalities) as an important side effect (113). For this particular immunotherapy, Food and Drug Administration guidelines recommend exclusion of patients with more than five microbleeds, which can be evidence of underlying CAA.
Reports of inter-observer agreement on the presence of microbleeds on conventional T2* GRE MR imaging are varied (κ = 0.33–0.88), likely due to detection difficulties (114). Calcification, cavernous malformations, cross-sectional pial vessels, hemorrhagic metastases, and diffusion axonal injury can mimic the appearance of microbleeds on MR imaging, such that a diagnosis should be made in the context of a patient's clinical history and with consideration of other MR sequence findings (63115). Furthermore, T2* GRE versus SWI parameters, resolution, field strength, and post-processing technique can affect the observed number of microbleeds (116117); SWI MR imaging is well-known for detection of a larger number of microbleeds than T2* GRE MR imaging as it offers higher resolution and an increased susceptibility effect (117118119). Therefore, future research should focus on the development and validation of controlled standards for the diagnosis of microbleeds in order to strengthen our understanding of their utility as risk and prognostic factors.

Cerebral Microinfarcts

Emerging evidences shows that cerebral microinfarcts are associated with cardiovascular risk factors as well as cognitive decline and dementia, particularly if they are multiple and cortical (120121). Moreover, cerebral microinfarcts can occur in cognitively normal elderly people, but the prevalence is higher in AD patients (122).
Cortical microinfarcts are defined as sharply defined microscopic regions of cellular death or tissue necrosis, ranging from 50 um to 5 mm as per histopathology studies. Recently, several studies aimed to detect microinfarcts on in vivo 7T MRI (123124). According to a previous study, a cut-off value of five microinfarcts on 7T MRI could differentiate AD and controls with sensitivity of 64.3% and specificity of 94.4% (124). When using 3T MRI, only 25% of cortical microinfarcts identified on 7T were detectable, probably due to limited spatial resolution (123). Consequently, it is necessitated to improve detection of cortical microinfarcts lesion on widely used 3T MRI by protocol optimization to reflect exact burden of microinfarcts in clinical practice.

Systematic Approach to Structural Imaging Evaluation for Differential Diagnosis of Dementia

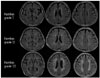
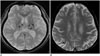
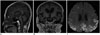
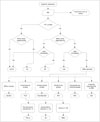
The first thing that must be determined during potential imaging diagnosis of dementia is whether the patient has any focal lesions such as those due to stroke, tumor, or vascular malformation, or if the patient has hydrocephalus (19125). Second, the presence of MTA must be determined, as MTA indicates a high probability of AD. Third, the degree of WMH and the presence of microbleeds should be assessed in order to verify AD or classify the type of dementia (vascular dementia, CAA, and other dementias). If a patient is categorized as having an "other dementia," the spatial pattern of brain atrophy must be more carefully evaluated. FTLA is indicative of FTD. If the FTLA has a right predilection, behavioral variant FTD is indicated, whereas a left predilection indicates SD. Peri-insular atrophy with a left predilection or less commonly, with a right predilection, indicates progressive non-fluent aphasia. Alternatively, presence of parieto-occipital atrophy suggests neurodegenerative diseases such as PCA, CBD, or dementia with Lewy bodies. Infratentorial atrophy with relative sparing pons and prominent atrophied midbrain is indicative of PSP (Fig. 10A) (126). The presence of brain atrophy with markedly disproportionate ventriculomegaly suggests normal pressure hydrocephalus (Fig. 10B) (127). When the cortex and basal ganglia show hyperintensity on diffusion weighted imaging (DWI), Creutzfeldt-Jakob disease is indicated (Fig. 10C) (128). A flowchart of the above approach to the imaging diagnosis of cognitively impaired patients is provided in Figure 11.

Advanced MR Sequences for Detecting Structural Abnormalities

Diffusion Tensor Imaging

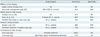
In AD, the pathological disruption of cell membranes impedes diffusion of water molecules and produces an increased mean diffusivity, while fractional anisotropy is abnormally decreased in AD and MCI patients due to the loss of tract integrity (129130131). A previous study revealed that DTI measurement can help identify patients with MCI who are likely to progress to AD (132). Moreover, various attempts have been made to assess mean diffusivity and fractional anisotropy from region of interest measurements to tract-based spatial statistics in AD (133134). Axial diffusivity and mean diffusivity are suggested to be most sensitive at detecting early changes of AD (Table 3) (134).

Quantitative Susceptibility Mapping

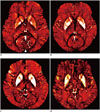
Quantitative susceptibility mapping (QSM) is an actual quantification map for local susceptibility based on multi-echo 3-dimensional GRE images. QSM can be used to evaluate iron overload potentially associated with neurodegenerative disease (135136). Iron is a known component of Aβ plaques and neurofibrillary tangles, and moreover may provide an ideal environment for Aβ aggregation and neurotoxicity (137138139). Therefore, the use of QSM to measure iron levels in vivo may offer important information to assist our understanding of the neurodegenerative sequence. Indeed, a previous study revealed that significant magnetic susceptibility differences exist in the deep brain nuclei as well as posterior grey and white matter regions of AD patients, and may be a potential biomarker for AD (140). Another study reported the increase of susceptibility (iron load) in vascular dementia as well as AD (Fig. 12) (141).

Magnetization Transfer Imaging

Magnetic transfer (MT) imaging is based on the exchange of magnetization between free protons and protons bound to macromolecules, and reflects underlying histopathological changes in advance than does conventional MRI (142143). Reduced MTR values in the hippocampus have been observed independent of atrophy in even patients with very mild AD (144), thus supporting the contention that MT imaging can detect histopathological changes preceding to obvious volumetric changes in AD. Yet, the underlying mechanism of reduced MT-derived values in the hippocampus of AD patients is not fully understood. One hypothesis is that pathological accumulations of soluble and non-soluble proteins preceding cell death lead to alterations in the local composition of macromolecules, and that the impact of these alterations on MT-derived values is thus more relevant than atrophic changes (145). However, further studies involving larger populations are required to validate the clinical utility and implications of MT imaging in patients with early AD.

Optimized MR Protocols

For the reason that most patients with suspected dementia are elderly and represent a distinct population, a tailored MRI protocol is mandatory. First, imaging markers that reflect important neurohistopathological features of AD should be included. Second, imaging markers that can be used to demonstrate functional changes related to AD should also be incorporated. Third, imaging markers must be identified and utilized to monitor the therapeutic response of AD pathology. Fourth, contrast administration should be avoided unless there are other suspicious imaging findings and MRI should be performed within proper acquisition time. Finally, considering its association with subcortical ischemic vascular dementia, the necessity of MR angiography should be revisited in elderly patients. For MR examinations of patients with suspected dementia, consistency of imaging parameters across subjects and across time are also important in terms of longitudinal follow-up and multicenter clinical trials (146147). We have provided such an MR protocol, which was initially devised for the Korea-Alzheimer Dementia Neuroimaging Initiative (K-ADNI) study by modification of ADNI protocols (Table 4) (148).

CONCLUSION

Imaging of patients with cognitive decline has clear utility not only for exclusion diagnoses but also for the differential diagnosis of neurodegenerative disorders based on specific patterns of atrophy, pathological progression over time, and even physiological changes. Radiologists should be aware of the advantages and limitations of modern imaging so that imaging protocols can be optimized for diagnostic use. Quantitative imaging analysis and diagnosis provides new field and role for radiologists.

Figures and Tables

Fig. 1

Proposed model of Alzheimer's disease pathogenesis adapted from Jack et al. Lancet Neurol 2010;9:119-128, with permission of Elsevier (8).

Aβ = β-amyloid, MCI = mild cognitive impairment, MR = magnetic resonance
kjr-17-827-g001
Fig. 2

Medial temporal lobe atrophy according to Scheltens et al. J Neurol 1995;242:557-560, with permission of Springer-Verlag 1995 (32).

kjr-17-827-g002
Fig. 3

Posterior cortical atrophy as variant of Alzheimer's dementia.

Note prominent atrophy of bilateral parietal lobe on sagittal (A) and axial (B) planes.
kjr-17-827-g003
Fig. 4

Frontotemporal lobar atrophy of behavioral variant frontotemporal dementia.

kjr-17-827-g004
Fig. 5

Bilateral prominent anterior temporal lobar atrophy of semantic variant frontotemporal dementia.

kjr-17-827-g005
Fig. 6

Bilateral asymmetric perisylvian atrophy of primary non fluent aphasia variant frontotemporal dementia.

kjr-17-827-g006
Fig. 7

Asymmetric atrophy of frontoparietal cortex (A) and basal ganglia (B) in corticobasal degeneration.

kjr-17-827-g007
Fig. 8

Classification of white matter hyperintensity according to Fazekas et al. AJR Am J Roentgenol 1987;149:351-356, with permission of ARRS (62).

kjr-17-827-g008
Fig. 9

Cerebral microbleeds exhibiting differential distribution pattern of hypertensive microangiopathy (A) and cerebral amyloid angiopathy (B).

kjr-17-827-g009
Fig. 10

Exemplary cases of other uncommon dementias for differential diagnosis of cognitive impaired subjects using structural imaging.

Progressive supranuclear palsy (A) shows typical midbrain atrophy. Normal pressure hydrocephalus (B) shows disproportionate ventricular enlargement to brain atrophy. Creutzfeldt-Jacob disease (C) shows typical cortical hyperintensities on DWI. DWI = diffusion weighted imaging
kjr-17-827-g010
Fig. 11

Algorithm for differential diagnosis of cognitive impaired subjects by employing structural imaging.

AD = Alzheimer's disease, BG = basal ganglia, CAA = cerebral amyloid angiopathy, CBD = corticobasal degeneration, CJD = Creutzfeldt–Jakob disease, DLB = dementia with Lewy bodies, DWI = diffusion weighted imaging, FTD = frontotemporal dementia, FTLD = frontotemporal lobar atrophy, MRI = magnetic resonance imaging, MTL = medial temporal lobe, NPH = normal pressure hydrocephalus, PCA = posterior cortical atrophy, PNFA = progressive nonfluent aphasia, PSP = progressive supranuclear palsy, SD = semantic dementia, VD = vascular dementia
kjr-17-827-g011
Fig. 12

Quantitative susceptibility weighted imaging of healthy control (A), age-matched healthy control (B), Alzheimer's disease patient (C), and vascular dementia patient (D).

Increased iron accumulation of caudate and putamen is noted in patients with Alzheimer's disease and vascular dementia as compared with normal subjects.
kjr-17-827-g012
Table 1

Diagnostic Sensitivities and Specificities of Visual Rating of Cortical Atrophy

kjr-17-827-i001
Study Subjects Sensitivity Specificity
Diffuse cortical atrophy
 Global cortical atrophy scale NA NA NA
 Ventricular enlargement scale (26) AD or DLB vs. controls 94% 40%
Medial temporal lobe atrophy
 Scheltens et al. (29) AD 81% NA
 Duara et al. (34) Probable AD vs. controls 85% 82%
 Modified MTA rating on axial scan (36) AD vs. controls 76% 80%
Posterior cortical atrophy
 Koedam scale (42) AD vs. controls 58% 95%
 Combined Scheltens + Koedam scale (42) AD vs. controls 73% 87%
Frontotemporal lobar atrophy
 FTLA scale (46) Semantic dementia 100% NA
 FTLA scale (46) Behavioral variant frontotemporal dementia 53% NA

AD = Alzheimer's disease, DLB = dementia with Lewy bodies, FTLA = frontotemporal lobar atrophy, MTA = medial temporal lobe atrophy, NA = not applicable

Table 2

Visual Rating of Medial Temporal Lobe Atrophy from Scheltens et al. (32)

kjr-17-827-i002
Score Width of Choroid Fissure Width of Temporal Horn Height of Hippocampal Formation
0 Normal Normal Normal
1 Normal Normal
2 ↑↑
3 ↑↑↑ ↑↑ ↓↓
4 ↑↑↑ ↑↑↑ ↓↓↓

↑ indicates increase and ↓ indicates decrease in each region.

Table 3

Diagnostic Sensitivities and Specificities of Advanced Imaging for AD

kjr-17-827-i003
Study Subjects Sensitivity Specificity
Diffusion tensor imaging
 Total hippocampal volume + FA of left posterior cingulum AD vs. controls 88% 94%
 FA AD vs. controls 86% 65%
 MD 86% 95%
 MD of hippocampus and pallidum AD vs. controls 86.7% 98.7%
Quantitative susceptibility mapping NA NA
Magnetic transfer imaging NA NA

AD = Alzheimer's disease, NA = not applicable, FA = fractional anisotropy, MD = mean diffusivity

Table 4

Suggested Imaging Protocols for Cognitively Impaired Patients in Clinical Practice and for Academic Research

kjr-17-827-i004
Protocol for Clinical Practice Protocol for Research Purpose*
3D T1-weighted images (MPRAGE) 3D (sagittal) T1-weighted images (MPRAGE)
 - Parallel imaging factor = 2  - Parallel imaging factor = 2
 - ≤ 1.2 × 1.2 × 1.2 mm, 256 mm FOV  - ≤ 1.2 × 1.2 × 1.2 mm, 256 mm FOV
2D FLAIR 3D (sagittal) FLAIR
 - 1 × 1 × 1 mm, 256 mm FOV
2D GRE (or SWI) 2D (axial) GRE or 3D (axial) SWI
 - 3 mm slice thickness
Optional: 2D T2WI, DWI, or MRA Resting state fMRI
 - TR = 2000 ms
Diffusion tensor imaging (30 directions or more)
Optional: arterial spin labeling (ASL)

*Adapted from Korea-ADNI MR protocol. DWI = diffusion weighted imaging, FLAIR = fluid-attenuated inversion recovery, fMRI = functional magnetic resonance imaging, FOV = field of view, GRE = gradient recalled echo, MPRAGE = magnetization-prepared rapid gradient-echo, MRA = magnetic resonance angiography, SWI = susceptibility-weighted imaging, T2WI = T2-weighted imaging, 2D = twodimensional, 3D = three-dimensional

Notes

This study was supported by a grant of the Korean Health Technology R&D Project, Ministry of Health & Welfare, Republic of Korea (HI12C0713) and Konkuk University.

References

1. Weiner MW, Veitch DP, Aisen PS, Beckett LA, Cairns NJ, Cedarbaum J, et al. 2014 Update of the Alzheimer's Disease Neuroimaging Initiative: a review of papers published since its inception. Alzheimers Dement. 2015; 11:e1–e120.
2. McKhann G, Drachman D, Folstein M, Katzman R, Price D, Stadlan EM. Clinical diagnosis of Alzheimer's disease: report of the NINCDS-ADRDA Work Group under the auspices of Department of Health and Human Services Task Force on Alzheimer's Disease. Neurology. 1984; 34:939–944.
3. Grundke-Iqbal I, Iqbal K, Quinlan M, Tung YC, Zaidi MS, Wisniewski HM. Microtubule-associated protein tau. A component of Alzheimer paired helical filaments. J Biol Chem. 1986; 261:6084–6608.
4. Masters CL, Simms G, Weinman NA, Multhaup G, McDonald BL, Beyreuther K. Amyloid plaque core protein in Alzheimer disease and Down syndrome. Proc Natl Acad Sci U S A. 1985; 82:4245–4249.
5. Braak H, Braak E. Neuropathological stageing of Alzheimerrelated changes. Acta Neuropathol. 1991; 82:239–259.
6. Jarrett JT, Berger EP, Lansbury PT Jr. The carboxy terminus of the beta amyloid protein is critical for the seeding of amyloid formation: implications for the pathogenesis of Alzheimer's disease. Biochemistry. 1993; 32:4693–4697.
7. Harrington CR. The molecular pathology of Alzheimer's disease. Neuroimaging Clin N Am. 2012; 22:11–22. vii
8. Jack CR Jr, Knopman DS, Jagust WJ, Shaw LM, Aisen PS, Weiner MW, et al. Hypothetical model of dynamic biomarkers of the Alzheimer's pathological cascade. Lancet Neurol. 2010; 9:119–128.
9. Braak H, Del Tredici K. The pathological process underlying Alzheimer's disease in individuals under thirty. Acta Neuropathol. 2011; 121:171–181.
10. Bloom GS. Amyloid-β and tau: the trigger and bullet in Alzheimer disease pathogenesis. JAMA Neurol. 2014; 71:505–508.
11. Petersen RC. Mild cognitive impairment as a diagnostic entity. J Intern Med. 2004; 256:183–194.
12. Roberts RO, Geda YE, Knopman DS, Cha RH, Pankratz VS, Boeve BF, et al. The Mayo Clinic Study of Aging: design and sampling, participation, baseline measures and sample characteristics. Neuroepidemiology. 2008; 30:58–69.
13. Petersen RC, Roberts RO, Knopman DS, Geda YE, Cha RH, Pankratz VS, et al. Prevalence of mild cognitive impairment is higher in men. The Mayo Clinic Study of Aging. Neurology. 2010; 75:889–897.
14. Petersen RC, Roberts RO, Knopman DS, Boeve BF, Geda YE, Ivnik RJ, et al. Mild cognitive impairment: ten years later. Arch Neurol. 2009; 66:1447–1455.
15. Jack CR Jr, Albert MS, Knopman DS, McKhann GM, Sperling RA, Carrillo MC, et al. Introduction to the recommendations from the National Institute on Aging-Alzheimer's Association workgroups on diagnostic guidelines for Alzheimer's disease. Alzheimers Dement. 2011; 7:257–262.
16. Albert MS, DeKosky ST, Dickson D, Dubois B, Feldman HH, Fox NC, et al. The diagnosis of mild cognitive impairment due to Alzheimer's disease: recommendations from the National Institute on Aging-Alzheimer's Association workgroups on diagnostic guidelines for Alzheimer's disease. Alzheimers Dement. 2011; 7:270–279.
17. Dubois B, Feldman HH, Jacova C, Hampel H, Molinuevo JL, Blennow K, et al. Advancing research diagnostic criteria for Alzheimer's disease: the IWG-2 criteria. Lancet Neurol. 2014; 13:614–629.
18. Frisoni GB, Fox NC, Jack CR Jr, Scheltens P, Thompson PM. The clinical use of structural MRI in Alzheimer disease. Nat Rev Neurol. 2010; 6:67–77.
19. Harper L, Barkhof F, Scheltens P, Schott JM, Fox NC. An algorithmic approach to structural imaging in dementia. J Neurol Neurosurg Psychiatry. 2014; 85:692–698.
20. Price JL, Davis PB, Morris JC, White DL. The distribution of tangles, plaques and related immunohistochemical markers in healthy aging and Alzheimer's disease. Neurobiol Aging. 1991; 12:295–312.
21. Jack CR Jr, Dickson DW, Parisi JE, Xu YC, Cha RH, O'Brien PC, et al. Antemortem MRI findings correlate with hippocampal neuropathology in typical aging and dementia. Neurology. 2002; 58:750–757.
22. Pasquier F, Leys D, Weerts JG, Mounier-Vehier F, Barkhof F, Scheltens P. Inter- and intraobserver reproducibility of cerebral atrophy assessment on MRI scans with hemispheric infarcts. Eur Neurol. 1996; 36:268–272.
23. Wattjes MP, Henneman WJ, van der Flier WM, de Vries O, Träber F, Geurts JJ, et al. Diagnostic imaging of patients in a memory clinic: comparison of MR imaging and 64-detector row CT. Radiology. 2009; 253:174–183.
24. Henneman WJ, Sluimer JD, Cordonnier C, Baak MM, Scheltens P, Barkhof F, et al. MRI biomarkers of vascular damage and atrophy predicting mortality in a memory clinic population. Stroke. 2009; 40:492–498.
25. Harper L, Barkhof F, Fox NC, Schott JM. Using visual rating to diagnose dementia: a critical evaluation of MRI atrophy scales. J Neurol Neurosurg Psychiatry. 2015; 86:1225–1233.
26. O'Donovan J, Watson R, Colloby SJ, Firbank MJ, Burton EJ, Barber R, et al. Does posterior cortical atrophy on MRI discriminate between Alzheimer's disease, dementia with Lewy bodies, and normal aging? Int Psychogeriatr. 2013; 25:111–119.
27. De Leon MJ, George AE, Golomb J, Tarshish C, Convit A, Kluger A, et al. Frequency of hippocampal formation atrophy in normal aging and Alzheimer's disease. Neurobiol Aging. 1997; 18:1–11.
28. Gosche KM, Mortimer JA, Smith CD, Markesbery WR, Snowdon DA. Hippocampal volume as an index of Alzheimer neuropathology: findings from the Nun Study. Neurology. 2002; 58:1476–1482.
29. Scheltens P, Leys D, Barkhof F, Huglo D, Weinstein HC, Vermersch P, et al. Atrophy of medial temporal lobes on MRI in "probable" Alzheimer's disease and normal ageing: diagnostic value and neuropsychological correlates. J Neurol Neurosurg Psychiatry. 1992; 55:967–972.
30. Vermersch P, Leys D, Scheltens P, Barkhof F. Visual rating of hippocampal atrophy: correlation with volumetry. J Neurol Neurosurg Psychiatry. 1994; 57:1015.
31. DeCarli C, Kaye JA, Horwitz B, Rapoport SI. Critical analysis of the use of computer-assisted transverse axial tomography to study human brain in aging and dementia of the Alzheimer type. Neurology. 1990; 40:872–883.
32. Scheltens P, Launer LJ, Barkhof F, Weinstein HC, van Gool WA. Visual assessment of medial temporal lobe atrophy on magnetic resonance imaging: interobserver reliability. J Neurol. 1995; 242:557–560.
33. Cavallin L, Løken K, Engedal K, Oksengård AR, Wahlund LO, Bronge L, et al. Overtime reliability of medial temporal lobe atrophy rating in a clinical setting. Acta Radiol. 2012; 53:318–323.
34. Duara R, Loewenstein DA, Potter E, Appel J, Greig MT, Urs R, et al. Medial temporal lobe atrophy on MRI scans and the diagnosis of Alzheimer disease. Neurology. 2008; 71:1986–1992.
35. Urs R, Potter E, Barker W, Appel J, Loewenstein DA, Zhao W, et al. Visual rating system for assessing magnetic resonance images: a tool in the diagnosis of mild cognitive impairment and Alzheimer disease. J Comput Assist Tomogr. 2009; 33:73–78.
36. Kim GH, Kim JE, Choi KG, Lim SM, Lee JM, Na DL, et al. T1-weighted axial visual rating scale for an assessment of medial temporal atrophy in Alzheimer's disease. J Alzheimers Dis. 2014; 41:169–178.
37. Dubois B, Feldman HH, Jacova C, Dekosky ST, Barberger-Gateau P, Cummings J, et al. Research criteria for the diagnosis of Alzheimer's disease: revising the NINCDS-ADRDA criteria. Lancet Neurol. 2007; 6:734–746.
38. Lehmann M, Koedam EL, Barnes J, Bartlett JW, Ryan NS, Pijnenburg YA, et al. Posterior cerebral atrophy in the absence of medial temporal lobe atrophy in pathologically-confirmed Alzheimer's disease. Neurobiol Aging. 2012; 33:627.e1–627.e12.
39. Josephs KA, Whitwell JL, Duffy JR, Vanvoorst WA, Strand EA, Hu WT, et al. Progressive aphasia secondary to Alzheimer disease vs FTLD pathology. Neurology. 2008; 70:25–34.
40. Whitwell JL, Jack CR Jr, Przybelski SA, Parisi JE, Senjem ML, Boeve BF, et al. Temporoparietal atrophy: a marker of AD pathology independent of clinical diagnosis. Neurobiol Aging. 2011; 32:1531–1541.
41. Frisoni GB, Pievani M, Testa C, Sabattoli F, Bresciani L, Bonetti M, et al. The topography of grey matter involvement in early and late onset Alzheimer's disease. Brain. 2007; 130(Pt 3):720–730.
42. Koedam EL, Lehmann M, van der Flier WM, Scheltens P, Pijnenburg YA, Fox N, et al. Visual assessment of posterior atrophy development of a MRI rating scale. Eur Radiol. 2011; 21:2618–2625.
43. Möller C, van der Flier WM, Versteeg A, Benedictus MR, Wattjes MP, Koedam EL, et al. Quantitative regional validation of the visual rating scale for posterior cortical atrophy. Eur Radiol. 2014; 24:397–404.
44. Broe M, Hodges JR, Schofield E, Shepherd CE, Kril JJ, Halliday GM. Staging disease severity in pathologically confirmed cases of frontotemporal dementia. Neurology. 2003; 60:1005–1011.
45. Davies RR, Kipps CM, Mitchell J, Kril JJ, Halliday GM, Hodges JR. Progression in frontotemporal dementia: identifying a benign behavioral variant by magnetic resonance imaging. Arch Neurol. 2006; 63:1627–1631.
46. Kipps CM, Davies RR, Mitchell J, Kril JJ, Halliday GM, Hodges JR. Clinical significance of lobar atrophy in frontotemporal dementia: application of an MRI visual rating scale. Dement Geriatr Cogn Disord. 2007; 23:334–342.
47. Warrington EK. The selective impairment of semantic memory. Q J Exp Psychol. 1975; 27:635–657.
48. Chan D, Fox NC, Scahill RI, Crum WR, Whitwell JL, Leschziner G, et al. Patterns of temporal lobe atrophy in semantic dementia and Alzheimer's disease. Ann Neurol. 2001; 49:433–442.
49. Kitagaki H, Hirono N, Ishii K, Mori E. Corticobasal degeneration: evaluation of cortical atrophy by means of hemispheric surface display generated with MR images. Radiology. 2000; 216:31–38.
50. Bugiani O, Constantinidis J, Ghetti B, Bouras C, Tagliavini F. Asymmetrical cerebral atrophy in Alzheimer's disease. Clin Neuropathol. 1991; 10:55–60.
51. Giannakopoulos P, Hof PR, Bouras C. Alzheimer's disease with asymmetric atrophy of the cerebral hemispheres: morphometric analysis of four cases. Acta Neuropathol. 1994; 88:440–447.
52. Whitwell JL, Josephs KA, Murray ME, Kantarci K, Przybelski SA, Weigand SD, et al. MRI correlates of neurofibrillary tangle pathology at autopsy: a voxel-based morphometry study. Neurology. 2008; 71:743–749.
53. Moon Y, Moon WJ, Kim H, Han SH. Regional atrophy of the insular cortex is associated with neuropsychiatric symptoms in Alzheimer's disease patients. Eur Neurol. 2014; 71:223–229.
54. Moon WJ, Kim HJ, Roh HG, Han SH. Atrophy measurement of the anterior commissure and substantia innominata with 3T high-resolution MR imaging: does the measurement differ for patients with frontotemporal lobar degeneration and Alzheimer disease and for healthy subjects? AJNR Am J Neuroradiol. 2008; 29:1308–1313.
55. Fox NC, Scahill RI, Crum WR, Rossor MN. Correlation between rates of brain atrophy and cognitive decline in AD. Neurology. 1999; 52:1687–1689.
56. Petrella JR. Neuroimaging and the search for a cure for Alzheimer disease. Radiology. 2013; 269:671–691.
57. Fischl B, van der Kouwe A, Destrieux C, Halgren E, Ségonne F, Salat DH, et al. Automatically parcellating the human cerebral cortex. Cereb Cortex. 2004; 14:11–22.
58. Fischl B, Salat DH, Busa E, Albert M, Dieterich M, Haselgrove C, et al. Whole brain segmentation: automated labeling of neuroanatomical structures in the human brain. Neuron. 2002; 33:341–355.
59. Brickman AM, Muraskin J, Zimmerman ME. Structural neuroimaging in Altheimer's disease: do white matter hyperintensities matter? Dialogues Clin Neurosci. 2009; 11:181–190.
60. Gunning-Dixon FM, Brickman AM, Cheng JC, Alexopoulos GS. Aging of cerebral white matter: a review of MRI findings. Int J Geriatr Psychiatry. 2009; 24:109–117.
61. Kim HJ, Moon WJ, Han SH. Differential cholinergic pathway involvement in Alzheimer's disease and subcortical ischemic vascular dementia. J Alzheimers Dis. 2013; 35:129–136.
62. Fazekas F, Chawluk JB, Alavi A, Hurtig HI, Zimmerman RA. MR signal abnormalities at 1.5 T in Alzheimer's dementia and normal aging. AJR Am J Roentgenol. 1987; 149:351–335.
63. Wardlaw JM, Smith EE, Biessels GJ, Cordonnier C, Fazekas F, Frayne R, et al. Neuroimaging standards for research into small vessel disease and its contribution to ageing and neurodegeneration. Lancet Neurol. 2013; 12:822–838.
64. Galluzzi S, Lanni C, Pantoni L, Filippi M, Frisoni GB. White matter lesions in the elderly: pathophysiological hypothesis on the effect on brain plasticity and reserve. J Neurol Sci. 2008; 273:3–9.
65. Kanekar S, Poot JD. Neuroimaging of vascular dementia. Radiol Clin North Am. 2014; 52:383–401.
66. Fazekas F, Kleinert R, Offenbacher H, Schmidt R, Kleinert G, Payer F, et al. Pathologic correlates of incidental MRI white matter signal hyperintensities. Neurology. 1993; 43:1683–1689.
67. Chimowitz MI, Estes ML, Furlan AJ, Awad IA. Further observations on the pathology of subcortical lesions identified on magnetic resonance imaging. Arch Neurol. 1992; 49:747–752.
68. Munoz DG, Hastak SM, Harper B, Lee D, Hachinski VC. Pathologic correlates of increased signals of the centrum ovale on magnetic resonance imaging. Arch Neurol. 1993; 50:492–497.
69. Bronge L, Bogdanovic N, Wahlund LO. Postmortem MRI and histopathology of white matter changes in Alzheimer brains. A quantitative, comparative study. Dement Geriatr Cogn Disord. 2002; 13:205–212.
70. Scarpelli M, Salvolini U, Diamanti L, Montironi R, Chiaromoni L, Maricotti M. MRI and pathological examination of post-mortem brains: the problem of white matter high signal areas. Neuroradiology. 1994; 36:393–398.
71. Marshall VG, Bradley WG Jr, Marshall CE, Bhoopat T, Rhodes RH. Deep white matter infarction: correlation of MR imaging and histopathologic findings. Radiology. 1988; 167:517–522.
72. Leys D, Bombois S. White matter hyperintensities: a target for the prevention of cognitive decline? J Neurol Neurosurg Psychiatry. 2005; 76:1185–1186.
73. Garde E, Lykke Mortensen E, Rostrup E, Paulson OB. Decline in intelligence is associated with progression in white matter hyperintensity volume. J Neurol Neurosurg Psychiatry. 2005; 76:1289–1291.
74. De Groot JC, De Leeuw FE, Oudkerk M, Van Gijn J, Hofman A, Jolles J, et al. Periventricular cerebral white matter lesions predict rate of cognitive decline. Ann Neurol. 2002; 52:335–341.
75. Prins ND, van Dijk EJ, den Heijer T, Vermeer SE, Jolles J, Koudstaal PJ, et al. Cerebral small-vessel disease and decline in information processing speed, executive function and memory. Brain. 2005; 128(Pt 9):2034–2041.
76. Brickman AM, Zahodne LB, Guzman VA, Narkhede A, Meier IB, Griffith EY, et al. Reconsidering harbingers of dementia: progression of parietal lobe white matter hyperintensities predicts Alzheimer's disease incidence. Neurobiol Aging. 2015; 36:27–32.
77. Vermeer SE, Prins ND, den Heijer T, Hofman A, Koudstaal PJ, Breteler MM. Silent brain infarcts and the risk of dementia and cognitive decline. N Engl J Med. 2003; 348:1215–1222.
78. Fernando MS, Simpson JE, Matthews F, Brayne C, Lewis CE, Barber R, et al. White matter lesions in an unselected cohort of the elderly: molecular pathology suggests origin from chronic hypoperfusion injury. Stroke. 2006; 37:1391–1398.
79. Englund E. Neuropathology of white matter changes in Alzheimer's disease and vascular dementia. Dement Geriatr Cogn Disord. 1998; 9:Suppl 1. 6–12.
80. Kalaria RN, Akinyemi R, Ihara M. Does vascular pathology contribute to Alzheimer changes? J Neurol Sci. 2012; 322:141–147.
81. Wahlund LO, Barkhof F, Fazekas F, Bronge L, Augustin M, Sjögren M, et al. A new rating scale for age-related white matter changes applicable to MRI and CT. Stroke. 2001; 32:1318–1322.
82. Fazekas F, Barkhof F, Wahlund LO, Pantoni L, Erkinjuntti T, Scheltens P, et al. CT and MRI rating of white matter lesions. Cerebrovasc Dis. 2002; 13:Suppl 2. 31–36.
83. Noh Y, Lee Y, Seo SW, Jeong JH, Choi SH, Back JH, et al. A new classification system for ischemia using a combination of deep and periventricular white matter hyperintensities. J Stroke Cerebrovasc Dis. 2014; 23:636–642.
84. Kapeller P, Barber R, Vermeulen RJ, Adèr H, Scheltens P, Freidl W, et al. Visual rating of age-related white matter changes on magnetic resonance imaging: scale comparison, interrater agreement, and correlations with quantitative measurements. Stroke. 2003; 34:441–445.
85. Prins ND, van Straaten EC, van Dijk EJ, Simoni M, van Schijndel RA, Vrooman HA, et al. Measuring progression of cerebral white matter lesions on MRI: visual rating and volumetrics. Neurology. 2004; 62:1533–1539.
86. Gouw AA, van der Flier WM, van Straaten EC, Pantoni L, Bastos-Leite AJ, Inzitari D, et al. Reliability and sensitivity of visual scales versus volumetry for evaluating white matter hyperintensity progression. Cerebrovasc Dis. 2008; 25:247–253.
87. Fisher CM. Lacunar infarcts-a review. Cerebrovasc Dis. 1991; 1:311–320.
88. Kovács KR, Czuriga D, Bereczki D, Bornstein NM, Csiba L. Silent brain infarction--a review of recent observations. Int J Stroke. 2013; 8:334–347.
89. Bokura H, Kobayashi S, Yamaguchi S. Distinguishing silent lacunar infarction from enlarged Virchow-Robin spaces: a magnetic resonance imaging and pathological study. J Neurol. 1998; 245:116–122.
90. Jungreis CA, Kanal E, Hirsch WL, Martinez AJ, Moossy J. Normal perivascular spaces mimicking lacunar infarction: MR imaging. Radiology. 1988; 169:101–104.
91. Sachdev P, Kalaria R, O'Brien J, Skoog I, Alladi S, Black SE, et al. Diagnostic criteria for vascular cognitive disorders: a VASCOG statement. Alzheimer Dis Assoc Disord. 2014; 28:206–218.
92. Choi P, Ren M, Phan TG, Callisaya M, Ly JV, Beare R, et al. Silent infarcts and cerebral microbleeds modify the associations of white matter lesions with gait and postural stability: population-based study. Stroke. 2012; 43:1505–1510.
93. Vermeer SE, Hollander M, van Dijk EJ, Hofman A, Koudstaal PJ, Breteler MM. Rotterdam Scan Study. Silent brain infarcts and white matter lesions increase stroke risk in the general population: the Rotterdam Scan Study. Stroke. 2003; 34:1126–1129.
94. Barber R, Scheltens P, Gholkar A, Ballard C, McKeith I, Ince P, et al. White matter lesions on magnetic resonance imaging in dementia with Lewy bodies, Alzheimer's disease, vascular dementia, and normal aging. J Neurol Neurosurg Psychiatry. 1999; 67:66–72.
95. Jellinger KA, Mitter-Ferstl E. The impact of cerebrovascular lesions in Alzheimer disease--a comparative autopsy study. J Neurol. 2003; 250:1050–1055.
96. Neuropathology Group. Medical Research Council Cognitive Function and Aging Study. Pathological correlates of late-onset dementia in a multicentre, community-based population in England and Wales. Neuropathology Group of the Medical Research Council Cognitive Function and Ageing Study (MRC CFAS). Lancet. 2001; 357:169–175.
97. Snowdon DA, Greiner LH, Mortimer JA, Riley KP, Greiner PA, Markesbery WR. Brain infarction and the clinical expression of Alzheimer disease. The Nun Study. JAMA. 1997; 277:813–817.
98. Gold G, Kövari E, Herrmann FR, Canuto A, Hof PR, Michel JP, et al. Cognitive consequences of thalamic, basal ganglia, and deep white matter lacunes in brain aging and dementia. Stroke. 2005; 36:1184–1188.
99. Vermeer SE, Longstreth WT Jr, Koudstaal PJ. Silent brain infarcts: a systematic review. Lancet Neurol. 2007; 6:611–619.
100. Yates PA, Villemagne VL, Ellis KA, Desmond PM, Masters CL, Rowe CC. Cerebral microbleeds: a review of clinical, genetic, and neuroimaging associations. Front Neurol. 2014; 4:205.
101. Akter M, Hirai T, Hiai Y, Kitajima M, Komi M, Murakami R, et al. Detection of hemorrhagic hypointense foci in the brain on susceptibility-weighted imaging clinical and phantom studies. Acad Radiol. 2007; 14:1011–1019.
102. Atlas SW, Mark AS, Grossman RI, Gomori JM. Intracranial hemorrhage: gradient-echo MR imaging at 1.5 T. Comparison with spin-echo imaging and clinical applications. Radiology. 1988; 168:803–807.
103. Fazekas F, Kleinert R, Roob G, Kleinert G, Kapeller P, Schmidt R, et al. Histopathologic analysis of foci of signal loss on gradient-echo T2*-weighted MR images in patients with spontaneous intracerebral hemorrhage: evidence of microangiopathy-related microbleeds. AJNR Am J Neuroradiol. 1999; 20:637–664.
104. Shoamanesh A, Kwok CS, Benavente O. Cerebral microbleeds: histopathological correlation of neuroimaging. Cerebrovasc Dis. 2011; 32:528–534.
105. Poels MM, Vernooij MW, Ikram MA, Hofman A, Krestin GP, van der Lugt A, et al. Prevalence and risk factors of cerebral microbleeds: an update of the Rotterdam scan study. Stroke. 2010; 41:10 Suppl. S103–S106.
106. Vernooij MW, van der Lugt A, Ikram MA, Wielopolski PA, Niessen WJ, Hofman A, et al. Prevalence and risk factors of cerebral microbleeds: the Rotterdam Scan Study. Neurology. 2008; 70:1208–1214.
107. Pettersen JA, Sathiyamoorthy G, Gao FQ, Szilagyi G, Nadkarni NK, St George-Hyslop P, et al. Microbleed topography, leukoaraiosis, and cognition in probable Alzheimer disease from the Sunnybrook dementia study. Arch Neurol. 2008; 65:790–795.
108. Seo SW, Lee BH, Kim EJ, Chin J, Cho YS, Yoon U, et al. Clinical significance of microbleeds in subcortical vascular dementia. Stroke. 2007; 38:1949–1951.
109. Goos JD, Teunissen CE, Veerhuis R, Verwey NA, Barkhof F, Blankenstein MA, et al. Microbleeds relate to altered amyloid-β metabolism in Alzheimer's disease. Neurobiol Aging. 2012; 33:1011.e1–1011.e9.
110. Haller S, Bartsch A, Nguyen D, Rodriguez C, Emch J, Gold G, et al. Cerebral microhemorrhage and iron deposition in mild cognitive impairment: susceptibility-weighted MR imaging assessment. Radiology. 2010; 257:764–773.
111. Werring DJ, Gregoire SM, Cipolotti L. Cerebral microbleeds and vascular cognitive impairment. J Neurol Sci. 2010; 299:131–135.
112. Knudsen KA, Rosand J, Karluk D, Greenberg SM. Clinical diagnosis of cerebral amyloid angiopathy: validation of the Boston criteria. Neurology. 2001; 56:537–539.
113. Barakos J, Sperling R, Salloway S, Jack C, Gass A, Fiebach JB, et al. MR imaging features of amyloid-related imaging abnormalities. AJNR Am J Neuroradiol. 2013; 34:1958–1965.
114. Cordonnier C, Potter GM, Jackson CA, Doubal F, Keir S, Sudlow CL, et al. Improving interrater agreement about brain microbleeds: development of the Brain Observer MicroBleed Scale (BOMBS). Stroke. 2009; 40:94–99.
115. Greenberg SM, Vernooij MW, Cordonnier C, Viswanathan A, Al-Shahi Salman R, Warach S, et al. Cerebral microbleeds: a guide to detection and interpretation. Lancet Neurol. 2009; 8:165–174.
116. Vernooij MW, Ikram MA, Wielopolski PA, Krestin GP, Breteler MM, van der Lugt A. Cerebral microbleeds: accelerated 3D T2*-weighted GRE MR imaging versus conventional 2D T2*-weighted GRE MR imaging for detection. Radiology. 2008; 248:272–277.
117. Nandigam RN, Viswanathan A, Delgado P, Skehan ME, Smith EE, Rosand J, et al. MR imaging detection of cerebral microbleeds: effect of susceptibility-weighted imaging, section thickness, and field strength. AJNR Am J Neuroradiol. 2009; 30:338–343.
118. Ayaz M, Boikov AS, Haacke EM, Kido DK, Kirsch WM. Imaging cerebral microbleeds using susceptibility weighted imaging: one step toward detecting vascular dementia. J Magn Reson Imaging. 2010; 31:142–148.
119. Cheng AL, Batool S, McCreary CR, Lauzon ML, Frayne R, Goyal M, et al. Susceptibility-weighted imaging is more reliable than T2*-weighted gradient-recalled echo MRI for detecting microbleeds. Stroke. 2013; 44:2782–2278.
120. Smith EE, Schneider JA, Wardlaw JM, Greenberg SM. Cerebral microinfarcts: the invisible lesions. Lancet Neurol. 2012; 11:272–282.
121. Brayne C, Richardson K, Matthews FE, Fleming J, Hunter S, Xuereb JH, et al. Neuropathological correlates of dementia in over-80-year-old brain donors from the population-based Cambridge city over-75s cohort (CC75C) study. J Alzheimers Dis. 2009; 18:645–658.
122. Brundel M, de Bresser J, van Dillen JJ, Kappelle LJ, Biessels GJ. Cerebral microinfarcts: a systematic review of neuropathological studies. J Cereb Blood Flow Metab. 2012; 32:425–436.
123. van Veluw SJ, Zwanenburg JJ, Engelen-Lee J, Spliet WG, Hendrikse J, Luijten PR, et al. In vivo detection of cerebral cortical microinfarcts with high-resolution 7T MRI. J Cereb Blood Flow Metab. 2013; 33:322–329.
124. van Rooden S, Goos JD, van Opstal AM, Versluis MJ, Webb AG, Blauw GJ, et al. Increased number of microinfarcts in Alzheimer disease at 7-T MR imaging. Radiology. 2014; 270:205–211.
125. Haller S, Garibotto V, Kövari E, Bouras C, Xekardaki A, Rodriguez C, et al. Neuroimaging of dementia in 2013: what radiologists need to know. Eur Radiol. 2013; 23:3393–3404.
126. Quattrone A, Nicoletti G, Messina D, Fera F, Condino F, Pugliese P, et al. MR imaging index for differentiation of progressive supranuclear palsy from Parkinson disease and the Parkinson variant of multiple system atrophy. Radiology. 2008; 246:214–221.
127. Sasaki M, Honda S, Yuasa T, Iwamura A, Shibata E, Ohba H. Narrow CSF space at high convexity and high midline areas in idiopathic normal pressure hydrocephalus detected by axial and coronal MRI. Neuroradiology. 2008; 50:117–122.
128. Kandiah N, Tan K, Pan AB, Au WL, Venketasubramanian N, Tchoyoson Lim CC, et al. Creutzfeldt-Jakob disease: which diffusion-weighted imaging abnormality is associated with periodic EEG complexes? J Neurol. 2008; 255:1411–1414.
129. Jack CR Jr. Alzheimer disease: new concepts on its neurobiology and the clinical role imaging will play. Radiology. 2012; 263:344–361.
130. Zhang Y, Schuff N, Jahng GH, Bayne W, Mori S, Schad L, et al. Diffusion tensor imaging of cingulum fibers in mild cognitive impairment and Alzheimer disease. Neurology. 2007; 68:13–19.
131. Agosta F, Pievani M, Sala S, Geroldi C, Galluzzi S, Frisoni GB, et al. White matter damage in Alzheimer disease and its relationship to gray matter atrophy. Radiology. 2011; 258:853–863.
132. Kantarci K, Petersen RC, Boeve BF, Knopman DS, Weigand SD, O'Brien PC, et al. DWI predicts future progression to Alzheimer disease in amnestic mild cognitive impairment. Neurology. 2005; 64:902–904.
133. Fellgiebel A, Müller MJ, Wille P, Dellani PR, Scheurich A, Schmidt LG, et al. Color-coded diffusion-tensor-imaging of posterior cingulate fiber tracts in mild cognitive impairment. Neurobiol Aging. 2005; 26:1193–1198.
134. Moon Y, Moon WJ, Kwon H, Lee JM, Han SH. Vitamin D deficiency disrupts neuronal integrity in cognitively impaired patients. J Alzheimers Dis. 2015; 45:1089–1096.
135. Ke Y, Ming Qian Z. Iron misregulation in the brain: a primary cause of neurodegenerative disorders. Lancet Neurol. 2003; 2:246–253.
136. Moon WJ, Kim HJ, Roh HG, Choi JW, Han SH. Fluid-attenuated inversion recovery hypointensity of the pulvinar nucleus of patients with Alzheimer disease: its possible association with iron accumulation as evidenced by the t2(*) map. Korean J Radiol. 2012; 13:674–668.
137. Connor JR, Menzies SL, St Martin SM, Mufson EJ. A histochemical study of iron, transferrin, and ferritin in Alzheimer's diseased brains. J Neurosci Res. 1992; 31:75–83.
138. Good PF, Perl DP, Bierer LM, Schmeidler J. Selective accumulation of aluminum and iron in the neurofibrillary tangles of Alzheimer's disease: a laser microprobe (LAMMA) study. Ann Neurol. 1992; 31:286–292.
139. Leskovjan AC, Kretlow A, Lanzirotti A, Barrea R, Vogt S, Miller LM. Increased brain iron coincides with early plaque formation in a mouse model of Alzheimer's disease. Neuroimage. 2011; 55:32–38.
140. Acosta-Cabronero J, Williams GB, Cardenas-Blanco A, Arnold RJ, Lupson V, Nestor PJ. In vivo quantitative susceptibility mapping (QSM) in Alzheimer's disease. PLoS One. 2013; 8:e81093.
141. Moon Y, Han SH, Moon WJ. Patterns of brain iron accumulation in vascular dementia and Alzheimer's dementia using quantitative susceptibility mapping imaging. J Alzheimers Dis. 2016; 51:737–745.
142. Ramani A, Jensen JH, Helpern JA. Quantitative MR imaging in Alzheimer disease. Radiology. 2006; 241:26–44.
143. Moon WJ, Park JY, Yun WS, Jeon JY, Moon YS, Kim H, et al. A comparison of substantia nigra T1 hyperintensity in Parkinson's disease dementia, Alzheimer's disease and age-matched controls: volumetric analysis of neuromelanin imaging. Korean J Radiol. 2016; 17:633–640.
144. Hanyu H, Asano T, Iwamoto T, Takasaki M, Shindo H, Abe K. Magnetization transfer measurements of the hippocampus in patients with Alzheimer's disease, vascular dementia, and other types of dementia. AJNR Am J Neuroradiol. 2000; 21:1235–1242.
145. Wiest R, Burren Y, Hauf M, Schroth G, Pruessner J, Zbinden M, et al. Classification of mild cognitive impairment and Alzheimer disease using model-based MR and magnetization transfer imaging. AJNR Am J Neuroradiol. 2013; 34:740–746.
146. Kim SJ, Choi CG, Kim JK, Yun SC, Jahng GH, Jeong HK, et al. Effects of MR parameter changes on the quantification of diffusion anisotropy and apparent diffusion coefficient in diffusion tensor imaging: evaluation using a diffusional anisotropic phantom. Korean J Radiol. 2015; 16:297–303.
147. Yao X, Yu T, Liang B, Xia T, Huang Q, Zhuang S. Effect of increasing diffusion gradient direction number on diffusion tensor imaging fiber tracking in the human brain. Korean J Radiol. 2015; 16:410–418.
148. Jack CR Jr, Bernstein MA, Fox NC, Thompson P, Alexander G, Harvey D, et al. The Alzheimer's disease neuroimaging initiative (ADNI): MRI methods. J Magn Reson Imaging. 2008; 27:685–691.
TOOLS
Similar articles