

 PDF
PDF ePub
ePub Citation
 Print
Print


INTRODUCTION
Human mesenchymal stem cell (hMSC) is one of minor populated adult stem cells in bone marrow, which can differentiate into adipocytes, chondrocytes, and osteocytes under controlled in vivo and in vitro environments. In comparison to embryonic stem cell, hMSC has advantages of easy isolation and a lesser degree of ethical concern. Based on these advantages, hMSC has been known to be a promising treatment option for various organ diseases and injuries (1, 2).
In order to evaluate the effect of stem cell treatment, it is important to investigate the efficacy of stem cell delivery and to trace the route of stem cell migration. Although MRI does not provide the necessary sensitivity and contrast for imaging at cellular level, the endocytosis of magnetic labels allows cells to be tracked and localized (3). The intracellular confinement of superparamagnetic iron oxide (SPIO) particles induces a high susceptibility difference between the cells and the surrounding medium; the cells become detectable on the image as they appear as hyposignals that are much larger than the true cell size (4). The sensitivity of cellular MRI mainly depends on the content and relaxivity of iron loaded in cells. To enhance labeling of hMSCs with iron, transfection agents such as protamine sulfate (PS) or poly-L-lysine (PLL) are used. For labeling efficiency of PS and PLL, Arbab et al. (5) reported that magnetic labeling of cells with SPIO-PS complexes is comparable or superior to other SPIO-transfection agent complexes, and iron incorporation into cells were similar to quantities incorporated after labeling with SPIO-PLL. However, their results were not further studies by other researchers.
Along with the content and relaxivity of loaded iron, imaging protocol is important for localization and tracking with cellular MRI, which has been widely investigated in vitro and in vivo by many researchers (3, 6-11). To enable future clinical application and accurate assessment of stem cell therapy, it is a important to develop and optimize methods for a qualitative and a quantitative analytic tool using MRI in vitro and in vivo. Therefore, the purpose of this study was to assess the feasibility of a quantitative analytic tool based on MRI for quantification of intracellular iron content with a reference standard of colorimetric assay.
MATERIALS AND METHODS
Cell Labeling with SPIO
hMSCs (Ronza, Baltimore, MD, USA) in standard culture media (Mesenchymal stem cell growth medium; Ronza, Baltimore, MD, USA) were incubated in a 100 mm culture dish with 5% CO2 at 37℃. hMSCs were labeled by a commercially available ferumoxides suspension (SPIO; Feridex IV; Berlex Laboratories, Wayne, NJ, USA; 11.2 mg/mL) with PLL or PS as a transfection agent. For comparison, control hMSCs were incubated without SPIO and transfection agents, while the others were with 50 µgFe/mL of SPIO and a different concentration of PLL (1.5 µg/mL and 2 µg/mL) or PS (10 µg/mL and 15 µg/mL), respectively.
In our preliminary study, labeling with high molecular PLL (> 300 kDa) shows severe SPIO aggregation around the cells, while low molecular PLL (1-4 kDa) presented significant lower labeling efficacy (not published). Therefore, moderate molecular weight PLL (4-15 kDa; Sigma, P6516) was used for this experiment (Fig. 1).
A stock of PLL solution prepared at 5 mg/mL was diluted to the concentration of 1 mg/mL with sterile distilled water and put into a mixing tube with 2 different concentrations (1.5 µg/mL and 2 µg/mL). SPIO at a concentration of 50 µgFe/mL and serum-free DMEM medium was added continuously and mixed in a rotating shaker for 1 hr in 4℃ cold room. The solution containing PLL-SPIO complex after adding the equal volume of serum containing medium applied to the hMSC culture dish and incubated for 24 hr. After incubation, the cells were washed 3 times with sterile phosphate-buffered saline (PBS).
Commercially available PS solution (Sigma, P4020) was diluted to the concentration of 1 mg/mL with distilled water and separated into a mixing tube with 2 different concentrations (10 µg/mL and 15 µg/mL). SPIO at a concentration of 50 µgFe/mL was added into the mixing tube containing serum-free DMEM medium was then shaken intermittently by hand for 5 min. After 5 min, an equal volume of serum containing medium was added to the solution, applied to hMSCs culture dish, and then incubated for 24 hr. After incubation, the cells were washed twice with sterile PBS containing heparin (10 U/mL) to dissolve the unlabeled extracellular SPIO-PS complexes, and once with natural PBS.
Labeling efficiency was determined by Prussian blue staining immediately, 4 d (second subculture) and 8 d (third subculture) after labeling in all of the samples. After incubation with SPIO and various concentration of PLL or PS, cells were detached with 0.25% trypsin-EDTA and cytosmeared to a slide glass at × 300 g for 8 min. For Prussian blue staining, the attached cells were incubated with 10% potassium ferrocyanide in 20% hydrochloric acid and then counter-stained with nuclear fast red for 5 min. Stained slides were reviewed by Olympus microscope at × 400 magnification using DP controller/manager software. Each experiment was repeated 3 times.
Cellular Viability, Proliferation and Apoptosis
To assess viability and proliferation of labeled hMSCs, Alamar Blue assay (Biosource, Camarillo, CA, USA) was performed at immediate (at first subculture), 4 d (at second subculture) and 8 d (at third subculture) after labeling for each subset. Alamar Blue is a sodium salt of resazurin, which is a blue dye as an indicator for cell viability. Dark blue colored resazurin is reduced to bright pink colored, fluorescent compound in the presence of live cells. The cells growing in 60 mm culture dishes were trypsinized and collected. One tenth volume of total cells in 100 µL complete medium was seeded in 96-well plate and then 10 µL Alamar Blue dye was added to each well. The color changes were measured at a wavelength of 570 nm and 600 nm following incubation for 8 h. Percent reduction of Alamar Blue of each sample was calculated.
The number of cells undergoing apoptosis was determined by Annexin-V-FITC apoptosis detection kit I (BD Pharmagen™, Franklin Lakes, NJ, USA) using fluorescent-activated cell sorter immediately (at first subculture) and 4 d (at second subculture) after cell labeling. The 1 × 10⁶ labeled cells were collected and suspended in 100 µL of 1X Binding Buffer. The suspension was added by 5 µL of propidium iodide (PI) and 5 µL of Annexin-V-FITC and incubated in the dark for 15 min at room temperature. After adding 400 µL of 1X Binding Buffer, the percent of dead cells and cells undergoing apoptosis were determined by flow cytometry. The annexin-V+/PI- was judged as early apoptosis, and annexin-V+/PI+, as late apoptosis. Under the hypothesis that the transition from annexin-V-/PI- to annexin-V+/PI- was due to the labeling process, the percent differences of annexin-V+/PI- between control (no labeling sample) and each SPIO labeled samples were used for the indicator of the cytotoxicity.
For assessment of ROS, collected cells were resuspended in prewarmed PBS at 1 × 10⁶ cells/100 µL. The intracellular formation of ROS was detected by CM-H2DCFDA (Molecular Probes, Eugene, OR, USA). CM-H2DCFDA is a nonfluorescent agent that forms fluorescent esters when it is reacted with ROS inside cells. CM-H2DCFDA dye was added at a final concentration of 20 µM and the cells were incubated for 30 min at 37℃. The intensity of transformed fluorescent indicators, which is proportionate to the cytotoxicity, was analyzed by a fluorescent activated cell sorter immediately.
All of the above experiments were repeated in 3 times for statistical analysis.
Cellular Differentiation into Mesenchymal Lineage
To evaluate the capability of cellular differentiation, the labeled and non-labeled cells at different concentration of PS and PLL were tested immediately and 4 d after labeling. For osteogenic differentiation, labeled cells with concentrations of 15 µg/mL PS and 2 µg/mL PLL were plated to 6 well plate at a number of 3 × 10⁴ (3.1 × 10³/cm2). Unlabeled cells were prepared in the same way, one for negative control without induction of differentiation and the other for positive control. After allowing the cells to adhere for 12 h in growth medium, osteogenesis was induced by replacing the media with a commercialized osteogenic medium (Ronza, Baltimore, MD, USA), which was replaced with fresh osteogenic medium every 3-4 d until cellular morphology changed into cuboidal shape or delamination occurred indicating calcium deposition. Cultured cells were fixed and stained with 40 mM Alizarin red S for 10 min to detect calcium to assay the osteogenesis.
Labeled subsets identical to the above experiment for osteogenesis were plated to 6 well plate with the different seeding density at a number of 1.92 × 10⁵ (2 × 10⁴/cm2) and cultured 48 hours until the cultures reached confluence. At 100% confluence, adipogenic differentiation was induced by 3 cycles of induction and maintenance. Each cycle consisted of 3-day culture with supplemented adipogenesis induction medium (37℃, 5% CO2) and following 2-day culture with supplemented adipogenic maintenance medium. The difference of induction medium lied on the addition of dexamethasone, indomethacin and IBMX (Cambrex, Baltimore, MD, USA) to the maintenance medium. After completion of 3 cycles, the cells were cultured for 7 more days in the maintenance medium. Then, cells were fixed and stained with Oil Red O to detect lipid vacuoles to assess the adipogenesis.
Iron Concentration by Colorimetric Assay
First, a calibration curve using Prussian blue colorimetric assay was plotted from different concentrations of SPIO ranging from 0.175 to 11.2 µg/200 µL, which yielded an equation using linear regression analysis. To exclude the optical density measured by the cells themselves, not intracellular iron particles, 3 × 10⁵ cells (the same number of cells with test samples) were added to each well. 3 × 10⁵ of cells immediately after labeling suspended in 100 µL of were poured in 96-well plate. Then, the equal amount of 10% of potassium ferrocyanide and 20% of hydrochloric acid were added to the wells. The optical density of the wells was read 15 min later at the 650 nm wavelength. The SPIO concentrations per each well were calculated from the equation from the calibration curve. Finally, the SPIO concentration for each cell was figured out by dividing the total SPIO concentration by total cell number per well.
Cellular Magnetic Resonance Imaging
MRI was performed with a 4.7-T magnetic resonance (MR) scanner (Biospec; Bruker Biospin, Billerica, MA, USA) using a quadrature volume coil (diameter, 75 mm). The multi-echo gradient echo T2* sequence was used for quantitative T2* mapping with 50 echoes from 3.2 msec to 225 msec (repetition time = 5000 msec; flip angle, 30°). Images were obtained with a matrix size of 128 × 128, one measurement, slice thickness of 2 mm, slice number of 3 and field of view of 50 × 50 mm. The scan time was 8 min.
For quantification of intracellular iron, 3.0 × 10⁶ labeled cells using SPIO-PS or SPIO-PLL complexes at day 0 were trypsinized, collected and resuspended in 750 µL of PBS and mixed with the prewarmed 750 µL of 1% agarose solution in Eppendorf tubes. For MR imaging of the labeled cells at day 4, 1.5 × 10⁷ cells in 500 µL of PBS were collected to the Eppendorf tubes containing prewarmed 500 µL of 1% agarose solution. For each experiment, a calibration curves were plotted from 5 different concentrations of the SPIO agarose phantoms ranging from 0.39 to 6.25 µgFe in 1000 µL mixed with the same number of unlabeled hMSCs. All of the samples were imaged with MRI scanner using the MR parameters described above.
After T2* imaging of the SPIO agarose phantoms and the labeled cells mixed with agarose within Eppendorf tubes, the imaging data were transferred to a personal computer to obtain T2* values with a commercial software (Origin® 7.5, OriginLab Corp.), by performing fitting of the 50 echo images to a monoexponential decay as a function of echo time. Using the software, one of the authors measured T2* values of each samples by manual drawing of region-of-interests on the T2* images of the samples. After obtaining a regression equation from the data of the SPIO phantoms, the iron concentration of the labeled cells were also calculated, which were correlated with the results of Prussian blue colorimetric assay.
Statistic Analysis
All of the experiments were independently repeated in 3 times and the results were presented as an average ± standard deviation. Values for evaluation of cellular viability (Alamar Blue) and ROS generation were expressed as a percentage compared to unlabeled control and apoptosis detection was showed as the percentage of annexin-V+/PI-. ROS generation and SPIO contents per cell by colorimetry were presented as absolute values. To discriminate the significant differences among the groups Kruskal-Wallis were performed. Less than 0.05 of p-value considered to indicate a significant difference.
RESULTS
Cell Labeling
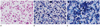
Prussian blue staining of SPIO-labeled hMSCs by PS or PLL demonstrated 100% of labeling efficiencies by both of 2 different concentrations of PLL and PS, respectively. In case of PLL, small amount of SPIO-PLL complexes proportionate to the PLL concentration were observed around the cells, which completely disappeared at the second subculture (Fig. 2). However, the amount of Prussian blue stained SPIO was markedly decreased by repeated subcultures (at day 8) within the hMSCs labeled either by SPIO-PS or SPIO-PLL complexes.
Cellular Viability, Proliferation and Apoptosis
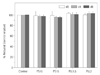
The viability and proliferating ability of SPIO-PS/PLL labeled cells at a different concentration expressed as a percentage of control unlabeled cells by Alamar Blue assay. The results of 3 independent experiments were presented in Fig. 3.
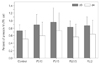
The generation of ROS in the labeled cells was expressed as a percentage of the control cells immediately and 4-d after labeling (Fig. 4). Although there was a tendency toward higher ROS production in the labeled hMSCs, there was no significant increase in ROS production compared with the control immediately and 4-d after labeling.
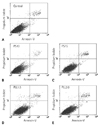
The results of flow cytometry of the proportion of apoptotic and dead cells in the labeled and non-labeled hMSCs immediately and 4-d after labeling are shown in Figs. 5 and 6. There is no significant increase in the number of apoptotic or dead cells as compared with the number of apoptotic or dead control cells at the different time points.
Cellular Differentiation into Mesenchymal Lineage
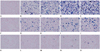
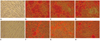
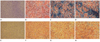
The capacity of hMSCs to differentiate into osteogenic and adipogenic cells were determined by histologic examination after induction of differentiation. There was no inhibition to osteogenic and adipogenic differentiation when labeled by SPIO-PS (50 µg/mL of SPIO; 15 µg/mL of PS) or SPIO-PLL (50 µg/mL of SPIO; 2.0 µg/mL of PLL) complexes (Figs. 7, 8). The capacity to differentiate into osteogenic and adipogenic cells were preserved not only immediately (at the first subculture), but 4 d (at the second subculture) after labeling.
Iron Concentration by In Vitro Colorimetric Assay
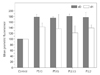
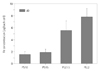
The iron contents per the labeled cells were significantly different according to the transfection agents used for labeling. The iron contents labeled by PLL were significantly higher than those by PS. In case of concentration, there was no significant difference in the iron contents according to the 2 different concentrations of PS (1.97 ± 0.476 pg/cell vs. 2.31 ± 0.536 pg/cell, p-value > 0.05). However, the iron content was significantly higher for the labeled cells by 2.0 µg/mL of PLL than those by 1.5 µg/mL of PLL (8.22 ± 1.443 pg/cell vs. 5.98 ± 1.552 pg/cell, p-value < 0.05) (Fig. 9).
Cellular MR Imaging
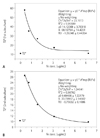
From the calibration curves plotted from the SPIO agarose phantoms mixed with unlabeled cells yielded equations by linear regression analysis for each time point as follows (Fig. 10);
where exp is exponential, and Fe, iron concentration.
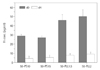
From the above equations, the iron concentrations of the labeled cells by 2 different concentrations of PS or PLL were also estimated. As shown in Fig. 11, the iron concentrations per each cell were significantly overestimated compared to the results of Prussian blue colorimetric assay. However, the decrease of the intracellular iron concentration after 4 d of subculture was clearly demonstrated in all of the samples of PS and PLL, which is well corresponded to the results of the histologic examination of the labeled cells.
DISCUSSION
Detection and observation of the fate of the transplanted cells in a recipient is important for monitoring and evaluation of the cell therapy effectiveness. For non-invasive in vivo monitoring of the cell therapy, MRI is a promising tool, because it can be utilized to observe the dynamic migration of cells with long imaging window, high temporal and spatial resolution, and good contrast, without ionic radiation (12). For cellular tracking with MR, labeling of the cells should be preceded with contrast agent such as SPIO, which step is modified by a transfection agent to maximize the labeling efficiency of stem cells.
For better visualization of the cells, the concentration of the incorporated iron particles is very important. Although the iron concentrations can vary according to the labeling protocol, cell type, and transfection agent, the reported iron concentration for labeling of hMSCs using SPIO-PLL complexes is also variable from 5 pg/mL to 64 pg/mL according to the literature (9, 10, 13, 14). From our results of the colorimetry, the iron concentrations were 5.5-7.8 pg/cell by SPIO-PLL complexes, which are in the range of those published in the articles (9, 10, 13, 14). However, the iron concentrations measured by multi-echo T2* MR were significantly overestimated compared to those of the colorimetry, as 45-50 pg/mL by SPIO-PLL complexes. This trend was demonstrated in the labeled cells by SPIO-PS complexes (1.5-1.9 pg/mL vs. 26-29 pg/mL). The major cause of the discrepancy between the colorimetry and multi-echo T2* MR could be led from the fact that T2*-weighted images are vulnerable from air-tissue interface in the agarose phantom, which causes signal loss confounding the negative contrast enhancement effect by SPIO agent (15) and needs further investigation. For in vitro measurement of the intracellular iron concentration with multi-echo T2* MR, sample preparation technique should be further investigated to reduce susceptibility artifact. However, this can be applied only for in vitro situation but not for in vivo state, because the sample preparation step is omitted for cellular MRI. On the contrary, the visibility of the labeled cells mainly affected by the intracellular iron concentration might be the most important factor for monitoring of the transplanted cells, which should be further investigated with future studies.
Another result of our study is that although both SPIO-PS and SPIO-PLL complexes were able to label the hMSCs effectively with no harmful effect on the cellular viability, proliferation, apoptosis and differentiation capability, the amount of intracellular incorporated iron was significantly larger by SPIO-PLL than SPIO-PS complexes, not only by Prussian blue colorimetry but also by T2* maps obtained from multi-echo T2* MR imaging at 4.7 T.
In detail, although all of the hMSCs incorporated blue colored irons within their cytoplasms either by PS or PLL, the degree of staining was more prominent by PLL, which became more prominent after the first subculture of the labeled cells. In contrast to PLL, PS showed very clear labeling without background contamination by the extracellular SPIO-PLL complexes that may hinder accurate assessment of intracellular incorporated iron content in vivo (5). Considering that iron plays a pivotal role enabling cellular tracking by MR, higher incorporation of intracellular iron by PLL is an important advantage as a transfection agent over PS. Arbab et al. (5) suggested that the incubation time might affect the quality of magnetic labeling by PLL: the longer the incubation period, the more excessive formation of macroscopically visible SPIO-PLL complexes not incorporated into the cytoplasms due to their larger size. Our results also demonstrated that the labeling efficiency and the quality were affected by both optimal ratio between SPIO and PLL (50 : 1.5) and molecular weight of PLL. Therefore, magnetic labeling of the hMSCs by PS or PLL should be further investigated for optimization of the magnetic labeling of hMSCs for cellular MRI.
There are limitations in our study. The colorimetric assay for quantification of intracellular iron concentration was carried out for intact labeled cells, without any cytolytic process. Considering colorimetric assay is usually performed after cytolysis, this might be a factor of discrepancy in the results between colorimetric assay and T2* mapping using multi-echo T2* MR imaging.
In conclusion, hMSCs can be effectively labeled with SPIO-PLL complexes more than with SPIO-PS without significant change in cell metabolism and differentiation. Although quantification of the iron concentrations of the labeled cells in agarose mixture was feasible from T2* maps obtained from multi-echo T2* MRI, it has a tendency of significant overestimation compared to the results of Prussian blue colorimetry. Therefore, further investigation is still necessary for T2* MR-based analytic method to be used as a standard analytic tool in near future.
 XML Download