

 PDF
PDF Citation
 Print
Print


INTRODUCTION
Obesity has become a major health concern worldwide and is a major risk factor for insulin resistance and type 2 diabetes.1 Moreover, excess adipose tissue, in particular visceral adipose tissue (VAT), is an important risk factor for insulin resistance, which links abdominal VAT to cardiovascular risk.2 Abdominal VAT could cause insulin resistance by secreting inflammatory adipokines such as interleukin-6, tumor necrosis factor-α, macrophage chemoattractant protein-1, and resistin.3
Adiponectin, which is the most abundant anti-inflammatory and atheroprotective adipokine secreted by adipose tissues, reduces hepatic gluconeogenesis and increases glucose uptake and whole-body insulin sensitivity.4 However, plasma adiponectin levels are low in individuals with visceral obesity.56 In addition, a reduction in plasma adiponectin levels may play a key role in the development of insulin resistance.3 A recent study suggested that inflammatory cytokine-induced DNA methyltransferase 1 expression alters adiponectin expression by selectively methylating and stimulating a compact chromatin structure in the adiponectin promoter.7 In addition, a previous study reported that the anti-diabetic effects of adiponectin affect insulin sensitivity and have a direct effect on insulin secretion.8
Many studies have shown that adiponectin and visceral fat could be used to predict metabolic abnormalities.9101112 However, in most studies, these two factors played a key role in insulin resistance,1314151617 and only two studies showed a strong association between the combined effects of low adiponectin levels and a high visceral fat mass and the risk of metabolic syndrome in Asian populations.910 As far as we know, there has been no research that assessed the correlation between the two metabolic factors and two insulin status (insulin resistance and insulin secretion) at the same time, specifically in Asia. Thus, we evaluated the association of adiponectin levels and visceral fat mass with the risk of insulin resistance and β-cell dysfunction.
METHODS
Study population
Data from the Cardiovascular and Metabolic Diseases Etiology Research Center (CMERC) study, which was initiated in 2013, were used. The CMERC study recruited individuals aged 30–64 years who had no prior history of malignant tumors or cardiovascular diseases. Details of the CMERC study, and the methods used therein, have been described previously.18 Among the 1,574 participants enrolled from January 2014 to May 2016 in three districts (Suwon, Yongin, and Hwaseong in Korea), 277 were excluded due to lacking data such as VAT mass or 2 hours post-load insulin level. Ultimately, 1,347 individuals were selected for statistical analysis.
Measurements
All participants were interviewed by trained personnel using standardized questionnaire surveys according to a predefined protocol. The standardized questionnaire was used to ascertain basic demographic data, medical history, and information regarding personal characteristics such as physical activity. The level of physical activity was divided into three categories based on the Korean version of International Physical Activity Questionnaire-Short Form: low, moderate, and high physical activity.
Height (cm) and weight (kg) were measured using an automatic height-weight scale (BSM330; InBody Co., Ltd., Seoul, Korea). Body mass index (BMI) was calculated using the following formula: weight/height2 (kg/m2). Waist circumference (cm) was measured midway between the bottom edge of the last rib and the iliac crest in the mid-axillary plane using a measuring tape (Seca GmbH, Hamburg, Germany). Blood pressure (BP) was measured using an automated BP monitor (HEM-7080IC; Omron Healthcare, Lake Forest, IL, USA). Measurements were taken three times at 2 minutes intervals and the last two of the three measurements were averaged. Whole-body dual-energy X-ray absorptiometry (DXA) scans were acquired using a Lunar iDXA (GE Healthcare, Madison, WI, USA) and analyzed with enCORE software (GE Healthcare). VAT mass (kg) was calculated automatically for the DXA android region-of-interest with a caudal limit at the top of the iliac crest19; it was divided into gender-specific VAT masses of < 75th percentile and ≥ 75th percentile.
Blood samples were collected from each participant after at least 8 hours of fasting. Oral glucose tolerance tests (OGTTs) were performed to allow accurate evaluation of glucose metabolism. Each participant drank a 75 g glucose solution, and blood samples were taken at 30, 60, and 120 minutes to measure serum glucose and insulin levels. Biochemical assays were performed at a central laboratory (Seoul Clinical Laboratories, Seoul, Korea). Serum adiponectin levels were measured by enzyme-linked immunosorbent assay kits (R&D Systems, Minneapolis, MN, USA). Glucose levels were obtained using a colorimetric method; total cholesterol, high-density lipoprotein cholesterol, and triglyceride levels were measured enzymatically. High-sensitivity C-reactive protein (hs-CRP) levels were obtained via a turbidimetric immunoassay method using an autoanalyzer (ADVIA 1800 Auto Analyzer; Siemens Medical Solutions, Malvern, PA, USA). Insulin levels were measured using radioimmunoassays (SR 300; STRATEC, Birkenfeld, Germany).
Definitions of insulin resistance and β-cell dysfunction
Insulin resistance was evaluated using homeostatic model assessment of insulin resistance (HOMA-IR) and the Matsuda insulin sensitivity index. Insulin secretion was evaluated using homeostatic model assessment of β-cell function (HOMA-β), insulinogenic index, and disposition index. HOMA-IR was calculated as fasting insulin (μU/mL) × fasting glucose/405 (mg/dL).20 The Matsuda insulin sensitivity index was calculated as 10,000/(fasting glucose [mg/dL] × fasting insulin [μU/mL] × mean glucose during OGTT [mg/dL] × mean insulin during OGTT [μU/mL])0.5.21 HOMA-β was calculated as 360 × fasting insulin (μU/mL)/fasting glucose (mg/dL) − 63.2022 The insulinogenic index was calculated as the increase in insulin levels from 0 to 30 minutes divided by the increase in glucose levels from 0 to 30 minutes during the OGTT.23 The disposition index was calculated as the insulinogenic index × 1/fasting insulin.24 Insulin resistance was defined as a HOMA-IR value ≥ 2.525 or a gender-specific Matsuda index < 25th percentile. β-cell dysfunction was defined as a gender-specific HOMA-β < 25th percentile, insulinogenic index < 25th percentile, or disposition index < 25th percentile.
Statistical analysis
All normally distributed data are presented as means ± standard deviation (SD). Non-normally distributed data are presented as medians and interquartile ranges. Differences were analyzed using Student's t-tests, or Mann-Whitney U tests for continuous variables, or χ2 tests for categorical variables. Conditional logistic regression models were used to calculate odds ratios (ORs) and 95% confidence intervals (CIs) for insulin resistance and β-cell dysfunction, with adjustment for the following potential confounders: gender, age, BMI, hs-CRP, triglyceride, and physical activity. Participants were divided into tertiles according to gender-specific adiponectin levels.
To evaluate the association of adiponectin and visceral fat levels with insulin resistance and β-cell dysfunction, participants were divided as follows: group 1, highest tertile of adiponectin and a VAT mass < 75th percentile; group 2, middle tertile of adiponectin and VAT mass < 75th percentile; group 3, lowest tertile of adiponectin and VAT mass < 75th percentile; group 4, highest tertile of adiponectin and VAT mass ≥ 75th percentile; group 5, middle tertile of adiponectin and VAT mass ≥ 75th percentile; and group 6, lowest tertile of adiponectin and VAT mass ≥ 75th percentile. All analyses were performed using SAS software (ver. 9.4; SAS Institute Inc., Cary, NC, USA).
RESULTS
The baseline characteristics of the study participants are summarized in Table 1. Of the 1,347 participants, 501 (37.2%) were men and 846 (62.8%) were women. The mean ± SD age of the subjects was 50.7 ± 8.5 years for men and 50.0 ± 8.3 years for women. The median (25th–75th percentile) adiponectin level was 3.2 μg/mL (2.1–4.8 μg/mL) for men and 5.6 μg/mL (3.5–8.4 μg/mL) for women. The median (25th–75th percentile) VAT mass was 1.2 kg (0.7–1.6 kg) for men and 0.6 kg (0.4–0.9 kg) for women. The prevalence of diabetes was 12.8% for men and 7.8% for women.
Table 1
Characteristics of the study participants: the CMERC study
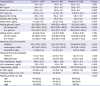
Data are means ± SD or median (25th–75th percentile) unless otherwise indicated.
CMERC = Cardiovascular and Metabolic Diseases Etiology Research Center, BMI = body mass index, VAT = visceral adipose tissue, BP = blood pressure, HOMA-β = homeostatic model assessment of β-cell function, HOMA-IR = homeostatic model assessment of insulin resistance, HDL = high-density lipoprotein, hs-CRP = high-sensitivity C-reactive protein, SD = standard deviation.
aP values for comparison between men and women were tested by Student's t-tests, Mann-Whitney U tests, or χ2 tests.
Table 2 shows the association of adiponectin levels and visceral fat mass with insulin resistance. In an unadjusted model, compared with the highest tertile adiponectin level, the ORs for HOMA-IR ≥ 2.5 were 2.60 (95% CI, 1.83–3.69) and 5.47 (3.90–7.67) for the middle and lowest tertile of adiponectin level, respectively. The ORs (95% CI) for a Matsuda index ≤ 25th percentile were 2.16 (1.51–3.10) and 4.51 (3.20–6.35) for the middle and lowest tertile, respectively. The association remained significant after adjustment for potential confounders, except the OR for Matsuda index < 25th percentile for the middle tertile. After adjustment for confounders, a VAT mass ≥ 75th percentile was associated with a significantly higher risk of insulin resistance (HOMA-IR ≥ 2.5: OR, 3.60; 95% CI, 2.48–5.23; Matsuda index < 25th percentile: OR, 3.44; 95% CI, 2.36–5.04) compared with a VAT mass < 75th percentile. These associations were more obvious in women.
Table 2
ORs (95% CI) for insulin resistance
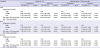
Values are presented as median (interquartile range) or number (%).
OR = odds ratio, CI = confidence interval, HOMA-IR = homeostatic model assessment of insulin resistance, VAT = visceral adipose tissue, BMI = body mass index, hs-CRP = high-sensitivity C-reactive protein.
aAdjusted for gender, age, BMI, hs-CRP, triglyceride, physical activity, adiponectin level, and VAT mass.
Table 3 shows the association of adiponectin level and visceral fat with β-cell dysfunction. After adjustment for confounders, there was no significant association between adiponectin level or visceral fat mass and a HOMA-β < 25th percentile and insulinogenic index < 25th percentile. However, a VAT mass ≥ 75th percentile was associated with a significantly higher risk of a disposition index < 25th percentile (OR, 1.70; 95% CI, 1.19–2.42) compared with a VAT mass < 75th percentile. The associations were consistent in both men and women.
Table 3
ORs (95% CI) for β-cell dysfunction
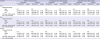
Values are presented as median (interquartile range) or number (%).
OR = odds ratio, CI = confidence interval, HOMA-β = homeostatic model assessment of β-cell function, VAT = visceral adipose tissue, BMI = body mass index, hs-CRP = high-sensitivity C-reactive protein.
aAdjusted for gender, age, BMI, hs-CRP, triglyceride, physical activity, adiponectin level, and VAT mass.
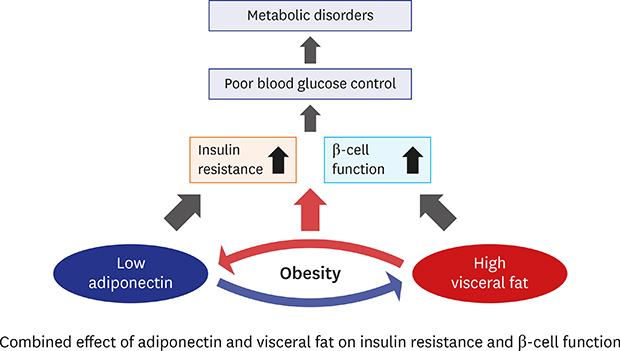
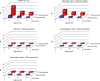
The combination of the lowest adiponectin levels and a VAT mass ≥ 75th percentile was associated with a higher insulin resistance (HOMA-IR ≥ 2.5: adjusted OR, 13.79; 95% CI, 7.65–24.83; Matsuda index < 25th percentile: adjusted OR, 8.34; 95% CI, 4.66–14.93) compared with the highest adiponectin levels and a VAT mass < 75th percentile. In addition, the lowest adiponectin levels and VAT mass ≥ 75th percentile showed a stronger association with a disposition index < 25th percentile (OR, 1.87; 95% CI, 1.15–3.04) than did the highest adiponectin levels and VAT mass < 75th percentile in both men and women (Fig. 1 and Supplementary Fig. 1). However, regarding β-cell dysfunction, the associations were consistent in women (Supplementary Fig. 1). When individuals with diabetes were excluded, the combination of a low adiponectin level and high visceral fat mass was associated with the risk of insulin resistance, but not β-cell dysfunction (Supplementary Tables 1 and 2).
Fig. 1
ORs for insulin resistance and β-cell dysfunction according to adiponectin levels and VAT mass. The analyses were adjusted for potential confounders such as gender, age, BMI, hs-CRP, triglyceride, and physical activity.
OR = odds ratio, VAT = visceral adipose tissue, BMI = body mass index, hs-CRP = high-sensitivity C-reactive protein, HOMA-IR = homeostatic model assessment of insulin resistance, HOMA-β = homeostatic model assessment of β-cell function, T1 = tertile 1, T2 = tertile 2, T3 = tertile 3.
a
P < 0.05.
DISCUSSION
In this cross-sectional study, low adiponectin levels and a high visceral fat mass were associated with an increased risk of insulin resistance and β-cell dysfunction. Obesity is a well-known risk factor for insulin resistance. In particular, abdominal obesity causes insulin resistance by stimulating the formation of metabolic products derived from lipids, hormones, and cytokines. Insulin resistance may lead to endothelial dysfunction and changes in the insulin signaling pathway.3 Thus, the association between increased visceral fat and the risk of insulin resistance is well-established. In addition, a previous study found an inverse correlation between visceral fat and insulin secretion after adjusting for insulin sensitivity.2627 Further studies reported that visceral fat accumulation contributes to decreased adiponectin levels,628 although the underlying mechanism is not fully understood. However, some studies suggested that factors that inhibit adiponectin synthesis or secretion are secreted from VAT.29 For example, tumor necrosis factor-α is a strong inhibitor of adiponectin promoter activity.30
Adiponectin mediates systemic insulin sensitivity and glucose homeostasis. A previous study reported that low plasma adiponectin levels predicted abdominal visceral fat accumulation and insulin resistance in Japanese Americans.15 However, conflicting results on the effects of adiponectin on insulin secretion have been reported so far.831323334 Some reports suggested a role for adiponectin in modulating plasma insulin levels, both by increasing insulin sensitivity and also via a direct effect on insulin secretion from β-cells. G-adiponectin influences glucose-induced insulin secretion in both human pancreatic islets and rat β-cells.8 In a population-based study in Japan, adiponectin levels were inversely associated with HOMA-β.31 Although the current study showed that low adiponectin levels were associated with the risk of insulin resistance but not β-cell dysfunction, the combination of low adiponectin levels and a high visceral fat mass was associated with a low disposition index, which is an indicator of β-cell function, relative to insulin sensitivity.
From the result of our study, the effect of adiponectin and abdominal visceral fat on β-cell function was different by gender. Considering the disposition index, the association was significant only in women group. Of course, we cannot rule out the possibility of selection bias, information bias or unexpected confounding factors. However, gender differences in β-cell function should not be underestimated either. First, we have to consider about the difference of adiponectin level and body fat distribution between men and women. A recent research has found that β-cell function has a negative correlation with pancreatic fat mass.35 High visceral fat might increase pancreatic fat and as a result, β-cell function might decrease. Second, there are clinical studies suggesting that women have higher insulin action than men, which supports greater insulin secretion.36 Some studies suggest that gender difference in islet-cell function and susceptibility to failure is a main factor of different insulin action.37 Finally, the different body content or role of sex steroids like estrogen, androgen and progesterone could be also a reason of gender difference in β-cell function.38
We do not know what factors exactly affect the results of our study yet. Further research including prospective study targeting on gender difference is needed.
The current study revealed low adiponectin levels and a high visceral fat mass have combined effects on insulin resistance and β-cell dysfunction. Recent studies revealed a strong association between the combined effects of decreasing adiponectin levels and an increasing visceral fat mass with cardiovascular risk factors.910 For example, in a population-based study in Japan, a combined effect of an increasing visceral fat mass and decreasing adiponectin level was seen on the prevalence of metabolic syndrome. The ORs for metabolic syndrome with the combination of low adiponectin levels and a high visceral fat mass were 12.7 (95% CI, 9.7–16.6) for men and 13.5 (95% CI, 6.0–30.2) for women.9 In Korea, low adiponectin levels and a high visceral fat mass were associated with the development of metabolic syndrome.10
This study had some limitations that should be addressed. First, due to its cross-sectional design, the direction of causality is unclear, and changes in adiponectin, VAT mass, insulin resistance, and β-cell dysfunction were not monitored. Second, abdominal visceral fat levels were measured by DXA, even though computed tomography is the gold standard for measuring visceral fat.39 Nevertheless, DXA is a valuable tool for assessing visceral fat.4041 Finally, specific cutoff values were used for adiponectin, VAT mass, and glucose metabolism based on a cohort from a specific area in Korea, because there are no population-specific thresholds for those variables.
In conclusion, the current study found that combined low adiponectin levels and a high visceral fat mass might affect not only insulin resistance, but also β-cell dysfunction, even though there could be difference by gender. Examining adiponectin levels in conjunction with visceral fat mass may improve the detection of insulin resistance and β-cell dysfunction. Thus, further prospective studies are needed to explore the combined effects of these factors on the development of insulin resistance and β-cell dysfunction.
 XML Download