

 PDF
PDF Citation
 Print
Print


INTRODUCTION
Assessment of accurate volume status is of great importance in patients with various cardiac conditions or renal insufficiency regarding diagnosis, monitoring the response to therapy, and prognosis.12 Bioelectrical impedance analysis (BIA) is a widely used tool to assess the volume status of patients due to its low cost, non-invasiveness and ease of use.3 BIA analysers report the amount of body fluid in volumetric units (usually litres) using their own algorithms to convert the electrical measurements from human cells into volumetric numbers. However, those algorithms are derived from various mathematical regression models and assumptions that are usually derived from and validated in healthy and steady-state populations. Thus, the accuracy of the estimated values from conventional BIA may be compromised in patients with abnormal conditions, such as congestive heart failure or chronic and acute renal insufficiency, in whom the use of raw electrical data would have greater strength.45678 Bioelectrical impedance vector analysis (BIVA) is an alternative method to overcome such limitations of conventional BIA methods. BIVA creates vector plots of impedance (Z) on height standardized resistance (R) and reactance (Xc) axes, which is called the RXc graph, from raw impedance data instead of reporting volumetric values as is done in conventional BIA.9
For the correct interpretation of a patient's volume status using a BIVA plot, normal reference values are needed, which might be different according to gender and ethnicity. There were several articles that showed normal electrical vector plots for the interpretation of volume status of diseased patients in other countries. However, to the best of our knowledge, there have been no studies reporting standardized reference vector plots for Koreans. The aim of this study was to establish gender-specific normal reference vector plots for healthy Koreans and compare them with those of other ethnic groups.
METHODS
Subjects with no history of medical illness except hypertension were recruited. Well-trained and dedicated physicians conducted physical examinations to ascertain the health and volume status of subjects and assessed functional limitations of daily activities. The subjects were considered to be euvolemic when they had a steady-state body weight and exhibited normal skin turgor without pitting oedema or jugular venous distention. We excluded subjects who had abnormal chest and heart sounds, irregular heartbeats, pale conjunctiva and icteric sclera. A total of 242 healthy subjects were recruited (137 men and 105 women) from Busan metropolitan area between December 2015 and November 2016.
Measurements
The height and weight of the participants were measured using a digital scale equipped with a stadiometer. Upper arm circumference was measured on the non-dominant arm at the mid-point between the shoulder and elbow using a tape measure. Blood pressure was measured on both arms, and the higher reading was recorded. Bioelectrical impedance was measured using a tetra-polar eight-point tactile electrode system (InBody S10®; InBody Co., Ltd., Seoul, Korea) that provides a set of raw bioelectrical measurements of Z and Xc, each for five parts of the body (both arms and legs and the trunk) in multiple frequencies ranging from 1 kHz to 1,000 kHz. Whole-body Z and Xc values were each the sum of those readings for the right arm, right leg and trunk at 50 kHz. Whole-body R and phase angle (PhA) values were obtained using the following equations: Z2 = R2 + Xc2 and arctangent (Xc/R) with a conversion factor of 180°/ π. The volumetric readings, which were provided with the built-in BIA algorithm of Inbody S10, were collected for total body water, intracellular water, and extracellular water. Special care was given to clean with wet tissues the skin in contact with the electrodes and to spread out the arms and legs such that they did not touch any other part of the body in the supine position.
Statistical analysis
Continuous variables are expressed as the means ± standard deviations (SDs) and were compared using Student's t-test. Categorical variables are presented as frequencies with percentages in parenthesis and were compared using Fisher's exact probability test. The Pearson correlation coefficient was calculated to examine the association between two continuous variables. The impedance measurements were standardized with heights (H) and plotted on an R/H versus Xc/H graph (RXc graph). Given the assumption that the two variables were normally distributed and correlated with each other, the ellipsoid joint probability contours were constructed according to the probability density function of the multivariate normal distribution (Supplementary Data 1).10 Three gender-specific tolerance ellipses were drawn within which the vector for an individual subject falls with a probability of 50%, 75%, and 95%. Gender-specific 95% confidence ellipses for mean vectors were constructed using the means and SDs of R/H and Xc/H. The differences between mean vectors were considered significant when their 95% confidence ellipses did not overlap according to Hotelling's T
2 test. Statistical significance was defined as P < 0.05. All statistical calculations were performed using SPSS software version 22.0 (IBM SPSS Inc., Chicago, IL, USA).
RESULTS
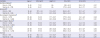
The mean ages of the men and women were 37.3 ± 11.5 (range, 22–83) and 37.9 ± 14.9 (range, 21–82) years, respectively, without a significant difference (P = 0.720) (Table 1). The men were significantly taller and heavier than the women. The body mass index (BMI) and systolic and diastolic blood pressures were significantly higher in the men, but the prevalence of hypertension was similar between the genders. In the women, Z, R, Xc and their standardized values (R/H and Xc/H) were significantly higher, while the phase angle (PhA) was significantly lower, than the corresponding values for the men. Regarding the estimated body fluid volume using the built-in conventional BIA algorithm, the mean TBW was 42.75 ± 4.96 litres in the men and 28.92 ± 2.89 litres in the women (P < 0.001). All the estimates of body fluid compartments were significantly larger, although the ratios of ECW/TBW and ECW/ICW were significantly lower, in men (Supplementary Table 1). The associations between impedance values and age were presented in Supplementary Table 2.
Table 1
Baseline characteristics and impedance values
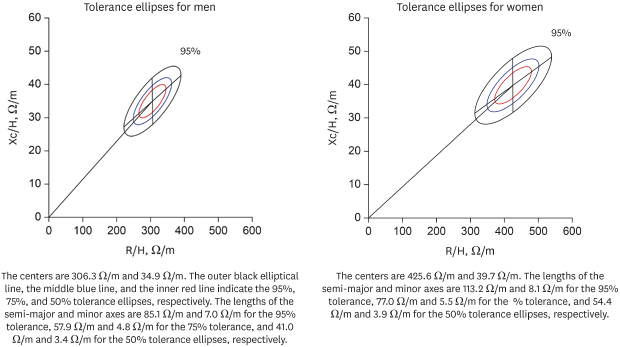
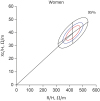
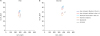
The gender-specific normalized bioimpedance vectors were plotted on the RXc graph. The tolerance ellipses for men (Fig. 1) had a center of 306.3 Ω/m and 34.9 Ω/m, and the lengths of the semi-major and minor axes were 85.1 Ω/m and 7.0 Ω/m for the 95% tolerance, 57.9 Ω/m and 4.8 Ω/m for the 75% tolerance, and 41.0 Ω/m and 3.4 Ω/m for the 50% tolerance ellipses, respectively. The slopes of the major and minor axes were 42.5° and −89.5°, respectively. The tolerance ellipses for women (Fig. 2) had a center of 425.6 Ω/m and 39.7 Ω/m. The lengths of the semi-major and minor axes were 113.2 Ω/m and 8.1 Ω/m for the 95% tolerance, 77.0 Ω/m and 5.5 Ω/m for the 75% tolerance, and 54.4 Ω/m and 3.9 Ω/m for the 50% tolerance ellipses, respectively. The slopes of the major and minor axes were 36.8° and −89.6°, respectively. The size of the ellipses for the women were larger and the mean vector was significantly deviated to the upper right side compared with those for the men (Hotelling's T
2 = 677.087; P < 0.001). The confidence ellipses across the age groups were depicted in Supplementary Fig. 1.
Fig. 1
Tolerance ellipses for Korean men. The centers are 306.3 Ω /m and 34.9 Ω /m. The slopes of the major and minor axes are 42.5° and −89.5° on this scale of the RXc graph, respectively. The outer black elliptical line, the middle blue line, and the inner red line indicate the 95%, 75%, and 50% tolerance ellipses, respectively. The lengths of the semi-major and minor axes are 85.1 Ω/m and 7.0 Ω/m for the 95% tolerance, 57.9 Ω/m and 4.8 Ω/m for the 75% tolerance, and 41.0 Ω/m and 3.4 Ω/m for the 50% tolerance ellipses, respectively.
R/H = resistance normalized by height, Xc/H = reactance normalized by height, R = resistance, Xc = reactance.
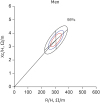
Fig. 2
Tolerance ellipses for Korean women. The centers are 425.6 Ω/m and 39.7 Ω/m. The slopes of the major and minor axes are 36.8° and −89.6° on this scale of the RXc graph, respectively. The outer black elliptical line, the middle blue line, and the inner red line indicate the 95%, 75%, and 50% tolerance ellipses, respectively. The lengths of the semi-major and minor axes are 113.2 Ω/m and 8.1 Ω/m for the 95% tolerance, 77.0 Ω/m and 5.5 Ω/m for the 75% tolerance, and 54.4 Ω/m and 3.9 Ω/m for the 50% tolerance ellipses, respectively.
R/H = resistance normalized by height, Xc/H = reactance normalized by height, R = resistance, Xc = reactance.
Comparison with other ethnic groups
The age, BMI, height, and height-standardized impedance values of Northern Italians, Spaniards, and Non-Hispanic Whites, Non-Hispanic Blacks, and Mexican Americans who lived in the United States were collected from published studies and compared with the values of Koreans in Table 2.111213 The men were taller and had lower values of both R/H and Xc/H than the women across all the populations. The 95% confidence ellipses for those groups were constructed using the reported means and SDs of R/H and Xc/H (Fig. 3). The ellipses for Korean men and women were present to the lower right side of those for Mexican Americans, Non-Hispanic individuals of African descent, and Non-Hispanic Caucasians and to the upper right side of those for Spaniards and Northern Italians without an overlap.
Table 2
Representative impedance values across populations
| Variables | Age, yr | BMI, kg/m2 | Height, m | R/H, Ω/m | Xc/H, Ω/m | r | |
|---|---|---|---|---|---|---|---|
| Northern Italians11 | |||||||
| Men (n = 354) | 15–85 | 17–31 | NA | 298 ± 42.3 | 30.8 ± 7.2 | 0.47 | |
| Women (n = 372) | 15–85 | 16–31 | NA | 371.9 ± 49.0 | 34.4 ± 7.7 | 0.41 | |
| Spaniards12 | |||||||
| Men (n = 162) | 18–64 | 27.7 ± 3.8 | 1.74 ± 0.07 | 264.9 ± 31.7 | 32.7 ± 5.7 | 0.55 | |
| Women (n = 149) | 18–74 | 25.2 ± 4.5 | 1.62 ± 0.06 | 368.4 ± 43.5 | 37.6 ± 5.2 | 0.71 | |
| Non-Hispanic Caucasians13 | |||||||
| Men (n = 1,572) | 20–69 | 19–30 | 1.77 ± 0.07 | 277.2 ± 33.6 | 38.1 ± 6.2 | 0.60 | |
| Women (n = 1,625) | 20–69 | 19–30 | 1.63 ± 0.06 | 372.9 ± 44.0 | 46.9 ± 7.1 | 0.61 | |
| Non-Hispanic Blacks13 | |||||||
| Men (n = 1,254) | 20–69 | 19–30 | 1.76 ± 0.07 | 282.9 ± 37.3 | 41.4 ± 7.0 | 0.63 | |
| Women (n = 1,099) | 20–69 | 19–30 | 1.64 ± 0.06 | 372.5 ± 45.8 | 50.6 ± 8.2 | 0.69 | |
| Mexican Americans13 | |||||||
| Men (n = 1,400) | 20–69 | 19–30 | 1.69 ± 0.06 | 293.1 ± 36.3 | 42.2 ± 6.7 | 0.62 | |
| Women (n = 1,072) | 20–69 | 19–30 | 1.57 ± 0.06 | 390.6 ± 45.8 | 51.1 ± 8.0 | 0.65 | |
| Koreans | |||||||
| Men (n = 137) | 22–83 | 25.1 ± 3.5 | 1.74 ± 0.07 | 306.3 ± 34.6 | 34.9 ± 4.3 | 0.74 | |
| Women (n = 105) | 21–82 | 22.0 ± 3.2 | 1.60 ± 0.05 | 425.6 ± 46.1 | 39.7 ± 4.8 | 0.72 | |
DISCUSSION
BIA has been used widely to estimate the volume status of various patients in clinics.1415 However, the accuracy of BIA may be compromised when the volumetric reports are used rather than the directly measured raw indexes, especially in patients with congestive heart failure or renal insufficiency because the converting algorithms are derived from and validated in healthy people and are highly dependent on body weight value as well.246 By contrast, BIVA does not require those algorithms and body weight because it uses raw electrical measurements and height, which is a more constant variable. Thus, there are advantages of BIVA in the assessment of such patients with abnormal health conditions. However, BIVA requires normal reference plots for determination of the position of individual vectors.91617
In previous studies, it was demonstrated that the position of impedance vectors corresponds well to the change in individual volumic and nutritional statuses, as the vector is displaced parallel to the major axis of the reference tolerance ellipses, indicating a change in hydration status, and to the minor axis, indicating a change in cell mass and quality.2131819 Piccoli et al.20 suggested the reference 75% tolerance ellipse of a healthy population as the boundary for normal hydration status in dialysis-dependent patients. Based on those properties of BIVA, its clinical applications for adjusting optimal dry weight and estimating prognosis in patients depending on hemodialysis have been demonstrated.21 In other studies, BIVA were able to assess the hydration status and its shifts appropriately over the clinical course implying the role in diagnosis and treatment in patients with heart failure.2223
In this study, gender-specific normal reference vector plots were suggested using Inbody S10. We presented three different reference tolerance ellipses on the RXc graph for the probabilities of 50%, 75%, and 95% for each gender of the Korean population. The tolerance ellipses for women were situated on the upper right side and spread more widely than those for men. This pattern has been observed in other ethnic populations such as Northern Italians and Spaniards, and it appears to be caused by the larger mean values and greater variations of the bioimpedance measurements (Z, R, and Xc) in women than in men.24
Although the same pattern of gender differences in the tolerance ellipses was consistently observed across all other ethnic groups, the 95% confidence ellipses were located differently from each other. This result suggested that one set of reference values drawn from one study group could not be applied to the other groups interchangeably. The differences may be caused by the disparities in body composition, ethnicity, health status, and devices used across studies.1425 In a United States study from which the bioimpedance data were collected for Non-Hispanic Caucasians, Non-Hispanic individuals of African descent, and Mexican-Americans using the third National Health and Nutrition Examination Survey, 23% of the participants had abnormal health conditions.13 This result was in stark contrast to the fact that this study recruited only healthy subjects without apparent abnormal physical signs.
It is noteworthy that the minor axis of the ellipses in our study was more vertical in a lesser orthogonal position to the major axis on the RXc graph. The pattern was prominently different from that depicted in previous studies, in which the minor axis was more slanted at a right angle to the major axis. However, given the anisometric scale of x (ranging from 0 to 600) and y (ranging from 0 to 60) axes on the RXc graph, we believed that the angle between the major and the minor axes should not be a right angle on this scale of the graph. This difference could partly be explained by the methodological difference used to draw the ellipses. In the first report by Piccoli et al.,9 they used their own modified equations for statistical calculations. By contrast, we used the joint probability density function for the bivariate normal distribution and calculated eigenvectors and eigenvalues to draw the ellipses without any arbitrary modifications (Supplementary Data 1).10
One of the limitations of BIVA compared with conventional BIA is that it cannot discriminate the intracellular and extracellular water components from the total body water component. Multifrequency bioimpedance analysis may have the potential to discriminate those components, but its relevance should be demonstrated in further studies. Otherwise, both BIVA and BIA could be used clinically in a complementary manner (Supplementary Fig. 2).
There are several factors to be considered when interpreting the results of this study. First, the number of subjects recruited for this study may not be sufficiently large to represent the entire Korean population. However, the fact that we enrolled only healthy subjects, screened by a thorough physical examination, renders our results more accurate for healthy populations. Second, this study used only one device to measure the electrical properties. Thus, our results may not be comparable to the data obtained by other devices.2627 To our best knowledge, this is the first study establishing reference ellipses on the RXc graph for healthy Koreans.
In conclusion, this study presented normal reference BIA parameters and corresponding tolerance and confidence ellipses on the RXc graph, which is of paramount importance for the clinical interpretation of an individual vector position. There were also noticeable differences in reference ellipses with regard to gender and ethnic groups. We believe that these basic data could be used for the accurate interpretation of BIA-assessed volume status in Korean patients with heart failure or renal disease.
 XML Download