

 PDF
PDF Citation
 Print
Print


INTRODUCTION
Isoflurane has been widely used for anesthesia for cardiac surgeries, but previous experimental studies showed isoflurane-induced reduction of myocardial contractility.12 Considering frequent association of reduced cardiac reserve or pre-existing cardiac dysfunction in patients undergoing cardiac surgeries, further deterioration of left ventricle (LV) performance would be problematic in terms of potentially increasing patients' perioperative risk. However, it is difficult to find previous studies that determined isoflurane's direct effect on LV contractile function during cardiac surgeries.
Meanwhile, previous studies determined direct effects of anesthetic agents on the intraoperative LV systolic function by using peak systolic velocity of the lateral mitral annulus in tissue Doppler imaging (S′) of the mitral annular motion.345 Importantly, while mitral annular tissue Doppler imaging (TDI) has been regarded as an easier and less operator-dependent tool for evaluating LV long-axis performance,678 S′ showed close relationship with other systolic parameters, including intraventricular pressure change (dP/dt) and left ventricular ejection fraction (LVEF).910 Furthermore, its greater sensitivity enabled the detection of small changes in systolic performance which was not detected by LVEF.910111213 Most of all, being relatively less dependent on LV-loading condition seems to be a valuable feature for its use in intraoperative analysis of LV performance.9
Therefore, we analyzed the changes in S′ in response to the increments of isoflurane dosage during the isoflurane-supplemented remifentanil-based anesthesia for cardiac surgeries. Consequently, we hypothesized that isoflurane would dose-dependently reduce intraoperative S′ in this setting.
METHODS
Patients
Preoperative exclusion criteria included the following: pacemaker implantation, atrial fibrillation, infective endocarditis, pericardial disease, infiltrative myocardial disease, ischemic heart disease, limited mitral annular motion,14 LVEF < 50% in preoperative transthoracic echocardiography (TTE) or contraindications to transesophageal echocardiography (TEE).
Anesthesia and monitoring
Electrocardiogram, Bispectral index (BIS), and pulse oximetry were applied on patient's arrival in the operation room. A 20–22 G catheter was placed in the radial artery to start invasive blood pressure (BP) monitoring. Anesthesia was maintained with isoflurane (Aerane™; Boxter Healthcare, Deerfield, IL, USA) with O2 and medical air (FiO2 0.4–0.6), rocuronium and target-controlled infusion of remifentanil (target plasma concentration of 20 ng/mL in Minto model, comparable to continuous infusion (0.7–0.8 μg/kg/min) with monitoring of the central venous pressure (CVP), pulmonary arterial pressure (PAP), cardiac output (CO), and mixed venous O2 saturation (SvO2). Intraoperative TEE (Vivid 7™ and Omniplane™ TEE probe; GE Healthcare, Waukesha, WI, USA) was performed. Systemic vascular resistance index (SVRI) was determined regularly.15
Before the start of the present study, hydroxyl ethyl starch and phenylephrine were infused to maintain the mean BP of 80%–120% of the pre-induction value. Patients who were unable to maintain BIS < 60 at isoflurane 1.0 minimum alveolar concentration (MAC), and patients with heart rate (HR) < 45 or > 100 beats/min, requiring extra rescue medication, were excluded.
Intraoperative TEE data recording
After sternotomy, consecutive 3–4 TDI-tracings of the lateral mitral annular motion were recorded with a sweep speed of 6.67 cm/s in the midesophageal 4-chamber view121617 at end-tidal concentration at 1.0, 1.5, and 2.0 age-adjusted MAC (T1, T2, and T3, respectively).18 Doppler tracings of mitral inflow and two-dimensional (2D) images for LVEF were also traced and recorded in the midesophageal 4-chamber or 2-chamber view at T1, T2, and T3.
All recordings were performed after at least 10-minute-exposure to each isoflurane dosage, and one investigator (TYK) performed all recordings with short interruptions of ventilation and surgical procedure. Recorded data were digitally stored for future off-line analysis after removing patient information and recording time.
Patients were excluded if appropriate TDI alignment to the mitral annular motion was failed or their degree of mitral regurgitation (MR) was changed during the increments.
Other hemodynamic and BIS data recording
BP, HR, PAP, CVP, CO, SvO2, and BIS were also recorded at T1, T2, and T3. During the study period with isoflurane increments, mean BP was maintained within the pre-induction level of 80%–120% with/without titrating the phenylephrine infusion rate. In case of the titration, the data were acquired after allowing at least 5 minutes.
Post-operative off-line analysis of the recorded data
An echocardiographer, who was blinded for our study, performed the following determinations by using software (EchoPac™; GE Healthcare): S′, peak velocities of tissue Doppler imaging mitral annulus during early relaxation and late atrial contraction (e′ and a′, respectively), peak velocities of transmitral Doppler flow during early relaxation and atrial contraction (E and A, respectively), E/A ratio and deceleration time (DT) of transmitral inflow during early relaxation.
S′, e′, and a′ were determined by using a single TDI tracing out of 3–4 consecutive recorded tracings, and their determination was repeated in the same manner. For statistical analysis, the mean values of two determinations were employed. Stroke volume (SV) and LVEF were calculated by using left ventricle end-diastolic volume (LVEDV) and left ventricle end-systolic volume (LVESV) in modified Simpson method. During the study period, systolic BP and arterial elastance (Ea = systolic BP/SV, mmHg/mL) were employed to analyze the changes in LV end-systolic pressure and LV afterload, respectively.1415
Statistical analysis of final data
The primary outcome was the changes in S′ at T1, T2, and T3. Data distribution was evaluated for normality using the Shapiro-Wilk test to compare variables among different concentrations of isoflurane. Sphericity of normally distributed data was evaluated by using Mauchly's test. The changes of data passing normality and sphericity tests were analyzed by using repeated measures of analysis of variance (ANOVA) and Tukey's post-hoc test. The data that just passed the normality test, but not the sphericity test, were analyzed by using Wilks' Lambda's multivariate analysis of variance (MANOVA) and Bonferroni correction. Abnormally distributed data were analyzed by using Friedman test and Bonferroni correction.
The changes in DT, LVEF, mean BP, SVRI, LVEDV, LVESV, and E/A were analyzed by repeated measures of ANOVA. Those in S′, E, PAP, HR, and SV were analyzed by using MANOVA, and those in BIS, SvO2, CO, phenylephrine infusion rate, e′, a′, A, ratio of E to e′ (E/e′), LVEDV, LVESV, SV, Ea, and the numbers of patients were analyzed by using Friedman test.
In order to visualize the agreement between the first and the second determination of S′, e′, and a′, we constructed Bland-Altman plot.19 Bland-Altman limits of agreement (LOA) was evaluated according to the mean agreement (mean of difference between the first and the second measured values) and 95% LOA (mean ± 1.96 standard deviation of differences).20
Pearson (r) or Spearman rank correlation coefficient (ρ) was employed to examine the relation between the first and the second measured values (r in S′, ρ in e′ and a′). SPSS version 21.0 (IBM Corp., Armonk, NY, USA) was used for statistical analysis.
To obtain a sample size estimate for the study, a pilot study was conducted to obtain S′ from five patients. At T1, T2, and T3, the average values of S′ were 9.5, 8.9, and 8.0 cm/s, respectively, and their standard deviation ranged from 1.5 to 2.2 cm/s. Autocorrelation between adjacent measurements in the same individual was 0.6. For power calculation, we assumed that the first-order autocorrelation adequately represents the autocorrelation pattern and planned to use Greenhouse-Geisser Corrected F-test for the repeated measurement of ANOVA to determine the within-group difference of S′. Consequently, the standard deviation was 0.70 cm/s and the standard deviation of actual effect was 0.62 cm/s, and their effect size was 0.88. For a power of 80% and an α of 0.05, 18 patients were appropriated. As a usual chance of failure for successful TDI tracing of the lateral mitral annulus by using TEE was 10%, we decided to enrol 20 patients. The PASS 11™ software (NCSS, Kaysville, UT, USA) was employed to compute the sample size.
Ethics statement
Our manuscript adheres to the Strengthening the Reporting of Observational Studies in Epidemiology guidelines. After getting Institutional Review Board approval of Konkuk University Medical Center (KUH 1160052) and registering at www.ClinicalTrials.gov (NCT01819012), patients undergoing a cardiac surgery were recruited after providing written informed consent (Fig. 1).
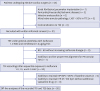
Fig. 1
Patient recruitment and analysis diagram. Twenty-one patients were recruited and one was excluded due to the failure to align Doppler beam parallel to the axis of the lateral annular motion during the entire systolic period.
LVEF = left ventricular ejection fraction, TTE = transthoracic echocardiography, TEE = transesophageal echocardiography, MAC = minimum alveolar concentration, BIS = Bispectral index, MV = mitral valve, TDI = tissue Doppler imaging, BP = blood pressure, HR = heart rate, bpm = beat per minute.
RESULTS
Twenty-five patients were initially recruited, and 5 of them were excluded. Data of 20 patients were finally analyzed (Fig. 1, Table 1). The mean differences between the first and the second measured S′, e′, and a′ values were not significantly different from 0 in Bland-Altman analysis (Fig. 2). The mean agreements (95% LOA) for S′, e′, and a′ were 0.088 (−1.56–1.72), 0.047 (−2.98–3.07), and 0.089 (−1.36–1.54), respectively. Between the first and the second measured values, correlation coefficients were 0.743 for S′, 0.736 for e′, and 0.630 for a′ (all P < 0.001, Fig. 3). The values of intra-class variability of S′, e′, and a′ were 0.966, 0.973, and 0.966, respectively, which indicated acceptable reliability.
Table 1
Demographic data
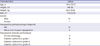
Fig. 2
Correlation and agreement of the first and second measurements of TDI parameters. Measure 1: first measurements of each variable. Measure 2: second measurements of each variable. The solid line shows the mean difference and the dash lines show the LOAs (mean difference ± 1.96 standard deviations).
TDI = tissue Doppler imaging, S′ = peak velocity of the lateral mitral annulus during systole, e′ = peak velocity of tissue Doppler imaging mitral annulus during early relaxation, a′ = peak velocity of mitral annular TDI during late atrial contraction, LOA = limits of agreement, T1, T2, and T3 = after 10-minute-exposure to isoflurane 1.0, 1.5, and 2.0 MAC, respectively, MAC = minimum alveolar concentration.
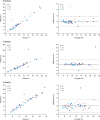
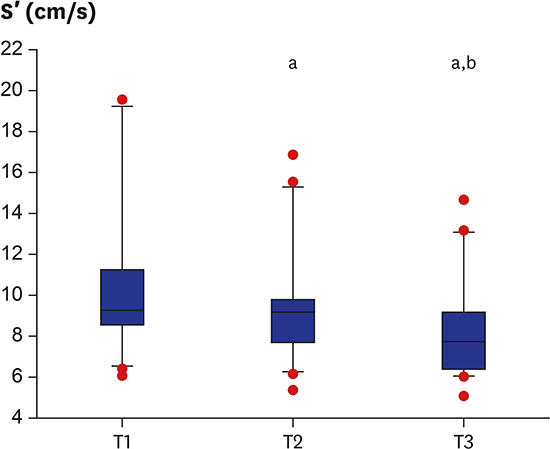
Fig. 3
S′, e′, a′, and BIS during the increments of isoflurane dosage. The boxes show the 25th and 75th percentiles, and horizontal lines within the box show median values. The whiskers show the lowest and highest values in the 25th percentile minus 1.5 IQR and 75th percentile plus 1.5 IQR regions, respectively. The optimal hypnosis level for general anesthesia is a BIS value between 40 and 60.
S′ = peak velocity of the lateral mitral annulus during systole, e′ = peak velocity of tissue Doppler imaging mitral annulus during early relaxation, a′ = peak velocity of tissue Doppler imaging mitral annulus during late atrial contraction, BIS = Bispectral index, IQR = interquartile range, T1, T2, and T3 = after 10-minute-exposure to isoflurane 1.0, 1.5, and 2.0 MAC, respectively, MAC = minimum alveolar concentration.
aP < 0.05 vs. T1; bP < 0.05 vs. T2.
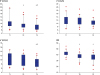
As a primary objective, mean S′ values (95% confidence interval [CI]) at T1, T2, and T3 were 10.5 (8.8–12.2), 9.5 (8.3–10.8), and 8.4 (7.3–9.5) cm/s, respectively, and they were significantly reduced in all increments (P < 0.001 in MANOVA test) with sufficient power (F [3, 17] = 79.598, P < 0.001: Wilks' Lambda = 0.066, Fig. 3). Mean differences in T1 vs. T2, T2 vs. T3, and T1 vs. T3 were −0.96 (−1.63, −0.32), −1.11 (−1.66, −0.57), and −2.09 (−3.08, −1.09) cm/s, respectively.
Mean values of a′ at T1, T2, and T3 were 10.6 (9.3–12.0), 9.8 (8.5–11.0), and 8.7 (7.7–9.7) cm/s, respectively, and were significantly reduced in T1 vs. T3 and T2 vs. T3 (P < 0.001): mean differences were −1.94 (−3.13, −0.75) and −1.07 (−1.73, −0.41) cm/s, respectively (Fig. 3).
Mean values of e′ at T1, T2, and T3 were 12.3 (10.8–13.8), 11.8 (10.5–13.1), and 11.0 (9.9–12.0) cm/s, respectively, and did not show any significant change (P = 0.059) at all increments (Fig. 3). BIS values at T1, T2, and T3 were 43 (41–45), 37 (35–40), and 35 (32–38) cm/s, respectively, and were significantly reduced at T1 vs. T2 and T1 vs. T3: mean differences were −5.9 (−7.4, −4.4) and −7.9 (−10.9, −4.8), respectively (Fig. 3).
As shown in Table 2, E, A, and E/e′ did not show any significant change at all increments. Phenylephrine infusion rate was significantly increased at T1 vs. T2, T2 vs. T3, and T1 vs. T3: mean differences were 0.26 (0.19–0.33), 0.22 (0.14–0.29), and 0.47 (0.36–0.59) μg/kg/min, respectively. LVEF was significantly reduced in T1 vs. T3: mean difference was −4.45% (−7.52, −1.38). However, LVEDV, LVESV, and SV did not show any significant change at T1, T2, and T3. HR, CO, CVP, Ea, SVRI, the severity of MR, and the grades of diastolic function did not show any significant change at all increments.
Table 2
Hemodynamic parameters during the isoflurane dosage increments

Values are expressed as means (95% confidence interval). T1, T2, and T3: after 10-minute-exposure to isoflurane 1.0, 1.5, and 2.0 MAC, respectively.
BP = blood pressure, PAP = pulmonary arterial pressure, CVP = central venous pressure, HR = heart rate, SvO2 = mixed venous O2 saturation, CO = cardiac output, SVRI = systemic vascular resistance index, MAC = minimum alveolar concentration, e′ = peak velocity of tissue Doppler imaging mitral annulus during early relaxation, E = peak velocity of transmitral Doppler flow during early relaxation, A = peak velocity of transmitral Doppler flow during atrial contraction, DT = deceleration time, E/e′ = ratio of E to e′, LVEF = left ventricular ejection fraction, LVEDV = left ventricle end-diastolic volume, LVESV = left ventricle end-systolic volume, SV = stroke volume, Ea = arterial elastance (systolic BP/SV).
aP < 0.05 vs. T1; bP < 0.05 vs. T2.
DISCUSSION
In our study, isoflurane increments dose-dependently reduced S′ during remifentanil-based anesthesia in patients with preserved LV systolic function who have undergone cardiac surgery. The changes of S′ was 9.5%–20.0% at isoflurane dosages (1.0–2.0 MAC). This result suggests a possible decline in LV systolic performance, even in the use of clinical dosage of isoflurane. Our result well corresponds to the sevoflurane-induced decline of S′ during the remifentanil-based anesthesia in cardiac surgery patients.5 Considering the bias from the changes in LV loading condition, we increased the phenylephrine infusion rate to maintain BP and attenuate isoflurane-induced dose-dependent vasodilation. The absence of significant changes in CVP, E/e′, LVEDV, Ea and SVRI might support the avoidance of changes in vascular tone and loading condition.
The remifentanil-based anesthesia regimen has several merits including myocardial protective effect in ischemia,21 faster postoperative recovery,2223 and absence of direct myocardial depressive effect.24 However, remifentanil's lack of hypnotic effect necessitates adjuvant intravenous or volatile anesthetics (hypnotics). Considering the dose-dependent decline of LV systolic performance upon the introduction of intravenous or volatile anesthetics in our study and other studies,345 minimizing the dosage of isoflurane may be beneficial for reducing the degree of decline in the LV systolic performance during the concomitant administration of isoflurane to other anesthetic agents, as in isoflurane-supplemented remifentanil-based anesthesia in the present study, especially in patients with reduced myocardial reserve.
Our study and results advocate for the feasibility of S′ for real-time assessment of intraoperative systolic performance during cardiac surgeries.525 In most cases, TDI delineation of mitral annular motion by using TEE does not distract the attention of cardiac anesthesiologists nor increase their burden.8 The discrepancy in the significant S′ changes, compared to absence of significant change in LVEF during isoflurane increments, 1.0–1.5 MAC, supported the superiority of S′ in detecting small changes in LV systolic function.9102627
As shown in BIS-guided reduction of anesthetic requirements,2829 simultaneous monitoring of BIS and S′ may be helpful in finding an appropriate dosage of isoflurane, facilitating optimal depth of hypnosis and reducing dose-dependent decline of LV systolic performance. In our study, lower S′ and a′ and unnecessarily deep hypnosis (BIS < 40) were noted at higher-dose of isoflurane (1.5–2.0 MAC), in contrast to higher S′ and sufficient hypnosis (BIS 40–60) at lower-dosage (1.0 MAC).
By contrast, despite possible association of type I error in the analyses of variables other than S′, constant e′ and E/e′ suggested the absence of isoflurane-induced changes in the diastolic function. These results corresponded well to those of previous studies performed in healthy volunteers and cardiac surgery patients.35 However, the significant decline of a′ in isoflurane increment (14.4% decline at the increment from 1.0 to 2.0 MAC) might suggest a possible reduction in the left atrial (LA) contractile performance at the higher dosage of isoflurane. This decline can be problematic in terms of aggravating overall LV performance through LA-LV coupling especially in patients with reduced cardiac reserve.
Our study did not determine whether the observed intraoperative S′ decline was sub-clinical, clinically relevant or problematic to increase perioperative risk and outcome. In the meantime, traditional guidelines also have not accounted for anesthetic-induced reduction in intraoperative LV performance, as a negative factor for stratifying perioperative cardiac risks and outcomes in cardiac surgery.3031 Therefore, our results might be a valuable insight to determine whether anesthesia-induced intraoperative decline of cardiac performance may have to be accounted for planning cardiac surgery or managing patients undergoing cardiac surgery, regardless of its clinical relevancy.
Our study has several limitations. First, S′ values before the administration of isoflurane were not included, since application of TEE was not feasible before establishing general anesthesia.
Second, S′, e′, and a′ are not fully independent to the changes in the LV-loading condition.3233 MR flow in moderate to severe degree and vasodilation during the isoflurane increments might affect this bias. However, we excluded patients with the changes in MR degree during the increments and tried to maintain LV loading condition and vascular tone constant by employing extra-volume loading and phenylephrine infusion before and during the study. In addition, we also employed the lateral mitral annular TDI, which is more TEE-compatible and less load-dependent than the medial annular TDI.1617 Strain with speckle-tracking might be useful in overcoming load- and angle-dependence or site- and dimension-specificity for interrogation.34 However, strain also needs standardization, sophisticated equipment, and vendor specific algorithms for off-line measurements.35
Third, we could not determine the clinical relevancy of S′ decline in our study, because intraoperative S′ values in TEE have not been standardized so far. S′ values indicating the compromised LV systolic performance (≥ 7.5–8.0 cm/s in LVEF ≥ 50% and ≤ 6.7 cm/s in compromised LV function) were determined by using a different modality (TTE, rather than TEE) in previous studies with various conditions.3637 In addition, use of monoplane Simpson's method, rather than biplane, for determining LVEF. This might account for interpreting the discrepancy of between S′ and LVEF.
Fourth, due to the lack of correction to adjust their family-wise type I error, most of the positive findings in the secondary outcome measures were not enough to support our interpretation. However, S′, a′, phenylephrine infusion rate and BIS value showed sufficient power supporting our interpretations and conclusions.
In conclusion, our study showed that isoflurane increments of 1.0–2.0 MAC dose-dependently reduce LV systolic long-axis performance during isoflurane-supplemented remifentanil-based anesthesia for patients undergoing cardiac surgery. Further investigations are needed to determine whether this reduction was clinically relevant.
 XML Download