

 PDF
PDF Citation
 Print
Print


INTRODUCTION
The most common cause of meningitis is viral infection, followed by bacterial infection. Tuberculous meningitis (TBM) is a rare form of meningitis. One population-based prospective study in England reported that TBM accounted for up to 5% of all cases of meningitis, including those with unknown cause. In this study, there was only one confirmed case of TBM, and nine cases were classified as probable cases.1 A prospective study in Vietnam using the polymerase chain reaction (PCR) assay for detection showed that TB accounted for 6% of cases with confirmed infectious causes.2 However, in countries with a high prevalence of tuberculosis, such as South Korea, TBM can account for up to one-third to one-half of cases of bacterial meningitis (BM).3 TBM has a subacute clinical course, and demonstrates no specific symptoms other than those observed in patients with other forms of meningitis. TBM accounts for about 1% of cases of extrapulmonary tuberculosis (TB) disease among all tuberculosis infections. TBM has been reported to have a mortality rate of 20%–67.2% even with administration of appropriate anti-tuberculous medication.456 In particular, the mortality rate can rise as high as 67.2% among patients with acquired immune deficiency syndrome/human immunodeficiency virus (AIDS/HIV).6 This disease can cause disability and impairment in 5%–40% of patients treated with anti-tuberculosis drugs.457 Therefore, accurate differential diagnosis of TBM from other forms of meningitis is essential in countries with a high prevalence of tuberculosis.
Definitive diagnosis of TBM is made by identification of Mycobacterium tuberculosis (MTB) infection in the cerebrospinal fluid (CSF). Culture of MTB in the CSF is the most important test, with 99%–100% specificity in diagnosis, but there are some drawbacks: the sensitivity of culture varies from 17% to 81% and the test results usually take 6–8 weeks.8910 PCR testing in the CSF has a high specificity of 99%–100%, but the sensitivity ranges from 32% to 48%.8910 Although diagnosis by smear microscopy is rapid and inexpensive, it has a very low reported sensitivity of 10%–20%.8101112 Because of the limitations of these diagnostic tests, TBM diagnosis is often performed with clinical diagnosis and treatment. Clinical diagnosis and management of TBM is usually done in the case of meningitis with evidence of pulmonary tuberculosis observed on chest radiography and the results of interferon-gamma release assays (IGRAs). In addition, meningitis with no evidence of bacterial, fungal (especially Cryptococcus), or herpes simplex virus infection heightens suspicion of TBM. For a good prognosis, rapid anti-tuberculosis treatment is of paramount importance, but definitive testing is hindered by such the limitations detailed above, making the development of rapid and accurate diagnostic techniques essential.
In the differential diagnosis of meningitis, it is usually not difficult to differentiate BM and TBM because BM is characterized by an acute clinical course, high neutrophil levels, and low levels of glucose in the CSF.511 On the other hand, viral meningitis (VM) and TBM may show similar clinical courses and CSF findings in some clinical situations.1314
A case-control study conducted to evaluate the risk factors of TBM in a comparison of TBM and VM suggested four factors, namely, duration of illness, neurological stage, CSF/blood glucose ratio, and CSF protein.1314 Some studies on TBM have emphasized that hyponatremia and cranial nerve palsy are frequently associated with poor outcomes. A case-control study of hyponatremia in TBM showed that patients with hyponatremia had poor prognosis with lower Glasgow Coma Scale (GCS) scores (odds ratio [OR], 1.2; P = 0.03) and basal exudate (OR, 6.5; P = 0.001).15 In another case-control study of TBM and BM, cranial nerve palsy was singled out as a significant factor in multivariate analysis (OR, 1.980; P = 0.006) among neurological symptoms such as cranial nerve palsy, neck stiffness, seizure, stroke, and loss of consciousness.16
The aim of the present study was to devise a new scoring system including important factors and to confirm it with tree analysis to overcome exposed challenges such as the difficulty of diagnosing TBM and differentiating it from VM.
METHODS
Patient characteristics
We conducted a retrospective review of the records of all adult patients (> 18 years old) who were admitted and diagnosed with TBM or VM at Kyungpook National University Hospital, a tertiary hospital in Daegu, Korea, over the 10 years between January 2006 and December 2015. Diagnosis of TBM and VM was based on a combination of clinical, laboratory, and radiological findings, as well as response to treatment, and two infectious diseases specialists reviewed and agreed upon the diagnosis.
TBM
TBM was divided into three groups, “definite,” “probable,” and “possible.” This classification was derived from the discussion of authors for the purpose of comparison of TBM with different evidence bases and with VM.17 All patients with TBM had completed anti-tuberculosis medication for a course of at least 6 months during the follow-up period. We excluded patients who received TB medication within 1 month prior to admission to our hospital or underwent neurosurgical operation in the month before or the month following admission, and patients who had not undergone follow-up. Both patient groups in the study were patients clinically diagnosed with meningitis with negative Gram and India ink stains, negative cryptococcal antigen, and sterile bacterial and fungal cultures in the CSF. Inclusion criteria for TBM were as follows.
1) Definite TBM: TB culture or MTB PCR positive in CSF
2) Probable TBM: clinical meningitis with extra-neural TB evidence or with neuroimaging findings suggestive of TBM (hydrocephalus or tuberculoma)18
3) Possible TBM: good response with empirical TB medication after at least 6 months without evidence of other meningitis.
VM
The presenting symptoms were considered as meningitis. There was no evidence of other meningitis caused by TB, bacterial infection, fungal infection, autoimmune disease, injury, cancer, or certain drugs. The patients recovered fully with only conservative treatments and were followed up for at least 1 month at an outpatient clinic.1920
Methods
We collected information on clinical manifestations (neurological symptoms including seizures, level of consciousness, confusion, cranial nerve palsy symptoms and voiding difficulty, duration of illness, fever, neck stiffness, nausea, and vomiting), underlying diseases, laboratory findings including CSF, and radiological findings. Comparative analyses of outcomes were performed with the length of hospital stay, mortality, and neurological activity graded according to the modified Rankin Scale (mRS)2122 at the end of treatment as follows: mRS 0 = No symptoms at all. 1 = No significant disability despite symptoms; able to carry out all usual duties and activities. 2 = Slight disability; unable to carry out all previous activities, but able to look after own affairs without assistance. 3 = Moderate disability; requiring some help, but able to walk without assistance. 4 = Moderately severe disability; unable to walk without assistance and unable to attend to own bodily needs without assistance. 5 = Severe disability; bedridden, incontinent, and requiring constant nursing care and attention. 6 = Dead. The final outcomes were classified into 3 groups: “good” (mRS scores of 0, 1, or 2), “intermediate” (mRS scores of 3 or 4), and “poor” (mRS scores of 5 or 6).
Statistical analysis
The statistical analyses were performed with R statistics ver. 3.2. (R Foundation for Statistical Computing, Vienna, Austria) to identify diagnostic predictors between the TBM and the VM groups. We regarded P < 0.05 as statistically significant. ORs and 95% confidence intervals (CIs) were used. The collected data were compared using univariate and multivariate analysis by logistic regression. We developed a new weighted scoring system with significant predictive factors. A receiver operating characteristic (ROC) curve analysis was plotted to find an optimum cutoff point of the scoring system. Thereafter, a decision tree analysis was performed.
Ethics statement
As this study was a retrospective study, we collected all sample data without patient personal information to protect patient identity. The authors could not identify any patients. Therefore, our study did not require the approval of the Institutional Review Board. In addition, informed consent was waived by the board because this was a retrospective study.
RESULTS
In total, 98 patients were enrolled in this study. Forty-seven patients were classified as TBM cases, among which 7 were considered definite cases, 6 probable cases, and 34 possible cases. There were no significant differences in baseline characteristics, laboratory results, or prognosis among the definite, possible, and probable cases. The average follow-up period for patients with TBM was 11 months (range: 9.0–12.0 months). In the VM group, there were 51 patients.
With respect to the baseline clinical characteristics, the mean ages of patients in the TBM and VM groups were 45 years (38.0–65.5 years) and 38.0 years (27.5–51.0 years), respectively. Patients with TBM were significantly older than those with VM (P = 0.025). There were no significant differences in underlying diseases between the two groups with respect to hypertension, diabetes, chronic liver disease, chronic kidney disease, past TB history, malignancy, and HIV infection. The baseline characteristics and underlying conditions of the patients are summarized in Table 1.
Table 1
Clinical characteristics and outcomes of patients with TBM and VM
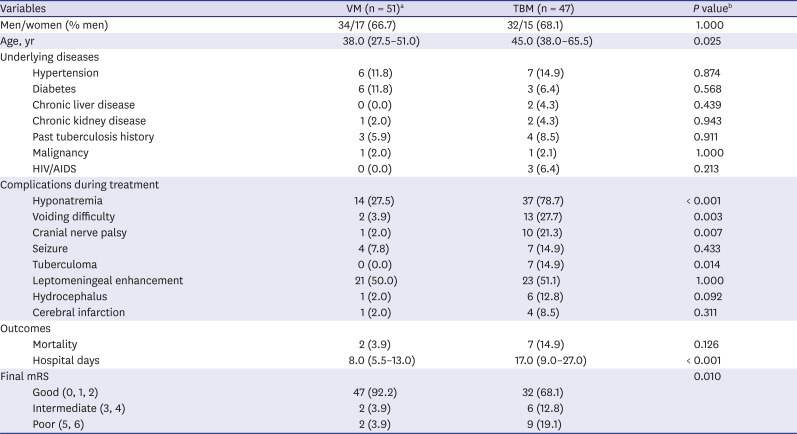
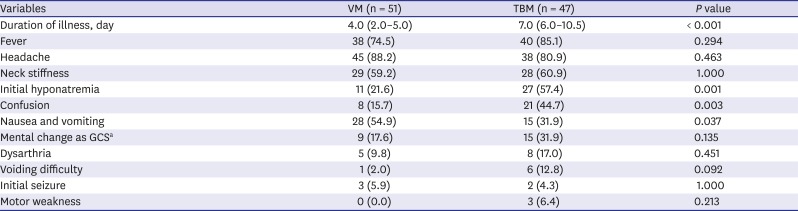
In comparison of outcomes, the mean length of the hospital stay was 17.0 days (9.0–27.0 days) in the TBM group and 8.0 days (5.5–13.0 days) in the VM group (P < 0.001). Final mRS at the time of treatment completion was also statistically different (P = 0.01). In addition, we compared clinical findings at the time of admission. Hyponatremia (serum Na < 135 mmol/L, P < 0.001), voiding difficulty (P = 0.003), symptoms of cranial nerve palsy (P = 0.007), and tuberculoma on brain imaging (P = 0.014) were found to be significantly different between the two groups. The course of illness and outcomes in patients in both groups are summarized in Table 1. Several factors related to initial manifestations on the day of admission were investigated, as listed in Table 2. Among the factors, duration of illness (P < 0.001), initial hyponatremia (P < 0.001), and confusion (P = 0.003) were predictive factors.
Table 2
Initial manifestations on day of admission in patients with TBM and VM
Comparison of laboratory findings including CSF profiles revealed no significant difference between the two groups in peripheral blood results, including IGRA and CSF white blood cell and differential counts. However, lactate dehydrogenase (LDH) and protein in the CSF were significantly higher in patients with TBM than in those with VM (P < 0.001); the mean LDH level in the TBM group was 230.5 U/L (111.0–355 U/L) compared to and 66.0 U/L (50.5–105.0 U/L) in the VM group; and the mean protein level in the TBM group was 205.5 mg/dL (119.0–321.0 mg/dL), compared to 91.0 mg/dL (52.0–131.5 mg/dL) in the VM group. The detailed results are presented in Table 3.
Table 3
Laboratory finding in serum and CSF in patients with TBM and VM
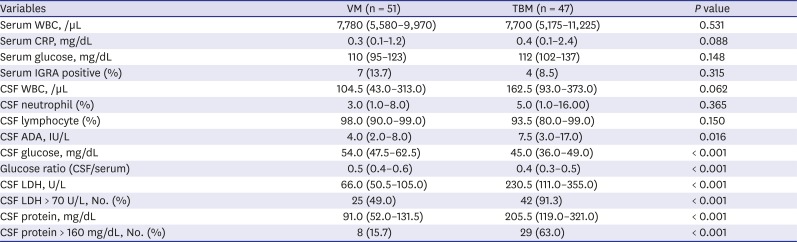
Table 4 shows all TBM patients and all VM patients, demonstrating a comparison between the 47 patients with definite, probable, and possible TBM and the 51 patients with VM. Using univariate and multivariate analysis by logistic regression, we determined the predictive factors with high ORs. Thereafter, multivariate logistic regression analysis with stepwise backward elimination was conducted. Cranial nerve palsy and voiding difficulty among the clinical features, and hyponatremia, LDH > 70 (U/L) and protein > 160 (mg/dL) in CSF among the laboratory findings were finally selected (Table 4 and Fig. 1). Table 4 also shows the results of comparison and regression analysis of only patients with definite and probable TBM with those with VM for significant predictive factors among all patients with TBM. Significant predictors of definite and probable TBM were CSF LDH > 70 U/L and CSF protein > 160 mg/dL, as well as cranial nerve palsy symptoms and confusion. The results of these two multivariate analyses were similar, with the exception of changes in the levels of statistical significance.
Table 4
Risk factors for TBM vs. VM by univariate and multivariate logistic regression
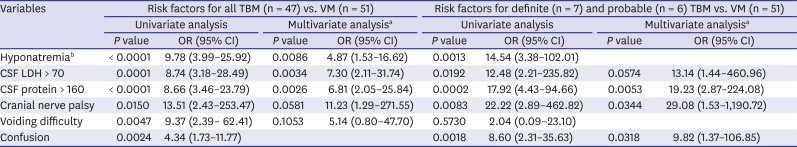
TBM = tuberculous meningitis, VM = viral meningitis, CSF = cerebrospinal fluid, LDH = lactate dehydrogenase, OR = odds ratio, CI = confidence interval.
aThe results of multivariate logistic regression analysis were the values that were used to conduct the stepwise backward elimination; bHyponatremia: serum Na < 135 (mmol/L).
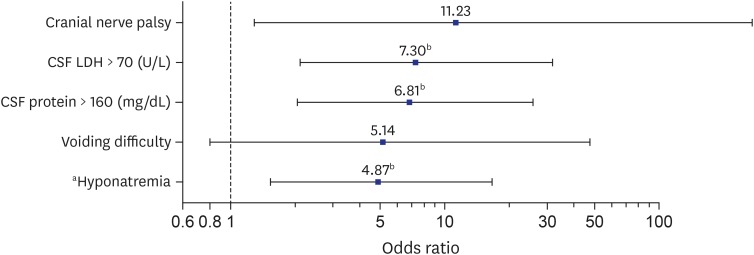
Fig. 1
OR plot for risk factors for TBM (final model).
OR = odds ratio, TBM = tuberculous meningitis, CSF = cerebrospinal fluid; LDH = lactate dehydrogenase.
aHyponatremia: serum Na < 135 mmol/L; bP ≤ 0.01.
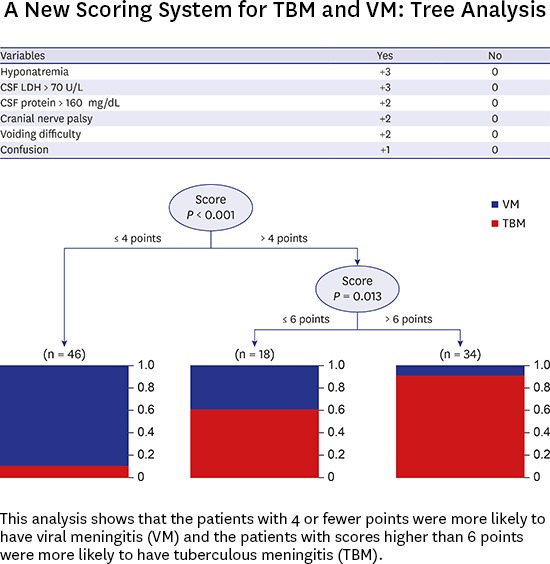
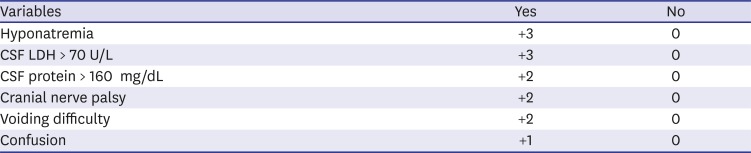
We set up a new weighted scoring system with the predictive factors (Table 5): hyponatremia, CSF LDH > 70 U/L, CSF protein > 160 mg/dL, cranial nerve palsy, voiding difficulty, and confusion. Each point was weighted from +1 to +3 and summed to obtain the largest value of area under the curve (AUC) on ROC (range: 0–13). On the ROC (Fig. 2), the optimum cutoff point was 4, the AUC was 0.901 (CI, 0.838–0.863; P < 0.001), and the sensitivity and specificity were 89.4% and 80.4%, respectively. Fig. 3 shows the decision tree analysis with the weighted scoring system (sensitivity, 80.4%; specificity, 89.4%; positive predictive value, 89.1; negative predictive value, 80.8%).
Table 5
Grade scoring following from univariate and multivariate analysis of risk factors (Total score: sum [point]) for prediction of TBM vs. VM (range: 0–13)
| Variables | Yes | No |
|---|---|---|
| Hyponatremia | +3 | 0 |
| CSF LDH > 70 U/L | +3 | 0 |
| CSF protein > 160 mg/dL | +2 | 0 |
| Cranial nerve palsy | +2 | 0 |
| Voiding difficulty | +2 | 0 |
| Confusion | +1 | 0 |
Each point was weighted from +1 to +3. Points were weighted as values that yielded the maximum AUC on ROC when the total was summed.
TBM = tuberculous meningitis, VM = viral meningitis, AUC = area under the curve, ROC = receiver operating characteristic, CSF = cerebrospinal fluid, LDH = lactate dehydrogenase.
Fig. 2
ROC curve of scoring system with risk factors for TBM from logistic regression model.
ROC = receiver operating characteristic, TBM = tuberculous meningitis, PPV = positive predictive value, NPV = negative predictive value, AUC = area under the curve, lr.eta = optimal cutoff value from logistic regression model.
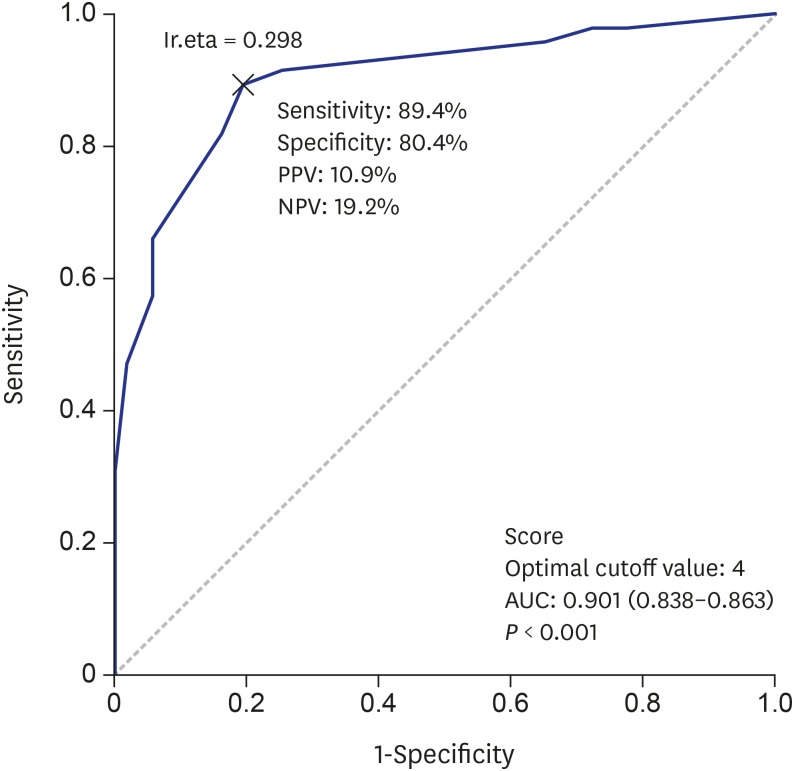
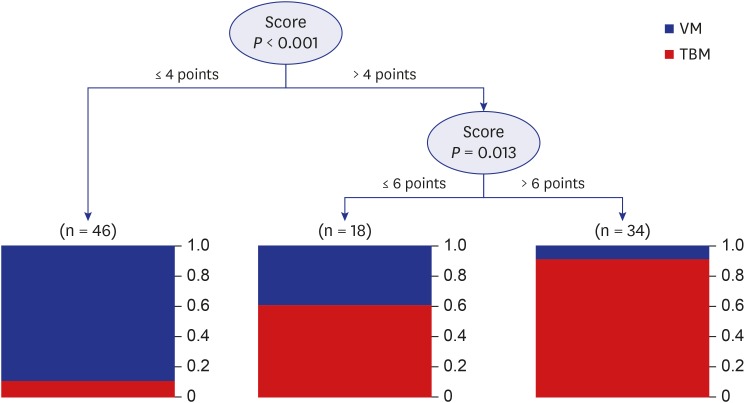
Fig. 3
Decision tree analysis in TBM (sensitivity, 80.4%; specificity, 89.4%; PPV, 89.1; NPV, 80.8%). This analysis shows that the patients with 4 or fewer points were more likely to have VM and the patients with scores higher than 6 points were more likely to have TBM.
TBM = tuberculous meningitis, PPV = positive predictive value, NPV = negative predictive value, VM = viral meningitis.
DISCUSSION
TB is a chronic granulomatous disease caused by MTB. In Korea, the annual incidence (the number of new and relapsed cases) of TB is estimated to be 80 cases per 100,000 people, and the mortality rate is 5.2 per 100,000 people with TB.23 According to the Korean guidelines for tuberculosis (3rd edition) 2017, despite recent decreases in incidence, TB remains a public health concern.24 TB affects any part of the body, although it is generally found in the lungs; however, nearly 11%–17% of TB cases are extrapulmonary. TBM accounts for approximately 1% of cases; however, it is one of the most fatal forms, resulting in death or disability despite anti-tuberculous medication.24 Mortality from TBM depends on patient age, clinical condition at admission, length of delay in starting therapy, and therapy used.92526 Delays in diagnosis and treatment are regarded as major contributing factors to poor outcomes.92526 Therefore, rapid diagnosis and early treatment before progression to later stages are crucial for a good outcome with TBM.
Until recently, diagnosis of TBM depended on various tests including X-pert MTB/rifampicin (RIF) and IGRA122728 and clinical criteria.11132930 However, the diagnostic sensitivity and specificity of these tests vary from one dataset to another. TB culture of the CSF is still accepted as the only confirmatory test. However, this culture is a time-consuming test for confirmation of TBM. For decades, there have been many descriptions of assays testing meaningful factors in TBM, such as adenosine deaminase (ADA), lactic acid and LDH in CSF, procalcitonin, serum sodium, and cranial nerve palsy symptoms, among others.151631323334 However, each factor alone cannot distinguish between TBM and other forms of meningitis. Therefore, before TB culture results can be obtained, a simple diagnostic system that synthesizes statistically meaningful predictors is necessary.
Some data and methods exist for comparison of TBM with BM. Thwaites' scoring system11 and the Lancet scoring system17 have been commonly used since the development of methods to improve diagnostic accuracy. Clinically, most cases of TBM and BM can be differentiated by CSF and serum laboratory findings. In Korea, a retrospective study was conducted to report on the differential diagnosis between TBM and BM. This study examined whether Thwaites' scoring system can be appropriately applied in Korea, and focused on TBM and BM.5
However, a differential diagnosis between TBM and VM is more difficult because both may have very similar CSF findings.1314 If it is difficult on initial CSF tests to distinguish TBM from other forms of meningitis, many physicians tend to initiate empiric anti-tuberculosis treatments as soon as TBM is considered by clinical suspicion.
For a scoring system comparing TBM with VM, the Hristea scoring system13 included CSF and clinical findings, duration of illness, and neurological status. Following this study, many subsequent published studies emphasized the importance of hyponatremia, which occurs in 30%–50% of patients in the first month of treatment,1533 as well as cranial nerve palsy, with the abducens (6th) nerve the most frequently affected.16 In the present study, we have tried to create a new scoring system for differential diagnosis between TBM and VM.
In this study, the TBM group was categorized into definite, possible, and probable cases. No significant differences were observed among these groups. Therefore, we compared all patients in the TBM group with the VM group. As emphasized in previous studies, the value of LDH, total protein in the CSF, serum sodium, and clinical manifestations including voiding difficulty and cranial nerve palsy were statistically important for the differential diagnosis of TBM and VM in our results. A comparison of patients with definite and probable TBM showed more emphasis on neurological symptoms than was observed among all TBM patients. Using the results of multivariate logistic regression analysis and recent research data, the authors devised a new scoring system in which 6 factors, including hyponatremia and cranial nerve palsy, which were emphasized in TBM, are graded for scores ranging from +1 to +3, and then summed to yield a total score. These scores were given to each factor in consideration of values of ORs and for achievement of the highest ROC value for the prediction of TBM. The CSF and blood tests included in the new scoring system are results that can be obtained quickly, and the physical examinations are easy to perform. Therefore, this new diagnostic system can be used to conduct prompt, rapid, and easy differential diagnosis.
In the present study, patients were analyzed with this scoring system and the results were rechecked and verified by decision tree analysis. Decision tree analysis is an analytical method that classifies decision rules into a tree structure and performs predictions. Therefore, this method can be easily understood and explained. To our knowledge, tree analysis has not been tried thus far; decision tree analysis is an analytical method that can easily interpret the results in clinical practice.35 In the tree analysis of this new system, VM was more likely with less than 4 points, and the probability of TBM was higher with scores of over 6 points, while more data and research will be required for 5- and 6-point samples.
There are some limitations in the current study. First, this study was conducted retrospectively and the data were obtained from medical records. Thus, clinical manifestations, especially neurological symptoms; outcomes (mRS score) or underlying diseases; and medication histories were underestimated. Second, it was difficult to distinguish between TBM and VM among patients who had scores between 5 and 6. This difficulty could probably be attributed to the small sample size of the study group. Lastly, not all patients in TBM group underwent testing or were investigated for evidence of extra-neural tuberculosis, such as with the performance of chest or abdominal computed tomography (CT). Only 19 patients with TBM (19/47; 40.4%) had one or more CT scans performed (results not shown). Despite these limitations, all of the physical examinations included in the newly designed scoring system can be easily confirmed by physical examination upon patients' visit to the hospital. Among the patients suspected of suffering from TBM, the scoring system will be the basis for a fast tuberculosis prescription, which is again expected to result in good prognosis.
In conclusion, the new scoring system proposed by the authors includes important factors that have recently been proven in the comparison of TBM and VM, and the cutoff was confirmed by tree analysis. Therefore, the scoring system is believed to be useful for easy and quick diagnosis of TBM in clinical practice. Further studies for validation of this scoring system are needed.
 XML Download