

 PDF
PDF ePub
ePub Citation
 Print
Print


INTRODUCTION
Among the global burden of infectious disease, tuberculosis (TB) is one of the leading causes of mortality. In 2011, the global incidence of TB was estimated to be 125 cases per 100,000 population. Of the incident cases, 630,000 (5.3%) were estimated to be of multidrug-resistant TB (MDR-TB) (1). The global incidence of TB has decreased slowly since 2004 perhaps owing, in part, to the efforts of the World Health Organization (WHO) through its Stop TB Strategy (2). Although considerable efforts in several countries have led to a gradual decrease in overall incidence, reports suggest that the incidence of drug-resistant TB (DR-TB) is increasing (345). In Korea, the incidence of TB has been decreasing, however, 36,089 new TB patients (71.4 cases per 100,000) were discovered in 2013, with 1,501 patients ≤ 19 years of age (4.1%) (6).
In Korea, DR-TB has decreased remarkably during the last decades as a result of successful initiatives by the National Tuberculosis Control Programme (NTP), which was launched in 1962 (7). Despite the global effort; however, TB is still a threat and is of clinical concern throughout the world, including Korea, due to the emergence of MDR-TB and extensively drug-resistant TB (XDR-TB) (78). MDR-TB is defined as TB resistant to 2 key, first-line TB drugs, isoniazid (INH), and rifampin (RFP) (4), is a growing public-health concern, and critically threatens the TB control. Without these 2 potent drugs, TB treatment becomes difficult as use of more toxic and expensive second-line anti-TB drugs is necessary. These second-line drugs have longer treatment periods, are less potent, and are less tolerated compared to first-line drugs (910). Improper management of MDR-TB will result in further drug resistance, which, in turn, will make the disease more difficult to cure, including in countries with highly developed health care systems. In Korea, MDR-TB is increasing and greater awareness about the disease and its treatment is therefore necessary (11). Data about drug resistance is important as it may be difficult for health care providers to choose proper drug combinations for DR-TB (12). Therefore, in some countries, all culture-positive, isolated TB patients undergo a drug susceptibility test (DST) (13). In Korea, the most recent TB treatment guideline by the Korean Centers for Disease Control and Prevention recommends DST to all new and retreated, culture-positive, isolated TB patients. If patients remain culture-positive after 3 months or results indicate clinically suspicious treatment failure, DST should be repeated (14). Before guideline amendment in 2011, DST was inconsistently performed between hospitals and health care providers; thus, it is challenging to compare drug resistance seasonally or regionally in a consistent manner (15).
In pediatric population, the younger the patient, the more likely TB will spread and cause extrapulmonary disease, which increases morbidity and mortality rates when disseminated disease is not promptly diagnosed and properly treated (16). In addition, it is difficult to confirm a definitive diagnosis since Mycobacterium tuberculosis is rarely isolated in specimen so is rarely bacteriologically positive by culture in pediatric population (17) and tends to show nonspecific signs and symptoms. According to Nelson and Wells (18), the proportion of pediatric TB worldwide ranged from 2.7% to 20.0% and appears to be increasing in many parts of the world. In Korea, adolescent TB is not uncommon; thus, the age distribution is different compared to low burden countries (19).
Country-wide surveillance of anti-TB drug resistance may provide an evaluative measure of NTP activity and also indicate suitable drug regimens. Pediatric TB, particularly in patients less than 5 years of age acts as a marker of recent TB transmission from adults in a community (2021). Although drug resistance surveillance is essential for planning TB control (22), data on global trends of drug-resistant pediatric TB are scarce. Therefore, DR-TB surveillance in pediatric population is critical for controlling DR-TB (2021). We analyzed the prevalence of drug-resistance among M. tuberculosis isolates from children ≤ 19 years of age following a previous study from 1999 to 2007 (19).
MATERIALS AND METHODS
Patient population
We collected data using specimens sent to the Korean Institute of Tuberculosis (KIT), a WHO-designated Supranational Reference Laboratory, from January 2007 through December 2013 for M. tuberculosis culture and DST. Specimens from patients ≤ 19 years of age are included. Previous treatment histories were not recorded in the registry. The data collected included the resident registration number of patients. If data regarding resident registration number, age or DST results were missing or insufficient, the specimen was excluded. If multiple isolates were obtained from the same patient, only the first isolate was analyzed.
Laboratory methods
Clinical specimens were cultured on a 3% Ogawa medium. All M. tuberculosis isolates were tested for drug susceptibility, which was determined by the absolute concentration method described by Canetti et al. (23), using a Lowenstein-Jenson medium (24). The drugs and their critical concentrations for resistance were as follows: INH 0.2 µg/mL, RFP 40 µg/mL, streptomycin (SM) 10 µg/mL, ethambutol (EMB) 1.5 µg/mL, kanamycin (KM) 40 µg/mL, cycloserine (CS) 30 µg/mL, para-aminosalicylic acid (PAS) 2.0 µg/mL, ofloxacin (OFX) 2.5 µg/mL, prothionamide 40 µg/mL, moxifloxacin (MFX) 2.0 µg/mL, amikacin (AMK) 30 µg/mL, and capreomycin (CPM) 40 µg/mL. Pyrazinamide (PZA) susceptibility was determined by a pyrazinamidase test (25).
XDR-TB is defined as TB that is resistant to any fluoroquinolone; and is resistant to at least one of the 3 injectable second-line drugs (AMK, CPM, and KM), in addition to MDR-TB (3). Only the first results were selected for analysis in cases where several DSTs were completed for the same person.
Statistical analysis
SPSS for Windows 18.0 (IBM Corp., Chicago, IL, USA) was used to analyze the data. A χ2 test was used to compare data from a previous study, and a linear by linear association χ2 test was used to analyze yearly data trends. A P value < 0.05 was considered to indicate statistical significance.
RESULTS
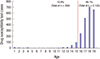
A total of 2,690 M. tuberculosis isolates collected over a span of seven years were tested for drug susceptibility. Among the 2,690 cases, 297 (11%) were excluded because data were insufficient to analyze. For the final analysis, 2,393 cases (89%) were used. Insufficient data included inaccurate age and inaccurate DST results. Among the 2,393 cases included in the final study, yearly distribution was n = 703 in 2007, n = 553 in 2008, n = 383 in 2009, n = 159 in 2010, n = 202 in 2011, n = 204 in 2012, and n = 189 in 2013 (Table 1). The male to female sex ratio was 1.51:1. Age distribution is shown in Fig. 1. There were 260 (10.9%) cases in the ≤ 15 years of age group, and 2,133 (89.1%) cases were in the > 15 years of age group. The median age was 17.2 years.
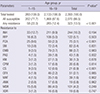
Table 1
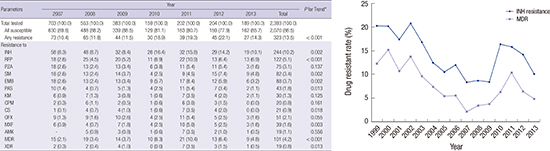
Trend of anti-TB drug susceptibility, 2007–2013
Values are presented as number (number/total number × 100%).
TB = tuberculosis, INH = isoniazid, RFP = rifampin, PZA = pyrazinamide, SM = streptomycin, EMB = ethambutol, PAS = para-aminosalicylic acid, KM = kanamycin, CPM = capreomycin, CS = cycloserine, OFX = ofloxacin, MXF = moxifloxacin, AMK = amikacin, MDR = multidrug-resistant, XDR = extensively drug-resistant.
*P value < 0.05.
Fig. 1
Age distribution of total drug susceptibility tested cases. Red line divides cases by age 15 or less and over age 15.
The drug resistance patterns for each of the anti-TB drugs are summarized in Table 1. Among the 2,393 cases in this study, resistance to one or more drugs was 323 (13.5%), and resistances to each drug were as follows: INH, n = 244 (10.2%); RFP, n = 122 (5.1%); EMB, n = 88 (3.7%); PZA, n = 75 (3.1%); MDR-TB, n = 101 (4.2%); and XDR-TB, n = 19 (0.8%). In 2007, the prevalence of any resistance to one or more drugs was 10.4%. In 2012, that prevalence increased in a statistically significant manner to 22.1% (P < 0.001). The prevalence, however, decreased thereafter. Drug resistance to INH, RFP, EMB, PZA, SM, CS, and MFX also significantly increased over time (P < 0.05). The prevalence of INH resistance peaked in 2010 and then decreased thereafter. In addition, the prevalence of RFP resistance peaked in 2011. Unfortunately, the prevalence of MDR-TB also significantly increased from 2.1% in 2007 to 4.2% in 2013, with a peak prevalence of 10.4% in 2011. The prevalence of XDR-TB has increased significantly (P < 0.05) as well, with a peak prevalence of 3.5% in 2011 (Table 1).
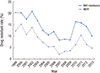
Fig. 2 shows the resistance patterns of INH, and MDR-TB from a previous study from 1999 to 2013. According to Fig. 2, the resistance rate of INH decreased from 1999 to 2007, increased from 2007 to 2013 showing very high prevalence rates from 2010 to 2012. MDR-TB and XDR-TB also demonstrated similar patterns. Data of 2007 in the previous study were conducted from January to August 2007. The data of 2007 shown in Fig. 2, however, are from this study conducted from January to December 2007.
Fig. 2
Trend of drug resistant rate of TB throughout 1999–2013. The yellow line shows the trend of INH resistance and the blue line shows the trend of MDR.
TB = tuberculosis, INH = isoniazid, MDR = multidrug-resistant.
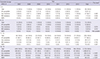
Adolescent TB accounts for a significant portion of pediatric TB. We divided the data into 2 groups (≤ 15 years of age and > 15 years of age). The results of this data analysis are summarized in Table 2. The resistance rate for any drug was 22.3% (58/260) for the ≤ 15 years of age group and 12.4% (265/2,133) for the > 15 years of age group. The resistance rate was significantly higher in the ≤ 15 years of age group. The resistance rate of INH was 12.7% in the ≤ 15 years of age group, and was 9.9% in the > 15 years of age group. Moreover, the resistance rate of RFP was 6.2% in ≤ 15 years of age group, and was 5.0% in > 15 years of age group. INH and RFP, the main drugs for TB treatment, both demonstrated higher resistance rates in the ≤ 15 years of age group, but lacked a statistically significant difference between the 2 age groups. The resistance rate of PZA and CS was significantly higher in the ≤ 15 years of age group. Other drugs showed a lack of between groups differences. MDR-TB rate was 5.8% (15/260) in the ≤ 15 years of age group and 4.0% (86/2,133) in the > 15 years of age group, and showed no significant difference between the 2 groups. Moreover, the XDR-TB rate was 1.2% (3/260) in the ≤ 15 years of age group and 0.8% (16/2,133) in the > 15 years of age group, with no significant difference in the rate between the 2 groups (Table 2).
Table 2
Anti-TB drug susceptibility of Mycobacterium tuberculosis by age
Values are presented as number (number/total number × 100%).
TB = tuberculosis, INH = isoniazid, RFP = rifampin, PZA = pyrazinamide, SM = streptomycin, EMB = ethambutol PAS = para-aminosalicylic acid, KM = kanamycin, CPM = capreomycin, CS = cycloserine, OFX = ofloxacin, MXF = moxifloxacin, AMK = amikacin, MDR = multidrug-resistant, XDR = extensively drug-resistant.
*P value < 0.05.
The data was subdivided into more age groups because the resistance rate in the younger age group (≤ 5 years of age) may reflect the current TB management status, and may be a marker of recent TB transmission from an adult in the community as mentioned above. The initial 2 age groups were divided into four subgroups, 1–5 years of age, 6–10 years of age, 11–15 years of age, and 16–19 years of age (Table 3). There were 46 (1.9%) cases in the 1–5 years of age group, 15 (0.6%) were in the 6–10 years of age group, 199 (8.3%) were in the 11–15 years of age group. In summary, there were 260 (10.9%) cases in the ≤ 15 years of age group, and 2,133 (89.1%) in the > 15 years of age group (Fig. 1, Table 3).
Table 3
Trend of anti-TB drug susceptibility from 2007 to 2013 divided by age
The total prevalence of any resistance to one or more drugs was 58.7% (27/46) in the 1–5 years of age group, 20.0% (3/15) in the 6–10 years of age group, 13.7% (28/205) in the 11–15 years of age group, and 12.4% (265/2,133) in the 16–19 years of age group. Resistance to one or more drugs during the 7 years study period showed no significant difference in the 1–5 years of age group, 6–10 years of age group, and 11–15 years of age group but 16–19 years of age group, however, showed a significant increase (P < 0.001) from 2007 to 2013.
The prevalence of INH resistance was 15.2% (7/46) in the 1–5 years of age group, 20% (3/15) in the 6–10 years of age group, 11.2% (23/205) in the 11–15 years of age group, and 9.9% (211/2,133) in the 16–19 years of age group. The INH resistance rate during the seven-year study period showed results similar to those of any resistance to one or more drugs.
In addition, the prevalence rate of MDR was 10.9% (5/46) in the 1 to 5 years of age group, 0% (0/15) in the 6–10 years of age group, 4.9% (10/205) in the 11–15 years of age group, and 4.0% (86/2,133) in the 16–19 years of age group. The MDR rate during the 7-year study period also showed similar result compared to any resistance to one or more drugs (Table 3).
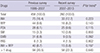
The drug resistance rate was compared with the previous study (Table 4) (19). The drug resistance rate of the ≤ 15 years of age group showed no significant difference compared to the previous study. The total resistance rate did not demonstrate a significant increase or decrease compared to the previous study.
Table 4
Comparison of anti-TB drug susceptibility with previous survey (≤ 15 years of age)
DISCUSSION
In this study, we investigated changes in pediatric TB drug resistance rates among specific age groups. In addition, we compared drug resistance rates with a previous study. The total number of tested patients decreased throughout the duration of this study. During the study period (2007 to 2013), new TB notification cases decreased as well. The number of new TB notification cases in the 0 to 19 years of age was n = 2,735 in 2007, n = 2,351 in 2008, n = 2,518 in 2009, n = 2,430 in 2010, n = 2,432 in 2011, n = 1,850 in 2012, and n = 1,501 in 2013 (26). The total decrease in TB cases over this time period may have been a result of the decrease in total tested patients. There was no difference in the rate of DR-TB between the present and previous studies. The total rate of any DR-TB, however, increased throughout the present study period (2007 to 2013). In particular, the MDR-TB and XDR-TB rates, as well as INH and RFP, increased significantly during the present 7-year study period. INH resistance was 4.1% in China and 6.9% globally, and MDR-TB was 4.6% in China, and 2.9% globally (2728). In the recent study of overall DR-TB in Korea, the rate of any drug resistance was 19.4%, MDR-TB 8.3%, and XDR-TB 3.2% overall (29). DR-TB, however, did not show a tendency to increase (29). There are limited epidemiological reports on global pediatric DR-TB. In hospital-based pediatric studies, 28.6% resistance to at least one of the four first-line anti-TB drugs was recorded in China, 20.47% in India, and 15.5% in South Africa (27). In the present study, resistance to any drug was 13.5%, INH resistance was 10.2%, MDR-TB was 4.2%, and XDR-TB was 0.8% overall. Our data shows lower resistance rates compared to the hospital-based data from China, India, and South Africa, but higher resistance rates compared to global statistics. Remarkably, although the rate of resistance to any drug was lower than that of China, the INH resistance rate was higher. As INH is a key TB treatment drug and may serve as an indicator of drug resistance (7), this result is alarming. In the present study, the overall resistance rate to any drug (13.5% vs. 19.4%), MDR-TB (4.2% vs. 8.3%), and XDR-TB (0.8% vs. 3.2%) were lower than rates from study in adults (29), but showed a 58.7% rate of resistance to any drug in the 0–5 years of age group in our study. Even allowing for the difficulty of isolating M. tuberculosis in younger age and selection bias of data collection due to selective DST, this is an alarming result for the status of TB management in Korea. The high drug resistance rate in younger age groups may reflect the total management status of TB throughout the country. In addition, children less than 5 years of age who are infected with TB are at higher risk of developing disseminated forms of TB, including military TB and TB meningitis, which are frequently associated with greater morbidity and mortality. Moreover, DR-TB among children, including treatment regimen choice, has been inadequately studied, and the cure rate of DR-TB is low (118). Therefore, DR-TB among children is an important issue. More studies investigating risk factors of DR-TB among children, the causes increased resistance rate, and cause of higher resistance rates in younger age group are needed.
The drug resistance rate of one or more drugs was significantly higher in the ≤ 15 years of age group compared to the rate in > 15 years of age group. Among TB drugs, PZA exhibited a significantly higher resistance rate in the younger age group. This result seems to be the main cause of the difference between the two groups (Table 2). PZA is an important component of first-line TB treatment and is also important for treating MDR-TB. Little is known, however, about the global prevalence of PZA resistance. Mutations in the pnaA gene are known to be the mechanism of resistance to PZA but the mechanism of action and resistance to PZA in M. tuberculosis are unclear (30). In a recent study, the prevalence of PZA resistance was 0%–9% in cases of drug-sensitive TB, and 31%–89% among MDR-TB isolates. The study found a significant increase in the prevalence of PZA-resistant TB with increased resistance to other drugs (3031). Further studies studying the prevalence, cause, and relation between MDR-TB and PZA-resistant TB are warranted. Further prospective studies should also be conducted that include past treatment history.
Previously treated TB cases are known to have higher rates of resistance to anti-TB drugs (29). Previously treated TB cases are also more common in the adult populations. According to Kim et al. (32), the rate of previously treated TB was the highest in the 80 to 89 years of age group. No patient was previously treated in the ≤ 19 years of age group. Our study, however, showed high resistance rate in pediatric TB without past treatment history. We conclude that this may be the cause of the higher overall resistance rate. If the DR-TB patients, who are difficult to cure, only went through DST, and drug-sensitive TB patients did not have DST, then the drug resistance rate may be inflated compared to the actual rate. The TB drug resistance rate is a critical determinant of treatment success. Patients having DR-TB need longer treatments with more drugs, and tend to have suboptimal treatment outcomes, especially if diagnosed with MDR-TB or XDR-TB. The treatment success rate of DR-TB is only about 50% globally (1). Moreover, DR-TB costs more to cure. According to Kang et al. (33), in Korea, DR-TB treatment costs are 7 to 22 times that of managing drug-susceptible TB patients. In particular, the resistance rate of INH shown in our study may be considered when choosing specific treatments for cases of latent TB where the status of drug resistance is unknown.
When treating DR-TB, early diagnosis, treatment, and isolation are critical factors in controlling TB on a national level. It takes about 8 weeks to obtain results, however, from the traditional DST method. Recently, genotypic DST has provided results within a few days, and is used widely due to its speed (29). Additionally, as mentioned above, the largest source of pediatric infection of TB comes from adults. Adult TB status should be controlled thoroughly to reduce the pediatric TB drug resistance rate. Therefore, directly observed treatment, which is not currently implemented throughout Korea, should be introduced. Moreover, if the past medical history of patients and their family members can be provided with the specimen when they are being referred for M. tuberculosis culture and DST, patterns of DR-TB can be analyzed more precisely using the laboratory data.
This study has several limitations. First, information about previous TB treatment history was lacking, so patient data could not be classified into new or previously-treated groups. As drug resistance rates were significantly higher in patients with a history of previous treatment (29), further study is required including previous treatment history. Moreover, as the source of infection in younger TB patients is likely to be adults, the data regarding the adult's source of infection is important for analyzing pediatric TB resistance rates. Second, the regional data was not analyzed in the present study and should be included in future studies. Third, before 2011, DST was conducted selectively by physicians, and not all specimens underwent the same process of analysis. Moreover, we only analyzed the positive culture specimens. Considering that the culture-positive rate is low in children (17) and DST was selectively performed before 2011, as mentioned above, the actual TB drug resistance rate may be lower than what was been shown in the present study.
In conclusion, the TB drug resistance rate remains high in Korean children and increased significantly during the duration of the present study from 2007 to 2013. Although this study has limitations, the prevalence of resistance was 4.2% in MDR-TB and 10.2% in INH-resistant TB. This means that DR-TB should be considered when treating pediatric TB patients even if they have not been previously treated. In addition, we recommend using an INH and RFP combination therapy for treating latent TB rather than INH alone. Future research should include accurate surveillance of DR-TB status throughout the country, and past history of study participants. Furthermore, more precise diagnostic tools of DR-TB in children, effective vaccines, and new drugs that will effectively treat DR-TB should be developed. This will, however, require a significant amount of time and resources.
 XML Download