

 PDF
PDF Citation
 Print
Print


INTRODUCTION
Multidetector computed tomography (MDCT) is one of the most commonly used medical imaging modalities. Fast image acquisition and high spatial resolutions has made computed tomography (CT) a workhorse of diagnostic medical imaging. Meanwhile, there is inevitable radiation exposure from CT examination. The widening of clinical applications and utility of CT has resulted in complex multiphase scanning and increased scan ranges that exacerbate the CT radiation problem. Benner and Hall reported with small but significant risk from radiation doses of routine CT examinations in 2007 (1). Another report in 2009 estimated about 29,000 future cancers could be related to CT scans performed in the US in 2007, which is equivalent to approximated 2% of annual US cancer (2). Currently, emerging concerns regarding the hazard from medical radiation including CT examinations has been suggested (13456).
There were many reports about the CT techniques and image-processing algorisms for reduced radiation doses (78910). In spite of these promising researches, all CT machines used in present daily practices are not compatible with these latest scanning or post-scanning processes. Furthermore, these new methods and imaging processing require further validation in various clinical settings. In the meantime, practical strategies for reduction of radiation exposure from CT scans in daily practice are needed. These include the modification of imaging acquisition protocols and replacement of CT examinations with other ionizing radiation-free examinations. In this step, the role of radiologists is important, as a supervisor of imaging quality control and guidance for selection of proper imaging tools. Their efforts could be observed on longitudinal changes of radiation doses from CT scan. To observe variation of this change according to different CT examinations and different institutions’ clinical settings, multicenter study is desirable. The aim of this study is to observe the longitudinal changes of CT radiation doses of various CT protocols and to estimate the long-term efforts of supervising radiologists to optimize CT protocols and reduce medical radiation.
MATERIALS AND METHODS
Study subjects and CT protocol selection
Twelve tertiary and secondary hospitals participated in this study. These hospitals are equipped with more than one MDCT. In consensus meeting of 12 radiologists of participating hospitals, they chose CT protocols to be included in this study. They were all board-certificate radiologists and had experiences more than 10 years for sub-special radiology division. After selection of three body parts, abdomen, chest and brain, nine representative CT protocols of three body parts were chosen. These were the major CT examinations of daily practices: dynamic-contrast-enhanced CT of the liver (CTliver), routine abdomen CT (CTabdomen), non-enhanced CT for urolithiasis (CTstone), routine chest CT (CTchest), high resolution chest CT (HRCT), low dose chest CT (LDCT), non-enhanced brain CT (CTbrain), and CT angiography of the brain (CTAbrain). In addition, three CT protocols with high impact on radiation exposure had included; CT urography (CTU), coronary CT angiography (CTAcoronary) and CT perfusion study of the brain (CTPbrain). As a result, 11 CT protocols of three body parts were chosen to be assessed in this study.
Data collection
For each protocols, two sets of CT dose data were collected; first in March 2007, just after the widespread adaptation of MDCT in participating hospitals, and before publication of a pivotal paper by Brenner and Hall (1), and second in March 2010, after 3-year clinical experiences with the installed MDCTs. Using a radiology database, 10 CT examinations were randomly selected per CT protocol and CT machine in each time, and their CT protocol and radiation dose data were collected. Because the different body habitus and different CT protocols, pediatric patients younger than 17-year-old were excluded. Image quality of the included CT scans was evaluated by each hospital radiologist, and if the image quality was suboptimal, that CT examination was excluded. If there were less than 10 CT examinations during 10 days, all of them were collected. Collected data included patient age, sex, the volume CT dose index (CTDIvol) of each phase, number of phases, dose length product (DLP) of each phase, and used CT machines. After calculation of total DLP of each CT examinations, effective doses (ED) were calculated from total DLP with coefficient factors (1112). CT machines were divided into 3 types according to the technical features; CT with less than 64 detector rows (type A CT), CT with 64 or more detector rows (type B CT) and dual source CT (type C CT). To differentiate the effect of the protocol changes and that of CT machine changes, a subgroup was defined: If the same CT machines were used both in 2007 and 2010 for same protocols in same hospitals, the dose data from these CTs were defined as group 1.
Statistical analysis
After assessment of descriptive statistics of CT dose data in 2007 and 2010, three radiation measurements, mean values of CTDIvol, total DLP and ED, were compared according to protocols. This comparison was done in total data and group 1 data. In addition, comparison of radiation exposures according to CT machines was made. For group 1 data, we analyzed the changes of CT radiations of individual hospitals, to observe the effect various clinical settings to radiation dose reduction. Null hypotheses of no difference were rejected if P values were less than 0.05. All analyses were performed with R (version 3.2.2, R Foundation, Vienna, Austria; https://www.R-project.org) statistical packages.
RESULTS
CT dose and hardware data collection
Four hospitals did not have the CT dose report of individual patients at 2007 and their data could not be collected. As a result, CT radiation dose data of 2007 was collected from 20 CT machines of 8 hospitals. For 2010, data from 32 CT machines of 12 hospitals were collected (Table 1). 12 CT machines had been newly introduced after March 2007. In summary, 14 CT machines were used both in 2007 and 2010 for same protocols in same hospitals, and the dose data from these CTs were defined as group 1. CT machines were constituted with 14 models of four venders. The numbers of CT machines were summarized in Table 1. A total 1,101 CT dose data of 2007 (586 men and 515 women) and 2,391 CT dose data of 2010 (1,248 men and 1,143 women) were collected. Mean age of 2007 was 56.22 years and 2010 was 54.77 (P = 0.012). Among them, 996 data of 2007 (533 men and 463 women) and 1,008 data of 2010 (531 men and 477 women) were included in group 1 (mean age 56.34 in 2007 and 54.0 year old in 2010, P = 0.001). All dual source CTs were introduced after 2007, so there was no Type C CT in the group 1.

CT dose changes according to protocols
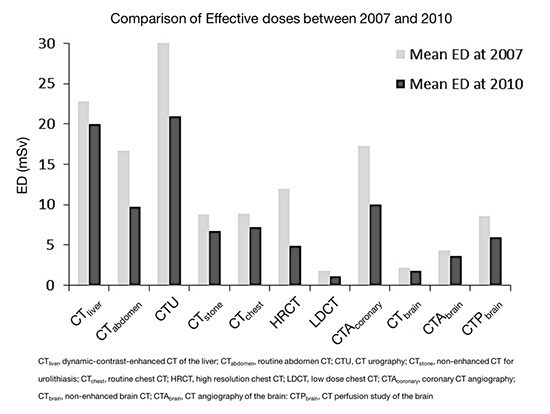
Mean ED of 10 CT protocols had decreased during the 3 years both in total data and group 1 (Table 2). Except for CTAbrain in group 1, the decrement was statistically significant (Table 2). In the total data (Fig. 1A), CTabdomen CTU, HRCT, and CTAcoronary showed almost more than 30% decrement of ED. This tendency was observed similarly in group 1 data (Fig. 1B), except for CTAbrain. CDTIvol; and total DLP (Table 3) were also decreased in 10 protocols in 2010 as compared with 2007 in all patients (Fig. 2A) and group 1 (Fig. 2B). CTDIvol of CTliver did not show significant change. All protocols showed more than 10% decrement of mean total DLP during the three years (Fig. 2A). Among them, CTabdomen, HRCT, and CTAcoronary showed more than 40% decrement of total DLP. In group 1 (Fig. 2B), all protocols except for CTbrain showed more than 10% decrement of CDTIvol and total DLP. CTabdomen, CTU, CTstone, HRCT, LDCT, CTAcoronary and CTPbrain showed 20% or more decrement of total DLP in group 1. CTliver, CTabdomen, and HRCT showed more decreased total DLP than CDTIvol. On the contrary, three head CT protocols (CTbrain, CTAbrain, and CTPbrain) showed larger decrement of CTDIvol than total DLP.
Table 2
Comparison of effective doses between 2007 and 2010: total data and group 1 data
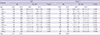
CTliver, dynamic-contrast-enhanced CT of the liver; CTabdomen, routine abdomen CT; CTU, CT urography; CTstone, non-enhanced CT for urolithiasis; CTchest, routine chest CT; HRCT, high resolution chest CT; LDCT, low dose chest CT; CTAcoronary, coronary CT angiography; CTbrain, non-enhanced brain CT; CTAbrain, CT angiography of the brain: CTPbrain, CT perfusion study of the brain.
Fig. 1
Mean effective doses according to 11 CT protocols. (A) Total data comparison between 2007 and 2010. (B) Comparison from the data of same CT scanners from 2007 and 2010 (group 1).

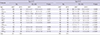
Table 3
Comparison of CTDIvol and total DLP between 2007 and 2010

CTliver, dynamic-contrast-enhanced CT of the liver; CTabdomen, routine abdomen CT; CTU, CT urography; CTstone, non-enhanced CT for urolithiasis; CTchest, routine chest CT; HRCT, high resolution chest CT; LDCT, low dose chest CT; CTAcoronary, coronary CT angiography; CTbrain, non-enhanced brain CT; CTAbrain, CT angiography of the brain: CTPbrain, CT perfusion study of the brain.
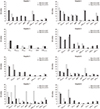
Fig. 2
Percentage changes of the volume CT dose index (CTDIvol) and total dose-length product (DLP) of 11 CT protocols. (A) Total data comparison between 2007 and 2010. (B) Comparison from data of same CT scanners from 2007 and 2010 (group 1). Note the discrepancies between reduction of CTDIvol and total DLP in CTliver, CTabdomen, and HRCT. A similar trend was observed in group 1.

CT radiation dose changes according to machines
Type A CT showed generally smaller decrement of mean ED of each protocol than those of type B CT (Table 4). Only the CTabdomen showed statistically significant decrement (P < 0.001). CTAbrain showed significantly increased ED during 3 years. On the other hand, ED of type B CT had showed significantly decreased ED during 3 years, including CTAbrain.
Table 4
Comparison of effective doses between 2007 and 2010: type A and B CTs
CTliver, dynamic-contrast-enhanced CT of the liver; CTabdomen, routine abdomen CT; CTU, CT urography; CTstone, non-enhanced CT for urolithiasis; CTchest, routine chest CT; HRCT, high resolution chest CT; LDCT, low dose chest CT; CTAcoronary, coronary CT angiography; CTbrain, non-enhanced brain CT; CTAbrain, CT angiography of the brain: CTPbrain, CT perfusion study of the brain.
CT radiation dose changes of each hospital
Fig. 3 showed the 3-year changes of mean EDs of 8 hospitals in group 1. There was general tendency of decrement of mean EDs during three years. However, the level of changes were various according to hospital and protocols. Hospital 7 showed profound decrement of mean EDs in almost all protocols. Hospital 3 showed little change of mean EDs during the 3 years (Fig. 3). Hospital 4 showed overt decrement of mean ED in chest CT examinations, while other CT protocols showed little change. Other hospitals showed mixed nature of changes.
DISCUSSION
In this study, we observed radiation exposures from CT in 2007 and 2010, and found significant reduction of radiation exposures from various CT protocols in three major body parts during 3 years. These reductions were acquired while maintaining image quality that was suitable for clinical practice. There are several published guidelines and recommendations for CT examinations, which includes indications of CT examinations, recommended standard scanning protocols, and diagnostic reference levels (45131415161718). In addition to these guidelines and recommendation, there are well-known variable ways to reduce radiation from CT scans, including usage of an automated exposure control system and modification of acquisition parameters such as peak voltage (kVp), mAs, pitch, section thickness and number of phases (3516192021). Radiologists should be familiar with these strategies, and apply these in clinical settings. Recently, there were several reports which showed the value of CT dose reduction which were led by radiology departments (1922). Another research suggested the value of the effect of education of a one-day workshop for the radiologists and technicians (23). However, previous studies observing the CT radiation exposure were cross sectional studies and short term follow up studies (4142223). On the other hand, this multi-center study focused on the longitudinal changes of radiation doses from variable CT protocols. With three-year interval of this study, we could assess the cumulative efforts of radiologists and physicians for the reduction of medical radiation from CT examinations during three years.
Among three major CT dose parameters, CTDIvol were decreased almost all protocols, which means a general tendency toward optimization of scanning parameters such as kVP, mAs, and pitch. Although decrement of total DLP had a similar trend with that of CTDIvol in general, there were variable discrepancies between decrement of CTDIvol and total DLP. For example, CTabdomen showed more decrement of total DLP than CTDIvol. It suggested the optimization of scanning ranges and phase numbers as well as acquisition parameters to reduce radiation exposures. On the other hand, brain CT protocols showed less decrement of total DLP than those of CTDIvol, which means, widened coverage and/or additional scanning phases. This result suggested variability of CT protocol optimization according to clinical demands. Three CT protocols (CTU, CTPbrain and CTAcoronary) were included this study, because it had relatively high radiation exposure. Changes of these protocols showed significant reduction of CTDIvol, total DLP and ED. Because, those protocols were relatively new clinical application of CT, optimizing the radiation doses of them were important. Our result showed significant reduction of radiation exposures of those protocols, suggesting collective efforts and concerns of medical society.
CT radiation dose reduction was observed prominently in newer CT scanner (type B CT, MDCT ≥ 64 channel). After 3-year clinical experiences, CT protocols performed in those newer CT scanner had been tailored according to radiation dose, while maintaining image quality. On the other hand, type A CTs showed modest decrement during three years, except for routine abdomen protocols. Type A CTs generally were introduced earlier than type B CTs, which meant more clinical experiences with type A CTs than type B CTs. Difference of clinical experience between the type A and B CTs could result difference of degree of CT dose optimization in 2007, and there could be smaller room for optimization during 3 years. It should be addressed that type A routine abdomen CT showed significant decrement of mean ED. This suggests that sustained efforts to reduce of radiation exposures and careful CT protocol optimization could be effective without newer machines or software. This finding was concordant with the previous report that optimization of CT protocols required comprehensive approach and sustainable feedback (22).
Whereas a general tendency of radiation dose decrement was observed, the change of CT radiation exposures in each hospital was heterogeneous. Especially, the changes of mean ED during three years were quite different between hospital 3 and 7. There were substantial decrement of hospital 7 whereas little change of hospital 3 during 3 years. This finding suggested the importance of a hospital’s clinical setting and attending radiologists as a factor of CT radiation exposures. Different clinical settings and clinical demands of variable hospitals could result different protocol optimization of each protocol. However, more efforts to decrease the inter-hospital variability of radiation exposure from CT scans, standard scanning protocols and recommendations are needed.
Issues about medical radiation hazard are not a simple problem of radiation exposure. ALARA principle is a basic strategy for medical radiation optimization (2021). There is some trade-off between image quality and radiation dose, and the balance between the acceptable image quality and lowest level of radiation exposure is a goal of CT protocol optimization (8192122). Under the ALARA principle, the target level of CT dose reduction is ‘as reasonably as achievable.’ It could be an ambiguous standard, but a sensible approach for complicated decision making. To achieve this goal, the role of radiologists to supervise CT protocols and image quality is important. Radiologists who have interest in about the medical radiation hazard, especially CT which are responsible for majority of medical radiation, should monitor radiation exposure from CT and manage appropriately with the ALARA principle. On the other hand, some radiologists may put more importance on the image quality and amount of information rather than cutting radiation off. This luxury could result in sub-optimization of CT scans regarding the point of justification of medical radiation. It could be another source of variations between hospitals, and educational programs regarding the CT radiation exposures and reduction strategies are needed. In addition, four hospitals did not collect the patient radiation dose data in 2007, and all of them had dose data in 2010. Individual record of medical radiation exposure is another important topic for managing medical radiation exposure. Feedback would be achievable if baseline data were available. It could be another indirect effort to medical radiation reduction.
There are some limitations in this study. First, the retrospective nature of this study could induce some biases. For this reason, we did not have enough data for patients’ body habitus, which could be an important source for radiation dose. However, we collected a large number (more than 3,000) of patient CT radiation dose data in multiple hospitals in two time points. Although we included 11 representative protocols in three body parts, other CT scanning protocols and CT examinations of other body parts were not evaluated. The evaluation of scanning parameters such as kVp, mAs, pitch and others were not obtained, those were closely associated with dose optimization (52021). However, the purpose of this study was to observe changes of radiation dose itself during three years as a cumulative result of complex protocol optimization, rather than detailed changes of scanning parameters. In addition, we assessed CDTIvol which can be considered a collective measurement of effect of those parameters. There was no objective validation of acquired CT images quality, such as a noise level comparison (5). However, attending radiologists in each hospital validated the image quality at the time of data collection. In addition, the balance between the tolerable image quality and reduced radiation doses were validated by the clinical reading in daily practices in each hospital. This study observed the radiation dose from a single CT examination. However, the cumulative radiation dose of each patient after repeated examinations is one of the emerging concerns in medical radiation exposure. Further study is needed.
In conclusion, this study showed the efforts of radiologists and medical society for reduction of CT radiation exposure during 3 years. However, the amount of decrement varied according to CT protocols, CT machines and different hospitals, including clinical settings. Adjusting protocols according to clinical requests or special circumstances of some patients, while maintaining acceptable image quality, is needed. To balance the level of clinical needs and ALARA principle, radiologists should be familiar with variable factors influencing CT radiation doses, and active collaboration between radiologists and referring physician are needed. In addition, there should be feedback for patient radiation dose levels for CT examinations, followed by efforts to reducing radiation exposures.
 XML Download