

 PDF
PDF ePub
ePub Citation
 Print
Print


INTRODUCTION
Hyperglycemia is frequently observed in hospitalized patients, whether previously diagnosed with diabetes or not (123). Because hyperglycemia is associated with poor clinical outcomes (1), it is important to achieve good glycemic control in hospitalized patients. The American Diabetes Association recommended that target pre-meal blood glucose levels (BGLs) would be 100-140 mg/dL and target random BGLs be less than 180 mg/dL for non-critically ill hospitalized patients (2). However, hospitalized patients receiving anti-diabetic agents are likely to have a high probability of experiencing hypoglycemia (3). For example, hypoglycemia was reported in up to 26% of patients treated with basal insulin (4). Additionally, hypoglycemia in these patients has caused more fatalities, and extended hospital stays are related with an increased risk of death (56). For these reasons, there is a need to develop an optimal control algorithm for insulin therapy protocols to ensure that BGLs remain within the target range without increasing the risk of hypoglycemia.
Many studies have been conducted to develop better insulin therapy protocols for non-critically ill hospitalized patients (789). Basal-bolus insulin therapy (BBIT), which consists of basal, prandial, and correction insulin doses, has been shown to be superior to sliding-scale insulin therapy (SSIT) in achieving glycemic control (78). Furthermore, in contrast to SSIT, the BBIT protocol also demonstrated fewer complications such as wound infection, pneumonia, bacteremia, respiratory failure, and acute renal failure in patients with type 2 diabetes (T2D) undergoing general surgery (8). However, the incidence of hypoglycemia with BBIT was higher than that with SSIT (8). In addition, up to 30% of patients with chronic renal failure have experienced hypoglycemia when a different BBIT protocol was applied (9). Therefore, it is still necessary to develop more effective and safer insulin therapy protocols for hospitalized patients with non-critical illnesses. However, finding the optimal BBIT protocol is highly challenging, as it is very difficult to compare different insulin therapy protocols, either in the same environment or among various patient states. To resolve this, in-silico simulation methods with virtual patients could provide an effective evaluation environment for glucose control prior to clinical studies, thus reducing the risks and costs of clinical evaluation (10111213141516).
This paper reports the first trial of an in-silico patient model that can evaluate basal insulin therapy protocols for hospitalized patients with T2D based on representative models (131416) and our earlier efforts (111217). The model was validated by examining whether it could reproduce the results of a representative clinical trial adopting a BBIT protocol (which we call BBIT1) and an SSIT protocol (referred to as SSIT1) (7). Using the model, two in-silico studies were conducted. The first compared two BBIT protocols with different insulin adjustment plans (BBIT1 [7] and a variant protocol referred to as BBIT2 [8]). The second study evaluated two different initial total daily insulin doses (iTDDs) (either 0.5 unit/kg/day or 0.25 unit/kg/day) of BBIT2 in in-silico patients exhibiting different levels of renal function. With the aid of the developed model, these studies can be used to determine the more effective insulin therapy protocol and ensure the efficacy and safety of the protocol in extreme conditions, in advance of clinical trials.
MATERIALS AND METHODS
In-silico model design
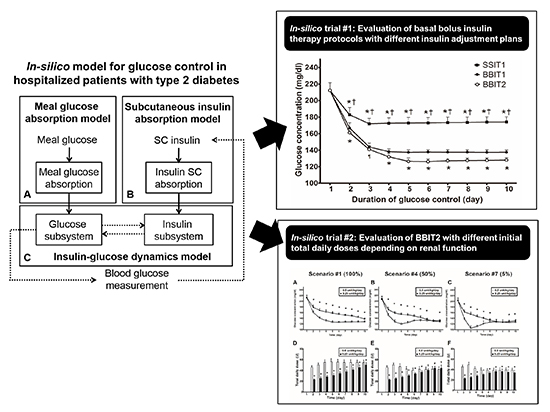
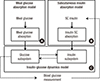
The in-silico model was developed to simulate postprandial states in hospitalized patients with T2D and evaluate subcutaneously injected BBIT protocols. The model is composed of three submodels that represent meal glucose absorption, insulin absorption, and glucose-insulin dynamics, respectively. Fig. 1 illustrates the overall scheme of the proposed model. One input, meal glucose, is ingested and absorbed through the gastrointestinal tract (Fig. 1A), whereas a second input, subcutaneously injected insulin, is absorbed through subcutaneous tissue (Fig. 1B). The absorption of meal glucose and subcutaneously injected insulin is represented as individual inputs in the insulin-glucose dynamics model (Fig. 1C). As a consequence, the BGL is mainly enhanced by the inputs of meal glucose absorption and endogenous glucose production, and controlled by the insulin level. The insulin level is mainly increased by the inputs of subcutaneous insulin absorption and insulin secretion, and controlled by the BGL.
Model equations
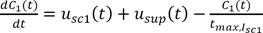
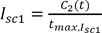
In this study, the model equations were based on clinically validated models (131416). The meal simulation model (14) was mainly adapted to represent the meal glucose absorption model (Fig. 1A) and insulin-glucose dynamics model (Fig. 1C). In addition, the subcutaneous insulin absorption model (16) was extended to represent the subcutaneously injected insulin absorption (Fig. 1B). The absorption of subcutaneously injected bolus insulin (i.e., rapid-acting insulin or regular insulin) was represented by a two-compartment chain (C1 and C2, mU/kg) (16): where usc1 and usup (mU/kg/min) denote the subcutaneous administration of bolus and pre-meal supplemental insulin, respectively, and tmax,Isc1 is the time-to-maximum monomeric insulin absorption. The time-to-maximum absorption of rapid-acting insulin is set to 55 minutes (16), whereas that of regular insulin is set to 275 minutes. Isc1 (mU/kg/min) is the absorption rate of bolus insulin.

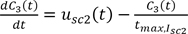
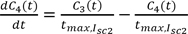
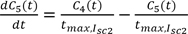
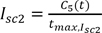
The absorption of subcutaneously injected basal insulin such as long-acting insulin is represented by a three-compartment chain (C3, C4, and C5, mU/kg): where usc2 (mU/kg/min) is the subcutaneous administration of basal insulin. The time-to-maximum absorption of basal insulin (tmax,Isc2) is assumed to be ten times that of rapid-acting insulin (i.e., 550 minutes); Isc2 (mU/kg/min) is the absorption rate of basal insulin.
From Equations (3) and (7), the total subcutaneous insulin absorption rate (Isc) can be written as: where the compensation factor cf is set to 2.5 based on the ranges of insulin secretion and plasma insulin in (14).
Consequently, the final insulin subsystem can be represented as: where Il and Ip (pM/kg/min) denote the insulin masses in the liver and blood, respectively; I (pM/L) is the insulin concentration, S (pM/kg/min) is insulin secretion, VI (L/kg) is the distribution volume of insulin, and m1, m2, m3, and m4 denote the rate parameters. To convert insulin units (mU/kg/min to pM/kg/min), the conversion factor (m5) was assigned a value of 6.945 (18). Detail information of the other equations is provided in (14).


In-silico hospitalized patients with T2D
With the proposed model, 100 in-silico hospitalized patients with T2D were generated based on earlier studies (781314). Their body weights were randomly drawn from the normal distribution of T2D reported in (1314). Similarly, the initial BGLs were randomly selected based on preceding clinical trials (78), and the random BGLs for each in-silico patient with no treatment at admission were considered to be in the range 140-400 mg/dL to represent the hyperglycemic state of hospitalized patients (8). Because it is assumed that the in-silico patients are in a good state, with no complications such as infection, pneumonia, or acute renal failure, all other parameter values are the same as those of the subjects with T2D in (14).
Validation of the In-silico patient model
Since few clinical data of hospitalized patients with T2D were accessible, the proposed model was validated by comparing its performance with BBIT1 and SSIT1 as used in a representative clinical trial (7). Briefly, in BBIT1, the iTDD is set to 0.4 unit/kg/day if the BGL at admission is 140-200 mg/dL or 0.5 unit/kg/day if the BGL at admission is 201-400 mg/dL (7). Half of the iTDD of insulin is administered basally with long-acting insulin, and the other half is administered as pre-meal bolus insulin, with rapid-acting insulin given prior to breakfast, lunch, and dinner in equal doses (7). The basal insulin dose is adjusted according to the fasting or mean BGL, and a correctional dose is added to the pre-meal bolus insulin dose (7). In SSIT1, the regular insulin is administered according to the BGL measured before each meal and at bedtime; the detailed insulin therapy protocols are described elsewhere (7).
In-silico trial #1: evaluation of two BBITs with different insulin adjustment plans
Using the model, the efficacy of BBIT2 (8) was compared with that of BBIT1 (7). In BBIT2, the iTDD of insulin is set to 0.5 unit/kg/day. Whereas BBIT1 adjusts the basal insulin dose only, BBIT2 adjusts both basal and bolus insulin doses (8). Both protocols use the same method to calculate the pre-meal correctional insulin dose (78).
In-silico trial #2: evaluation of BBIT2 with different iTDDs depending on level of renal function
Using the model, the efficacy and safety of BBIT2 with different iTDDs (0.5 unit/kg/day vs. 0.25 unit/kg/day) was compared at different levels of renal function. To evaluate the effect of insulin therapy protocols for different levels of renal function, seven scenarios were generated in which each virtual patient exhibited different levels of insulin metabolism according to renal function (100% [scenario #1], 90% [#2], 75% [#3], 50% [#4], 25% [#5], 10% [#6], and 5% [#7] of normal renal function). As a rule of thumb, the insulin metabolism should be decreased by 25% when the glomerular filtration rate (GFR) is 10-50 mL/min, and by 50% when the GFR <10 mL/min (19). Adopting this recommendation, the mathematical equations reflecting subjects' renal function in (14) were modified as follows. It was assumed that the original GFR value in (14) represents the normal renal functioning rate. Parameters quantifying peripheral (Vmx) and hepatic (kp3) insulin action in scenarios #2 (90%) and #3 (75%) are the same as those in scenario #1 (100%) if the GFR is greater than 50% of the normal renal functioning rate. The parameters related to insulin action were increased by 25% when renal function remained between 10%-50% of normal function, i.e., scenarios #4 (50%), #5 (25%), and #6 (10%). Additionally, the parameters in #7 (5%) were increased by 50% when the renal function was less than 10% of its normal value. It was assumed that the other conditions were the same as those established for the in-silico patients with normal renal function in scenario #1 (100%). In each scenario, the efficacy and safety of BBIT2 with two different iTDDs (0.5 or 0.25 unit/kg/day) were tested.
Numerical method and analysis
Simulations were carried out in Matlab (MathWorks, Natick, MA, USA). The following assumptions were made for the simulation: the initial conditions are at the steady state, and the initial time of simulation is 05:00; in-silico patients consume 70 g of meal glucose at 07:00, 13:00, and 19:00. In addition, it was assumed that the basal insulin is injected at 06:00 and the bolus insulin is injected immediately prior to each meal. For SSIT1, regular insulin is injected four times a day, immediately before each meal and once again at night (01:00). BGLs are measured four times a day (i.e., before each meal and at night), and are presented as the daily mean BGL.
The efficacy- and safety-based goal is to achieve fasting and pre-meal BGLs between 100-140 mg/dL whereas simultaneously avoiding hypoglycemia. The primary outcome measures are to determine differences in glycemic control between regimens as measured by daily mean BGL (7). The secondary outcomes include differences in indices for assessing the efficacy of different insulin protocols between regimens, as measured by random BG values obtained throughout all simulation days; The time in the target range was represented as the percentage of time during which the BGL is within the target range (100-140 mg/dL), the hypoglycemic (BGL <70 mg/dL) range, and the hyperglycemic (BGL >180 mg/dL) range. In addition, the mean amplitude of glycemic excursions (MAGE) (20) and average daily risk range (ADRR) (21) were used as the indicators of BGL variability. The MAGE, which is the best metric for evaluating glycemic variability, was obtained by average difference between consecutive peaks and nadirs of BG values observed over ten days (20). ADRR, as a measure of glycemic risk, is associated with risks of both hypoglycemia and hyperglycemia (21). Low, moderate, and high risk are defined as ADRR <20, 20< ADRR <40, and ADRR >40, respectively (21).
Statistical analysis
Statistical analysis was performed using GraphPad Prism 5 (GraphPad Software, San Diego, CA, USA). The daily mean BGL and TDD of insulin were compared using one-way ANOVA followed by the Tukey test. The outcome measures in the each protocol were compared using two-way ANOVA with a Bonferroni post-test. P<0.05 was considered to be statistically significant.
RESULTS
Validation of the In-silico patient model
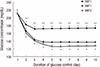
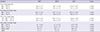
Fig. 2 and Table 1 show the daily mean BGLs and overall outcome measures for BBIT1 and SSIT1 in 100 in-silico patients. As depicted in Fig. 2, the daily mean BGLs at admission (day 1) were identical at 212±9 mg/dL for both treatment protocols. Compared to those measured under SSIT1, daily mean BGL under BBIT1 decreased rapidly from day 2 (183±9 mg/dL vs. 167±6 mg/dL; P<0.001). The daily mean BGL under SSIT1 did not reach the target range, exhibiting high BGL, whereas that with BBIT1 decreased further until achieving the target goal on day 4 (173±6 mg/dL vs. 138±3 mg/dL at day 4; P<0.001). On the final day, the daily mean BGL under SSIT1 was significantly higher than that for BBIT1 (174±6 mg/dL vs. 137±3 mg/dL at day 10; P<0.001). From day 4-10, the average daily BGL with SSIT1 was 173 mg/dL, whereas that with BBIT1 was 138 mg/dL.
As shown in Table 1, the efficacy of BBIT1 is significantly higher than that of SSIT1. Less time was spent in a hyperglycemic state and above the target range under BBIT1 than under SSIT1, whereas the time spent within the target range with BBIT1 was longer than that for SSIT1 (Table 1). No hypoglycemic events were observed throughout the study. With respect to glucose variability, the MAGE was also significantly higher for SSIT1 than for BBIT1. Moreover, the ADRR for SSIT1 was over 20, whereas that for BBIT1 was below 20, indicating moderate and low risk, respectively.
In-silico study #1: evaluation of two BBITs with different insulin adjustment plans
The results obtained from the comparison of BBIT1 and BBIT2 are also shown in Fig. 2 and Table 1. As illustrated in Fig. 2, the daily mean BGL values under BBIT2 and BBIT1 were 161±5 mg/dL and 167±6 mg/dL, respectively, on day 2 (P<0.001). On day 4, the daily mean BGLs under both BBIT2 and BBIT1 were within the target range (132±4 mg/dL vs. 138±3 mg/dL; P<0.001). After attaining the target range, the daily mean BGL with BBIT2 decreased further, whereas that with BBIT1 remained similar to the level observed on day 4 (128±3 mg/dL vs. 137±3 mg/dL at day 10, P<0.001).
As described in Table 1, BBIT2 exhibited better performance than BBIT1 in terms of time spent in a hyperglycemic state (P< 0.001), time above the target range (P<0.001), and time within the target range (P<0.001). The time spent below the target range with BBIT2 was slightly longer than that for BBIT1. The ADRRs of both BBIT1 and BBIT2 were below 20, which indicates low risk (P<0.001). No hypoglycemic events were observed throughout the study.
In-silico study #2: evaluation of BBIT2 with different iTDDs depending on renal function
Supplementary Fig. S1 and S2 show the simulation results obtained with two different iTDDs (0.5 or 0.25 unit/kg/day) in in-silico patients with various levels of renal function. The simulation results of three representative scenarios (scenarios #1 [100%], #4 [50%], and #7 [5%]) are shown in Fig. 3. The overall daily mean BGLs with the standard-iTDD regimen (0.5 unit/kg/day) reached the target range more quickly than those with the reduced-iTDD regimen (0.25 unit/kg/day) (Fig. 3A-C). The standard-iTDD regimen reached the target range on day 4 in scenario #1 (100%), day 3 in scenario #4 (50%), and day 2 in scenario #7 (5%), whereas the reduced-iTDD regimen only reached the target range on day 10 (all scenarios).
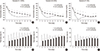
In scenario #1 (100%), the overall daily mean BGL under the reduced-iTDD regimen was higher than that for the standard-iTDD regimen, except on the first day (Fig. 3A). On the final day, the mean BGLs were 138±3 mg/dL and 128±3 mg/dL in the reduced- and standard-iTDD regimens, respectively (P<0.001, Fig. 3A). Across all 10 days, the TDDs with the reduced-iTDD regimen were lower than those with the standard-iTDD regimen, and on the final day, the TDDs were 49.9±4.6 unit and 54.7±4.4 unit in the reduced- and standard-iTDD regimens, respectively (P<0.001, Fig. 3D).
In scenario #4 (50%), the reduced-iTDD regimen exhibited a higher overall daily mean BGL and lower TDD until day 8, compared with the standard-iTDD regimen (Fig. 3B). However, the daily mean BGL with the reduced-iTDD regimen was lower than that under the standard-iTDD regimen on days 9 and 10 (128±4 mg/dL vs. 132±3 mg/dL on the final study day in the reduced- and standard-iTDD regimens, respectively, P<0.01; Fig. 3B). On days 9 and 10, the TDDs in the reduced-iTDD regimen were higher than those for the standard regimen (44.1±6.0 unit vs. 42.3±4.4 unit on the final day in the reduced- and standard-iTDD regimens, respectively, P<0.001; Fig. 3E).
In scenario #7 (5%), the daily mean BGL for the first three days was higher under the reduced-iTDD regimen than the standard-iTDD regimen, with the largest difference appearing on day 3 (155±7 mg/dL vs. 106±8 mg/dL in the reduced- and standard-iTDD regimens, respectively, P<0.001; Fig. 3C). After day 3, this difference gradually decreased, and the daily mean BGLs became comparable on day 7 (128±5 mg/dL vs. 128±9 mg/dL on day 7 in the reduced- and standard-iTDD regimens, respectively, P=NS; Fig. 3C). On the final day, the daily mean BGLs were 130±6 mg/dL and 126±8 mg/dL for the reduced- and standard-iTDD regimens, respectively (P<0.001, Fig. 3C). Across all 10 days, the TDDs were lower with the reduced-iTDD regimen than with the standard-iTDD regimen (34.3±4.2 units vs. 39.2±3.3 units on the final day in the reduced- and standard-iTDD regimens, respectively, P<0.001; Fig. 3F). In particular, as shown in Fig. 3A-C, the initial decrease in daily mean BGL with the standard-iTDD regimen was faster for lower levels of renal function. In scenario #7 (5%), hypoglycemia (defined as BGL <70 mg/dL) occurred in 75% of patients using the standard-iTDD regimen, and 0.4%±0.5% of the total time was spent in a hypoglycemic state.
DISCUSSION
This study has developed a model for hospitalized patients with T2D based on clinically validated models (131416). The proposed model was validated with the results obtained from 100 in-silico patients. Using this model, two different BBIT protocols (78) were compared, and it was shown that BBIT2 was superior to BBIT1 in achieving the target range. In addition, it was determined that BBIT2 with a reduced-iTDD regimen is a more effective means of glycemic control in patients with severe renal dysfunction than a standard-iTDD regimen.
As shown in Table 1 and Fig. 2, the results indicate that the efficacy of BBIT1 is higher than that of SSIT1, which is consistent with the results of a previous clinical study (7). This suggests that the proposed model could reproduce the glucose response to insulin protocols used in previous clinical trials (7). The key difference between BBIT1 and BBIT2 is the algorithm used for daily insulin adjustment. In BBIT1 (7), only the basal insulin dose was adjusted, whereas both basal and pre-meal insulin doses were varied in BBIT2 (8). An in-silico study using the proposed model demonstrated that BBIT2 is more effective in maintaining target BGL than BBIT1. This result is quite novel and informative because, to the best of our knowledge, no preceding study has compared BBIT1 and BBIT2.
Patients with renal insufficiency experience hypoglycemia more frequently than subjects with normal renal function (22). Several reasons for this effect have been suggested, including reduced insulin clearance, reduced gluconeogenesis, and increased risk of gastroparesis in patients with renal insufficiency (222324). To analyze the effect of BBIT with respect to diverse renal functions, BBIT2 was simulated with both a reduced insulin dosage (TDD of 0.25 unit/kg/day) and standard dosage (TDD of 0.5 unit/kg/day) (9) in in-silico patients. A similar clinical study showed that the reduced-iTDD regimen was associated with a lower risk of hypoglycemia than the standard-iTDD regimen, without exhibiting any differences in glycemic control (9).
An in-silico study demonstrated that patients with severe renal insufficiency (GFR of just 5% of normal renal function) suffered fewer hypoglycemic events under the reduced-iTDD regimen than with the standard-iTDD regimen. This is similar to the results of an earlier study (9), even though the BBIT protocol and target BG range in the two studies are different. Although the standard-iTDD regimen reached the target BG range earlier than the reduced-iTDD regimen, the difference in BGLs on the final day was modest. As a result, the reduced-iTDD regimen could be more appropriate for patients with severe renal impairment.
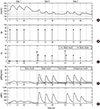
The proposed model has some drawbacks. As it was not validated using real clinical data, the results should be interpreted with care. In fact, in clinical studies (78), BBIT2 produced far more hypoglycemic events than SSIT1, but the model did not reproduce this phenomenon. Additionally, the model did not generate the expected rate of hypoglycemia, except for subjects with severe renal insufficiency. One possible explanation for this discrepancy is that the surgical condition, complications, or non-critical illnesses described in preceding studies (78) have not been incorporated into the proposed model. In addition, the model is based on a mean model, so most parameters are fixed to the average T2D vectors (14). Thus, it will be important to better reflect the patient population. A second explanation is that, as in other simulation studies (152526), some un-modeled dynamics may exist. There are some differences in physiological parameters, such as the pharmacokinetics of insulin, between a real clinical setting and our simulations. Since few studies have been conducted on the pharmacokinetics of insulin in hospitalized patients, several assumptions were made to develop a simplified model. To demonstrate that these assumptions are reasonable, simulation results for randomly selected patients with a body weight of 96.5 kg and an initial BGL of 231 mg/dL are shown in Fig. 4. The ranges of insulin secretion (Fig. 4D) and insulin concentration (Fig. 4E) yielded by this Esimulation are comparable with those described in an earlier study (14). Another possible reason is that "day to day variations" are not reflected in the model, although the β-cell responsiveness and insulin sensitivity to glucose during the day are accounted for (14). This may be why the simulation results exhibit a flat BGL profile after attaining the target BG range, as shown in Fig. 2.
Despite the limitations, the proposed model is useful to examine the physiological changes of each hormone in a separate organ depending on exogenous inputs, as well as to compare the efficacy and safety of BBIT protocols at once before clinical trials. In addition, with more quantitative clinical data, the model can be refined to better simulate the physiological response of the patients. In clinical environments, day to day variations in dietary intake, variability of insulin action, concomitant physical and psychological stress, and physical activity can cause hyperglycemia or hypoglycemia. Based on the current model, day to day variations in dietary intake can be reflected by varying parameters such as meal size and meal time. In this way, overly dangerous and unethical situations in real clinical settings, such as long-term fasting, can be implemented. In addition, more variables considering the factors that affect insulin sensitivity, such as body fat or drugs that change insulin sensitivity (i.e., steroid based drugs), can be reflected in the model, which would further increase its accuracy. Physical activity can be reflected as a variable in the determination of correctional dose, since increased physical activity improves insulin sensitivity. iTDD can be also calculated by dividing the step-by-step state of patients' physical activity. Moreover, psychological stress has been reported to increase blood pressure and postprandial glucose levels in patients with diabetes (27). Although hyperglycemia in patients due to hospitalization was reflected, the specific mechanisms of stress hormones such as epinephrine or cortisol have not been reflected in the current model. These should be considered in future model developments. As stress hormones are related to insulin resistance and reduced pancreatic beta cell function (28), they are implicitly reflected in the model as reduced insulin sensitivity and pancreatic beta cell function. In addition to the aforementioned factors, various clinical uncertainties can affect BGL. Therefore, consistent research to clinically elucidate these effects and reflect new physiological responses is needed. In future, the model may be further improved to consider new physiological responses such as the dawn phenomenon (an abnormal elevated BGL in early morning) depending on circadian cycles (29).
Moreover, the model has a great potential to be extended in various clinical situations before clinical trials. Firstly, the advanced model would help decision making processes for treatment or insulin-dosing by evaluating BBIT protocols in various situations that could occur in clinical settings, such as gastrostomy feeding, or critical illness. For example, BBIT is not always necessary in all patients. BBIT may be either essential or optional to the patients, depending on their condition. If a patient should be maintained in a fasting state prior to surgery, the infusion of pre-meal bolus insulin may not typically be required, as the patient cannot take a meal, although the injection of basal insulin may be a prerequisite to prevent hyperglycemia. With the advanced model, various combinations of BBIT would be tested in a fasting state, as the BBIT protocols can be easily altered in the model. In addition, when patients receive enteral or parenteral feeding because of the occurrence of critical illness, the model equations of glucose absorption in the gastro-intestinal tract could be replaced with those for critically ill patients (30). We have experience of the in-silico evaluation of insulin therapy protocols for critically ill patients who have received enteral nutrition and intravenous glucose (11).
Moreover, the model can be utilized to develop new treatments and drugs for glucose management in hospitalized patients with T2D before clinical trials, which facilitates cost-effective clinical trials. For example, the effects of both BBIT and oral medication would be examined using the model. Most recently, sodium-glucose co-transporter-2 inhibitors, approved as an oral antidiabetic drug, have emerged to produce glycosuria and reduce the plasma glucose concentration (31). To examine the mechanism of this novel anti-diabetic drug action, model parameters quantifying the glucose threshold or glomerular filtration rate can be adjusted.
In conclusion, an in-silico model of glucose management in hospitalized patients with T2D has been developed and validated by comparing SSIT1 and BBIT1 from earlier clinical trials (7). In-silico trials demonstrated that BBIT2 (8), which includes daily adjustments of the "total" insulin dose, exhibited better glucose control than BBIT1 (7), which adjusts only the "basal" insulin dose. It was also observed that patients with severe renal insufficiency were more vulnerable to rapid decreases in BGLs, resulting in hypoglycemia. Thus, a gradual increase in TDD, starting with a reduced dosage, is required in patients with severe renal insufficiency. This finding from our in-silico studies was also observed in previous clinical trials (9). To the best of our knowledge, the model in this research is the first to evaluate various insulin therapy protocols for hospitalized patients with T2D. The proposed model represents a first step in developing an advanced model that can be widely used to design and analyze insulin therapy protocols and to support the development of new treatments for glucose management prior to clinical study without risk of danger or high costs.
 XML Download