

 PDF
PDF ePub
ePub Citation
 Print
Print


INTRODUCTION
Elevated serum low density lipoprotein cholesterol (LDL-C) concentration is known to be associated with the development of cardiovascular disease (CVD) in observational epidemiologic studies and interventional clinical trials (1-3). Based on this established relationship, the US National Cholesterol Education Program Adult Treatment Panel III (NCEP ATP-III) has recommended the reduction of LDL-C level as the primary target of lipid-lowering therapy (4).
Although the β-quantification is a reference method to measure serum LDL-C concentration, the method has been seldom used because ultracentrifugation is not available in most clinical laboratories (5). Recently, a new generation of homogeneous assay has been introduced as an alternative to the β-quantification method to measure serum LDL-C concentration, and these techniques have been certified by the Cholesterol Reference Methods Laboratory Network (CRMLN) (6, 7). In actual clinical practice, instead of measuring LDL-C level directly, serum LDL-C concentration has been frequently estimated with Friedewald's formula using total cholesterol, high density lipoprotein cholesterol (HDL-C) and triglyceride concentrations (8). However, Friedewald's formula cannot be used when triglyceride concentration is ≥ 400 mg/dL (8), and if there is some disagreement between calculated and measured LDL-C concentrations (9-13). For example, it has been reported that the agreement between calculated and measured LDL-C levels decreases as serum triglyceride concentration increases, even when plasma triglyceride concentration is < 400 mg/dL. In the Framingham offspring study, the proportion of estimated LDL-C levels within 10% of the LDL-C value determined by β-quantification decreased to 59% when triglyceride concentration was between 301-400 mg/dL (14).
To date, the validity of Friedewald's formula to estimate serum LDL-C concentration has not been determined in a general Korean population. Therefore, the aims of this study were to investigate the validity of Friedewald's formula in estimating serum LDL-C concentration and to propose a triglyceride range within which Friedewald's formula can be used to estimate directly-measured serum LDL-C concentration without significant error, according to nationally-representative population data from the Korea National Health and Nutrition Examination Survey (KNHANES)-IV conducted in 2009.
MATERIALS AND METHODS
KNHANES IV
The KNHANES is a nationwide, population-based, cross-sectional health survey that was first performed in 1998. KNHANES IV was conducted from July 2007 to December 2009. The subject population included all households recorded by the 2005 Population and Housing Census in Korea. The entire nation was divided into 29 ranks based upon administrative district and housing type. Relevant households from 200 districts were randomly selected through stratified and multistage probability sampling. As rolling survey methods were used for sampling, the sample for each year was a probability sample representing all parts of the country, and each rolling sample had homogenous and independent characteristics.
The KNHANES IV questionnaire was composed of a health interview, health examination, and nutrition survey. Of a total of 31,705 KNHANES IV subjects selected to participate in the health interview and health examination survey, and 23,632 (74.5%) subjects completed the surveys. Of a total of 27,050 subjects selected to participate in the nutrition survey, 22,137 (81.8%) completed the survey. All included participants provided written informed consent (15).
Study subjects
This study utilized data from KNHANES IV-3, which was conducted in 2009. Of the 12,722 individuals that were sampled, 10,533 participated in the nutrition survey. Among those who participated in the survey, 1,992 subjects aged 20 yr and older who had measured total cholesterol, HDL-C, triglyceride, and directly-measured LDL-C values were enrolled. Additionally, 63 subjects with a triglyceride concentration greater than 400 mg/dL were excluded from the analysis. Finally, 1,929 subjects (946 males and 983 females) were enrolled in the current study.
Study methods
Body mass index (BMI) was calculated as weight in kilograms divided by the square of height in meters. Blood samples were collected from all subjects after at least 8 hr of fasting. Specimens were immediately centrifuged, aliquoted, frozen at -70℃, and sent to a central laboratory (NeoDIN Medical Institute, Seoul, Korea) where they were analyzed within 24 hr. Fasting plasma glucose concentration was measured using an automated analyzer (Hitachi Automatic Analyzer 7600, Hitachi, Tokyo, Japan) with an enzymatic assay. Serum insulin concentration was measured using a gamma counter with an immunoradiometric assay (Biosource, Nivelles, Belgium). To estimate insulin sensitivity, the updated computer model HOMA2-IR was used, which is based on fasting glucose and insulin concentrations (16). Serum lipid concentrations, including total cholesterol (Pureauto S CHO-N; Daiichi, Tokyo, Japan), HDL-C (Cholestest N HDL; Daiichi), and triglycerides (Pureauto S TG-N; Daiichi), were measured by enzymatic method using an automated analyzer (Hitachi Automatic Analyzer 7600, Hitachi), and estimated LDL-C concentration was calculated using Friedewald's formula. Serum LDL-C concentration was directly measured by an enzymatic homogenous assay with Cholestest-LDL (Sekisui Medical, Tokyo, Japan). Since, in the case of HDL-C, the domestic laboratory involved in measurement changed during the second year of the survey periods, and the two institutes used different analyzing methods and devices, some differences existed with respect to the HDL-C measurement results. Commutable frozen serum samples were prepared and sent to the Lipid Reference Laboratory, Centers for Disease Control in the USA. These data were compared with those from both domestic laboratory institutes, and a conversion equation to adjust for the differences was formulated to obtain the true HDL-C value. The total coefficient of variation (CVs) for total cholesterol was 1.0%-2.8% at level 1 (mean 104 mg/dL) and 1.0%-2.8% at level 2 (mean 269 mg/dL). Total CV for HDL-C was 0.9%-2.0% at level 1 (mean 35 mg/dL) and 1.6%-3.2% at level 2 (mean 74 mg/dL). Total CV for triglycerides was 0.9%-3.1% at level 1 (mean 79 mg/dL) and 0.9%-2.6% at level 2 (mean 204 mg/dL). In the case of directly-measured LDL-C, the total CV was 1.1%-5.8% at level 1 (mean 56 mg/dL) and 1.5%-6.3% at level 2 (mean 132 mg/dL).
The presence of CVD (stroke or coronary heart disease) was assessed according to the answers each subject provided during the health interview. Hyperlipidemia was defined by the presence of one of the followings: 1) total cholesterol ≥ 240 mg/dL or triglyceride level ≥ 200 mg/dL (1); 2) currently taking lipid-lowering agents; or 3) a self-reported history of hyperlipidemia. Similarly, hypertension was defined by the presence of one of the followings: 1) systolic or diastolic blood pressure ≥ 140/90 mmHg; 2) currently taking anti-hypertensive medications; or 3) a self-reported history of hypertension. Diabetes mellitus was defined by the presence of one of the followings: 1) fasting glucose concentration ≥ 126 mg/dL (≥ 7.0 mM/L); 2) currently taking glucose lowering agents; 3) a self-reported history of diabetes; or 4) HbA1c level ≥ 6.5% (measured using high performance liquid chromatography from BIO-RAD VARIAN™ II, BIO-RAD, Hercules, CA, USA) (17). Current treatment for hyperlipidemia or hypertension was defined as medication ingestion more than 20 days per month. In terms of treatment for diabetes, both insulin and oral agents were included.
Statistical analysis
All data are presented as mean ± SD or proportion. To compare the differences between two groups, Student's t-test and the chi-squared test were used. Multiple linear regression analysis was used to determine the independent associations between discrepancies in LDL-C concentrations and clinical or laboratory measurements, where the discrepancies were termed "delta%" and were determined using the equation delta%. In this study, we defined a significant difference in LDL-C concentration as a delta% value greater than 10%. To determine the serum triglyceride cutoffs above/below which the difference between the estimated LDL-C and directly-measured LDL-C concentrations begin to differ statistically, polynomial regression models were used. KNHANES IV-3 used a complex sampling design and constructed sample weights to adjust for non-response according to demographic factors after the surveys were completed. Analyses for complex survey data were performed using STATA (version 10.1; StataCorp, College Station, TX, USA), and figures were prepared with R (version 2.14.0; http://www.r-project-org). P values < 0.05 were considered significant.
Ethics statement
This study was approved by the institutional review board of the Kyung Hee University Hospital at Gangdong (KHNMC IRB 2012-067). After approval of study proposal, KNHANES dataset was available on the request of investigator. Because the dataset did not include any personal information and participant's consent was already taken in the process of KNHANES, informed consent was exempted by the board.
RESULTS
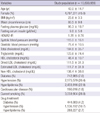
Table 1 shows the clinical characteristics of the study population. The mean age was 42.0 yr and 45.0% of the subjects were female. Of the total 10,633,655 study subjects, 2,433,916 (22.8%) were diagnosed with hyperlipidemia and 288,227 subjects (2.7%) were taking lipid-lowering medications.
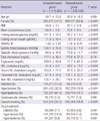
Pearson's correlation analysis showed good correlation between estimated LDL-C and directly-measured LDL-C values (r = 0.96); however, there was a statistically significant difference between directly-measured LDL-C concentration and estimated LDL-C concentration (111.5 ± 31.3 mg/dL in direct LDL-C vs 111.7 ± 31.9 mg/dL in estimated LDL-C, 95% CI; 0.990-0.998, P < 0.001) in linear regression analysis (data not shown). We compared the clinical characteristics of the subjects between the underestimated group (n = 1,118,661, 10.5%) and overestimated group (n = 1,209,047, 11.4%). Compared to the subjects in the overestimated group, those in the underestimated group were more obese, insulin resistant, more likely to smoke, and more likely to be diagnosed with diabetes or hypertension. In terms of lipid profiles, the subjects in the underestimated group had more atherogenic dyslipidemic lipid profiles (Table 2). In addition, when we defined subjects in the over- and underestimated groups whether the subjects fall into the same LDL-C category of the NCEP ATP-III guidelines or not, 8,668,556 subjects (81.5%) showed concordant results, 989,993 subjects (9.3%) fell into the underestimated group, and 975,106 subjects (9.2%) fell into the overestimated group (data not shown).
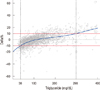
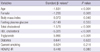
We next determined the clinical parameters that may affect the difference between the directly-measured and estimated LDL-C concentrations. Of all clinical parameters, serum triglyceride concentration showed the greatest independent association (standard β-value of 5.990); as serum triglyceride concentration increased, the difference between the two LDL-C values increased. That is, Friedewald's formula appears to underestimate directly-measured LDL-C concentration (Table 3). To estimate the triglyceride cutoffs that produce a statistical difference, defined as delta% more than 10% between directly-measured and estimated LDL-C concentrations, nonlinear and linear quartile regression models were used. As a result, Friedewald's formula overestimated directly-measured LDL-C level when triglyceride concentration was less than 36 mg/dL (n = 283,919, 2.7%) and underestimated LDL-C level when triglyceride concentration was greater than 298 mg/dL (n = 439,170, 4.1%). However, in the majority of cases (n = 9,910,566, 93.2%), when serum triglyceride concentration ranged from 36 to 298 mg/dL, Friedewald's formula accurately estimated serum LDL-C level (Fig. 1).
DISCUSSION
After being first introduced in 1972 (8), Friedewald's formula has been widely used to estimate serum LDL-C concentration in clinical practice due to its simplicity and lack of additional cost. However, clinical utility of the formula has been reported to be limited in specific subject groups, including those with diabetes, and renal and liver disease (9-13). In addition, the accuracy of Friedewald's formula appears to be critically affected by a variety of clinical parameters, especially serum triglyceride concentration (10, 14, 18-22). To date, numerous studies have investigated the validity of Friedewald's formula in the estimation of serum LDL-C concentration (18, 19, 23, 24). The majority of these studies have shown that Friedewald's formula underestimates directly-measured serum LDL-C concentration. In one example, it was reported that calculated and directly-measured LDL-C concentrations were significantly different, and directly-measured LDL-C value exceeded calculated LDL-C value in 93% of cases. As a result, concordant results using NCEP ATP-III risk categories were present in only 48.1% of the sample. In addition, the discrepancy between the two LDL-C concentrations increased linearly as triglyceride concentration increased, and discrepancies in excess of 10% occurred in 24.6% of subjects with serum triglyceride concentration ≤ 1.13 mM/L and in 46.0% with serum triglyceride concentration ≤ 2.26 mM/L (18). Another report by Tanno et al. (19) also showed that discordance between the two LDL-C concentrations in the NCEP group was most significantly associated with higher triglyceride concentration. In addition, although the two LDL-C concentrations were similar when triglyceride concentration was ≤ 1.69 mM/L, Friedewald's formula significantly underestimated directly-measured LDL-C concentration when triglyceride concentration exceeded this cutoff (19).
In the present study, we investigated the accuracy of Friedewald's formula in estimating directly-measured LDL-C concentration. The results show that, when we define a significant difference in the two LDL-C concentrations as a delta% ≥ 10%, the majority of subjects (78.1%, n = 8,305,947) show concordant results between directly-measured and calculated LDL-C concentrations, and only a small portion of the subjects show disconcordant results between the two LDL-C concentrations. That is, 10.5% of subjects (n = 1,118,661) were categorized in an underestimated group and 11.4% (n = 1,209,047) were overestimated. In addition, we investigated the concordance between estimated LDL-C value with respect to directly-measured LDL-C level at established NCEP cutoffs. Overall, 81.5% (n = 8,668,556) of subjects showed concordant results; 9.3% (n = 989,993) of subjects were categorized as underestimated, and 9.2% (n = 975,106) were categorized as overestimated (data not shown).
We next determined the clinical parameters that may affect the difference between the directly-measured and estimated LDL-C concentrations. In agreement with the results of previous studies, serum triglyceride concentration appears to be the most powerful clinical parameter in determining the difference between directly-measured LDL-C and estimated LDL-C levels using Friedewald's formula. However, contrary to previous studies, Friedewald's formula either underestimated or overestimated directly-measured LDL-C concentration according to triglyceride concentration. That is, directly-measured LDL-C level began to exceed estimated LDL-C level calculated with Friedewald's formula at triglyceride values greater than 111 mg/dL. Conversely, estimated LDL-C level began to exceed directly-measured LDL-C value at triglyceride values less than 111 mg/dL. Therefore, Friedewald's formula did not uniformly underestimate serum LDL-C concentration, rather it would either underestimate or overestimate directly-measured LDL-C value, especially according to serum triglyceride concentration.
Based on the finding that serum triglyceride concentration was the most powerful determinant in minimizing the difference between directly-measured and estimated LDL-C concentrations, we next investigated the range of serum triglyceride concentrations over which no statistically significant difference between the two LDL-C concentrations existed. When we defined a significant difference as greater than 10%, most of the subjects (n = 9,910,566, 93.2%) showed no significant difference in the two LDL-C concentrations when triglyceride concentration ranged from 36 mg/dL to 298 mg/dL, using nonlinear and linear quartile regression models. That is, in most cases, Friedewald's formula can be used to accurately estimate serum LDL-C concentration. However, if serum triglyceride concentration is outside of this range (36-298 mg/dL), it might be recommended to not use Friedewald's formula to estimate LDL-C concentration and instead to directly measure serum LDL-C concentration. In accordance with our results, when triglyceride level was < 200 mg/dL, > 90% of the estimated LDL-C values were acceptable, that is, within ± 10% of the measured values. At triglyceride concentrations of 200-400 mg/dL, 72% of the estimated values were acceptable (25). In addition, a study involving 9,477 subjects in Quebec City showed that the mean absolute error and the mean percentage of bias in plasma LDL-C concentration found using Friedewald's formula, according to triglyceride quartiles of ≤ 4.5 mM/L, were less than 0.14 mM/L and 3.1%, respectively (20).
Similarly, we investigated triglyceride cutoff values in subjects with diabetes within whom Friedewald's formula can be used without significant error. As a result, the Friedewald's formula underestimated directly-measured LDL-C level when triglyceride concentration was greater than 276 mg/dL; however, the formula can be used with triglyceride levels less than 276 mg/dL without significant error (data not shown). In addition, no significant differences between the two LDL-C concentrations were noted when triglyceride concentration ranged from 63 mg/dL to 360 mg/dL in subjects taking lipid-lowering medications (data not shown). Compared to subjects in the overestimated group, subjects in the underestimated group were more obese, insulin resistant, more likely to smoke, and more likely to be diagnosed with diabetes or hypertension. In terms of lipid profiles, the subjects in the underestimated group had more atherogenic dyslipidemic lipid profiles (Table 2). Consequently, using Friedewald's formula, subjects in the underestimated group were likely to be under-treated despite relatively deranged metabolic profiles. On the other hand, subjects in the overestimated group were likely to be over-treated despite their relatively healthy metabolic profiles.
This study has several limitations. First, although the new generation homogenous enzymatic method used in this study is accurate for directly determining LDL-C, we did not measure LDL-C level using β-quantification, which is the reference method to directly measure LDL-C concentration. Second, although we defined a significant difference in the two LDL-C concentrations as a delta% ≥ 10%, as is the case in most studies, this definition is somewhat arbitrary. Despite these limitations, this study was conducted with nationally representative, Korean population data and demonstrates that, contrary to most previous reports, Friedewald's formula does not uniformly underestimate serum directly-measured LDL-C concentration but rather could either underestimate or overestimate LDL-C value, especially according to serum triglyceride concentration. In addition, we suggested a range of triglyceride concentration over which Friedewald's formula can be used to estimate LDL-C concentration with acceptable error.
In conclusion, Friedewald's formula accurately estimates directly-measured serum LDL-C concentration in Korean adults. However, the formula can be applied to subjects with serum triglyceride concentrations from 36 to 298 mg/dL without significant error.
 XML Download