

 PDF
PDF ePub
ePub Citation
 Print
Print


INTRODUCTION
There has been much controversy over the baseline heart rate for a normal term fetus (1-6). Gibb and Arulkumaran (2) and Spencer (3) proposed that the baseline fetal heart rate (FHR) range should lie between 110 and 150 beats per minute (bpm) and emphasized the possibility of serious problems resulting from tachycardia (> 150 bpm) or bradycardia (< 110 bpm). In contrast, it was pointed out that a rate of 100-119 bpm in the absence of other non-reassuring patterns is not the usual sign of fetal compromise (4). According to Sweha et al. (5), fetal tachycardia is considered a non-reassuring pattern defined by a baseline heart rate greater than 160 bpm. Chan et al. (6) also defines fetal tachycardia as a heart rate greater than 170 bpm.
Recently, new standards for electronic fetal monitoring were proposed at the National Institute of Child Health and Human Development (NICHD) workshop (7). These new standards are as follows: 1) FHR tracings are normal when the baseline FHR lies between 110 and 160 bpm, 2) bradycardia is defined by a baseline FHR less than 110 bpm, and 3) tachycardia is defined by a baseline FHR greater than 160 bpm. A normal cardiotocography (CTG) is associated with a low probability of fetal compromise and has the following features (8). An abnormal CTG trace (non-reassuring CTG trace) is when two of the features described for a non-reassuring CTG trace are present, or when the baseline FHR is less than 100 bpm or greater than 170 bpm. However, most fetuses that had records of mild bradycardia or tachycardia without non-reassuring patterns did not have abnormal postnatal outcomes.
The nonstress test (NST) and vibroacoustic stimulation test (VAST) are both FHR tests that can be used to predict antepartum fetal status (9, 10). The reference ranges for the FHR parameters after vibroacoustic stimulation (VAS) were reported in 2009 (11). As shown in Fig. 2, baseline FHR after VAS displayed different patterns and FHR ranges were unstable with an upward trend in the movement of FHR position.
In the present study we investigated whether baseline FHR ranges reported by previous research studies differ from those reported in the aforementioned studies. To achieve the aim of our research, a statistical analysis was conducted based on what we believe to be timely measures. We investigated the different baseline FHR ranges established by various researchers and the nature of mild bradycardia and/or tachycardia without non-reassuring patterns through statistical methods and the heredity (regress) method designed by Francis Galton (1886) (12, 13).
MATERIALS AND METHODS
Research subjects
Gestational ages were distributed between 30 and 42 weeks old for the non-stress test (NST) and subjects were chosen from 4,589 pregnancies resulting in singleton live births (between 1999 and 2008). The 1st and 2nd 20 min intervals of the NST were routinely performed followed by the fetal VAST for 10 min immediately after completion of the NST (11). FHR data from antepartum FHR tracings taken 10 min before (NST) and 10 min after VAS testing were analyzed using the Han Yang Fetal Monitoring (HYFM) system (14). VAST was performed using a fetal vibroacoustic stimulator (Corometrics model 146, Wallingford, CT, USA; audible sound 20-9,000 Hz, vibrations between 67 and 83 Hz, sound level 74 dB at 1 m in air) applied to the maternal abdomen above the fetal head. One-second stimuli were applied at 30-s intervals up to three times.
Regression analysis
Regression analysis is widely used in biological and behavioral sciences to describe possible relationships between variables (15, 16). More specifically, regression analysis helps us understand how the value of the dependent variable changes when any one of the independent variables is varied while the other independent variables are held fixed. Francis Galton was interested in the relationship between a child's height and the height of the child's parents. He questioned why the mean height of children remained stable even though the children of tall parents were tall and the children of short parents were short. He described this phenomenon on the basis of a regression toward the mean. Today, the characteristic of reverting from extreme values toward the average of the full population is well recognized and termed 'regression toward the mean'.
FHR data was divided into the following three ranges: 1) a normal range (120-160 bpm, n = 4,404; 95.97%), 2) mild bradycardia (100-119 bpm, n = 46; 1.00%), and 3) mild tachycardia (161-180 bpm, n = 139; 3.03%). For all 3 groups, simple linear regression analysis was performed using FHR data from the VAST as the dependent variable and the NST as the predictor. For the linear regression plot, FHR data from the VAST and the NST were used as the dependent variable and as the predictor, respectively.
In addition, a nonlinear regression model was used to analyze the FHR parameters, acceleration for 15 bpm-15 seconds (Acc1515) and deceleration for 15 bpm-15 seconds (Dec1515) in the NST.
Statistical analysis
The normality of baseline FHR (NST data) after VAS testing was assessed using the Shapiro-Wilk test. The plot of NST vs VAST was used to estimate the best-fit regression line through the FHR data. A chi-square test was performed to calculate differences in the rate of change of baseline FHR after VAST among the three groups. Mean baseline FHR, Acc1515, and Dec1515 were categorized into three groups according to FHR range and analyzed using a linear regression model. A P value less than 0.05 was considered a statistically significant difference among the three groups. All statistical analyses were performed using SAS for Windows, Release 9.1 (SAS Institute, Cary, NC, USA).
RESULTS
Fig. 1 shows typical FHR tracings for the three groups defined as: (A) mild tachycardia, (B) normal range, and (C) mild bradycardia. In the mild bradycardia group, the baseline FHR after VAS testing increased from 109 bpm to 132 bpm and the number of accelerations for 15 bpm-15 seconds (Acc1515) increased from 0 to 7. On the other hand, in the mild tachycardia group, the baseline FHR did not change significantly after VAS testing and the number of decelerations for 15 bpm-15 seconds (Dec1515) increased from 2 to 5.
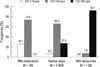
As shown in Fig. 2, baseline FHR after VAS testing displayed a variety of patterns and the rate of maintaining a FHR range was 26.1%, 66.0%, and 92.1% in the mild bradycardia, the normal range, and mild tachycardia groups, respectively (P < 0.001). The rate of increase for a FHR range was 73.9%, 27.5%, and 0.0% in the mild bradycardia, normal range, and mild tachycardia groups, respectively (P < 0.001).
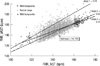
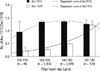
Baseline FHR before (NST data) and after VAS testing followed a normal distribution (Shapiro-Wilk tests, P = 0.785). The linear relationships between baseline FHR before and after VAS testing were plotted and compared by applying the regression model to all the data (N = 4,589, slope = 0.74, correlation coefficients = 0.68, P < 0.001) as shown in Fig. 3. For each group, the regression slope was largest in mild bradycardia (1.14) and the smallest in the normal range (0.73). The regression slope gradually decreased with an increase in gestational age (from 0.81 to 0.71) (Fig. 3); thus, implying that the slopes of the midpoints (34-37 weeks) are similar to those of the overall average. As shown in Fig. 4, the mean of Acc1515 did not change significantly (P = 0.674) while the mean of Dec1515 did significantly increase according to FHR range (P < 0.001).
DISCUSSION
Regression to the mean occurs whenever a non-random sample is selected from a population and two imperfectly correlated variables are measured. The less correlated the two variables, the greater the regression to the mean. Also, the more a value deviates from the population mean, the more room there is to regress to the mean. It occurs whenever a group is selected with extreme values for one variable and another variable is then measured (12).
In this study, the concept of 'FHR regression' is based on the observation that FHR (NST data) changed after VAS testing (Fig. 2). We found that the slope of the best-fit straight line was largest in the mild bradycardia group (Fig. 3). The larger slope value means there is more potential for regression to the mean. In other words, the mild bradycardia group has a greater potential for increased FHR (that is, an increase towards the normal FHR range) than the other two groups due to greater change in baseline FHR after VAS testing. In the mild tachycardia group, the slope of the best-fit straight line was larger than that of the normal range group, but smaller than that of the mild bradycardia group. Thus, there is less potential for an increase in FHR in the mild tachycardia group compared with the mild bradycardia group.
In contrast, the mild tachycardia group showed the greatest increase of the three groups for Dec1515 and no statistically significant change for Acc1515 (Fig. 4). Thus, the mild tachycardia group has a greater potential for a decrease in FHR compared with the mild bradycardia group.
The slope of the best-fit straight line was the smallest in the normal range group; thus, implying that changes in FHR will be less extreme in this group compared with the other two groups. In other words, the normal range group lies between the mild bradycardia and tachycardia groups due to its stability in FHR. In summary, an arbitrary FHR value outside of the normal range will converge to a certain value (the majority will regress toward the population mean) within the normal range through mechanisms that increase or decrease baseline FHR.
These results imply that mild bradycardia and tachycardia have a tendency to regress toward the mean range for FHR. In other words, mild bradycardia and tachycardia are not a fixed and/or abnormal FHR patterns but are capable of regressing toward the mean at any time. Based on these results the differences among baseline FHR ranges established by various researchers may be reasonable and useful.
FHR is controlled by the autonomic nervous system. The inhibitory influence on heart rate is conveyed by the parasympathetic nervous system (PSNS) or vagus nerve, whereas the excitatory influence is conveyed by the sympathetic nervous system (SNS). In the present study, the mild bradycardia group had a greater potential to increase FHR than the other two groups indicating that the increase in FHR is facilitated by the SNS rather than the PSNS. In contrast, the increase for Dec1515 observed in the mild tachycardia group indicates that, FHR is attenuated by actions of the PSNS. The coexistence of the aforementioned properties correlates well with results reported by Yang and coworkers (17), in which they claim that normal pregnancy is associated with a facilitation of sympathetic regulation and an attenuation of parasympathetic influence of heart rate.
Progressive vagal dominance occurs as the fetus approaches term and, after birth, results in a gradual decrease in baseline FHR. Stimulation of the peripheral nerves of the fetus by its own activity (such as movement) or by uterine contractions cause FHR accelerations (18). In our study, the regression slope decreased with increasing gestational age (30-33 weeks, slope = 0.81; 34-37 weeks, slope = 0.73; 38-42 weeks, slope = 0.71). This finding also implies that FHR is controlled more by the SNS in preterm and the PSNS in term pregnancy.
The fetuses of the mild bradycardia and tachycardia groups in this study did not show any clear evidence of non-reassuring patterns during the NST. However, following up with a longer term study is recommended for the detection of an abnormal postnatal outcome.
In general, the VAS test offers several benefits including: 1) decreasing the frequency of nonreactive tests, 2) reducing test time, and 3) lowering the rate of false positives without changing the reliability of the NST. However, in regards to our study, the number of acceleration (nonreactive tests) associated with VAST in mild tachycardia cases had a tendency not to increase than that of normal and mild bradycardia cases. It is thought to be the tendency to regress to the normal range, and thus may not coincide with the nonreactive tests. Therefore, the mild tachycardia cases should be evaluated with caution when interpreting VAS test results.
In conclusion, we propose that both mild bradycardia and tachycardia of FHR are not regarded a pathologic signal for clinical use. Our findings may help to prevent unnecessary interventions in non-acute situations due to strict guidelines for a baseline FHR range between 100 and 180 bpm at 30 to 42 weeks of gestation.

 XML Download