

 PDF
PDF ePub
ePub Citation
 Print
Print


Dear Editor,
Erythrocytes have a unique morphology, which can be altered in pathologic conditions. Examination of poikilocytes is important for diagnosing several blood diseases (e.g., anemia). Thus far, light microscopy has been the main tool for examining erythrocyte morphology; however, it allows for visualizing only the upper side of erythrocytes in two dimensions (2-D). In 1967, Salisbury and Clarke were the first to use a commercialized scanning electron microscope (SEM) to obtain three-dimensional (3-D) images of erythrocytes [1]. However, SEM imaging is a time-consuming process, including several steps of sample preparation to withstand the vacuum conditions and high energy from the electron beam. In general, the sample specimen must be completely dry or requires a fixation process for SEM. Therefore, SEM is not suitable as a routine method for examining erythrocyte morphology, and it does not allow for live cell observations [2].
An alternative is optical diffraction tomography (ODT), an interferometric microscopy technique that can provide 3-D refractive index (RI) tomograms of live cells and tissues without the need for a labeling or fixation step, thereby reducing both time and costs [3]. Only a dilution process is needed to prepare the slides for observation; the remaining steps are similar to those in light microscopy. The main difference between ODT and light microscopy is that the images can be directly viewed on the monitor screen, and the morphology can be reconstructed directly on the computer.
Since the ODT microscope can directly view an unfixed, live specimen, time-lapsed images can also be recorded [3]. It can measure common erythrocyte parameters such as Hb content, corpuscular Hb concentration (CHC), and corpuscular volume (CV) directly from individual erythrocytes. The Hb content and CHC can be measured with a simple algorithm based on the concept that the Hb concentration is proportional to the RI difference between the cytoplasm of the erythrocyte and the medium. The CV is measured directly from the reconstructed 3-D image [45]. Nowadays, compact conventional ODT microscopes are commercially available, facilitating the use of ODT microscopy in hospital laboratories to aid in routine peripheral blood exams.
We observed 3-D images of various types of erythrocytes using a commercial ODT microscope and compared CHC and CV results with those obtained using an automated hematology analyzer.
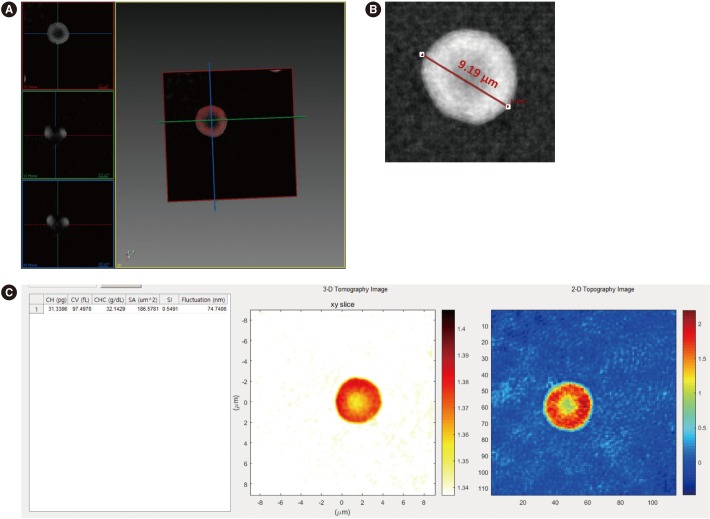
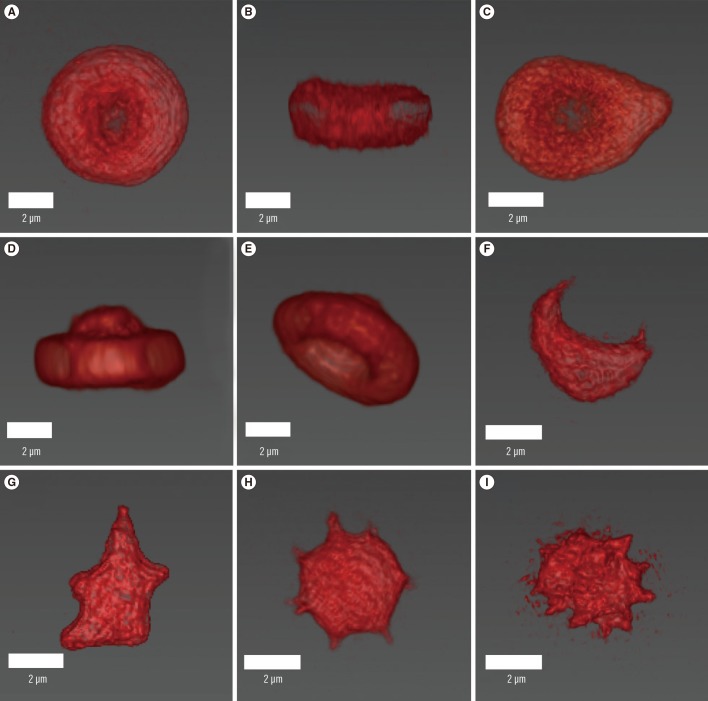
We processed 10 samples from healthy adults stored in EDTA vacutainers; these were left-over samples from complete blood count tests performed at the diagnostic hematology laboratory in Asan Medical Center (Seoul, Korea). Our research was conducted according to the principles of the Declaration of Helsinki and was approved by the ethics committee of Asan Medical Center (No. 2018-0071, 2018-0072). The blood (5 µL) was diluted with 1 mL Dulbecco's phosphate-buffered saline without calcium and magnesium (10010023, Thermo Fisher, Waltham, MA, USA). The diluted blood was then processed through an automated hematology analyzer, XN-1000 (Sysmex, Kobe, Japan), and ODT microscopy. For the ODT setup, the sample was loaded on a coverslip of 25×50 mm (C025501, Matsunami Glass Ind., Ltd., Osaka, Japan) and topped with another coverslip. 3-D RI tomograms were obtained using the HT-1S ODT microscope (Tomocube Inc., Daejeon, Korea) and visualized using TomoStudio (Tomocube Inc.; Fig. 1). The 3-D RI tomograms of erythrocytes were measured at the individual cell level, which provided clear morphological information (Fig. 2).
Mean CHC did not differ (P=0.6953, two-tailed), whereas CV was lower for the ODT microscope than for the XN-1000 analyzer (median of differences=8.017; interquartile range=6.564; P=0.0137, two-tailed), which was a constant systematic error. Therefore, further research with more samples and an adjustment process is needed for optimization.
ODT microscopy enables measurement of unique individual parameters that cannot be obtained with automated hematology analyzers, such as the diameter, membrane fluctuation, surface area, and sphericity of an erythrocyte (Fig. 1). The diameter is measured directly from the 2-D image, whereas surface area and sphericity can be calculated from 3-D RI images. Membrane fluctuation is calculated by continuously recording 2-D-phase RI images using a high-speed camera. Since membrane fluctuation is altered under various pathophysiological conditions such as diabetes mellitus [6], this can serve as a potential index for diagnosing or grading the severity of these diseases.
In conclusion, measuring individual erythrocyte parameters and viewing 3-D morphologies with a conventional ODT-setup microscope was convenient and rapid. The low maintenance of this method is a major advantage. ODT microscopy results can complement results from an automated hematology analyzer when the complete blood count values are doubtful and need to be reviewed manually. Furthermore, ODT microscopy can elucidate the pathogenesis of poikilocytes by enabling observation of live 3-D images from living erythrocytes and analyzing unique indices.
 XML Download