

 PDF
PDF ePub
ePub Citation
 Print
Print


INTRODUCTION
Global coagulation assays, including prothrombin time (PT) and activated partial thromboplastin time (aPTT), are widely used in clinical laboratories for identification or monitoring of hemorrhagic conditions. However, these routine coagulation tests have limitations in terms of detecting some hemorrhagic diseases [1]. Recently, the thrombin generation assay (TGA) has been introduced as a new global coagulation assay that measures the whole coagulation cascade and diagnoses the general state of the coagulation system [2]. TGA is based on the activation of coagulation in the test plasma after addition of human relipidated recombinant tissue factor (TF) as a coagulation-triggering factor, which is suitable for replacing conventional thromboplastin in PT test [3]. The result is measured using a fluorescent substrate. TGA has been proven to reflect hemorrhagic and thrombotic diseases [2, 4, 5, 6, 7] and is expected to be a good test for detecting hemostatic abnormalities, especially in patients with normal PT and aPTT results. In low-concentration TF physiological conditions, the TF factor VII complex mainly activates factor IX in association with factor VIII [8]. Therefore, low-concentration (1 pmol/L) TF-induced TGA is sensitive to factors VIII and IX compared with the usual concentration (5 pmol/L) of TF-induced TGA that is independent of factor VIII and IX levels.
High blood lipid levels have been linked to increased coagulation factors [9, 10, 11]. Moreover, fat intake showed a strong association with increased coagulation factor VII [12, 13]. Hypercoagulability can be decreased by lipid-lowering drugs (statins) [14].
Because blood lipid levels are associated with coagulation factors, it is hypothesized that blood lipid levels affect coagulation test results. We investigated whether blood lipids influence the results of global coagulation tests including PT, aPTT, and TGA in a normal population.
METHODS
1. Study population and blood sampling
A total of 448 normal individuals (267 males and 181 females; mean age, 55 yr; age range, 24-78 yr) who did not have a hospitalization history during the past 3 months was investigated in this study. These individuals' medical history regarding hypertension or hypercholesterolemia and medication history was not collected. This study was approved by the Institutional Review Board of Seoul National University Hospital.
Peripheral blood was collected in commercial vacutainers (3.2% sodium citrate tube and serum separation tube; Becton Dickinson, San Jose, CA, USA). The whole bloods were centrifuged for 15 min at 1,550 g and the aliquots of supernatant plasma or serum were stored at -80℃ for subsequent assays.
2. Coagulation assays
PT and aPTT were assayed by using the RecombiPlasTin (Instrumentation Laboratory, Milan, Italy) and SynthASil (Instrumentation Laboratory) on an ACL 3000 (Beckman Coulter Inc., Fullerton, CA, USA). Procoagulant factor II, VII, and X levels were measured by a one-stage PT-based clotting assay. Procoagulant factor VIII, IX, XI, and XII levels were measured by an aPTT-based clotting assay on the ACL 3000. Antithrombin, protein C, and protein S activity was determined by using HemosIL liquid antithrombin, HemosIL Protein C, and HemosIL Free Protein S (Instrumentation Laboratory).
3. Thrombin generation assay
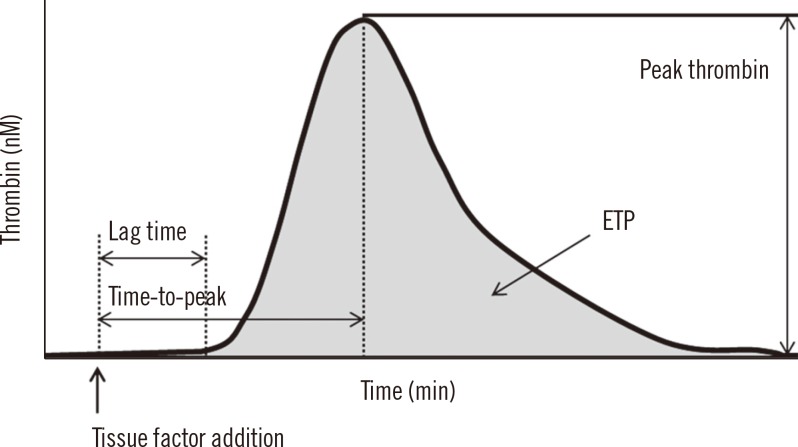
Thrombin generation was measured in a Fluoroskan Ascent Fluorometer (Thermo Lab systems, Helsinki, Finland) as described by Hemker et al. [15]. Thrombin generation was stimulated by two concentrations of TF (1 and 5 pmol/L). Briefly, 80 µL plasma was mixed with 20 µL of reagents containing TF and phospholipid to a final concentration of 1 or 5 pmol/L TF. Then, 20 µL of a fluorogenic substrate mixed with CaCl2 was added. The thrombin generation amount was measured by using Thrombinoscope software (Diagnostica Stago, Asnieres, France). Four parameters including lag time, time-to-peak, peak thrombin, and endogenous thrombin potential (ETP) can be calculated from the thrombin generation curves (Fig. 1). Lag time is the starting point of thrombin generation, time-to-peak is the point to reach the peak thrombin height, peak thrombin is the maximum thrombin height, and ETP is the area under the thrombin generation curve.
4. Chemistry assay
Glucose, albumin, total cholesterol, triglyceride, low density lipoprotein (LDL)-cholesterol, high density lipoprotein (HDL)-cholesterol, and high-sensitivity C-reactive protein (hs-CRP) were measured using Toshiba 200FR (Toshiba, Tokyo, Japan). Glucose was measured with using SHINYANG SICDIA L-GLU kit (Shinyang Chemical Co., Ltd., Seoul, Korea), albumins with SHINYANG SICDIA BCG (Shinyang Chemical Co.), total cholesterols with SHINYANG SICDIA T-CHO (Shinyang Chemical Co.), triglyceride with GPO-PAP Cobas kit (Roche Diagnostics, Mannheim, Germany), LDL-cholesterol with Randox direct LDL-cholesterol kit (Randox laboratories Ltd., Belfast, Northern Ireland), HDL-cholesterol with HDL-C plus 3rd generation kit (Roche Diagnostics) and hs-CRP with CRP-latex X2 kit (Denka Seiken Co., Tokyo, Japan).
Vitamin K status was assessed with prothrombin-induced by vitamin K absence-II (PIVKA-II) that was measured by Elitest ELISA kit (Eisai Co., Tokyo, Japan) on an LUMIPULSE G1200 (Fujirebio Inc., Tokyo, Japan).
5. Statistical analysis
We used IBM SPSS Statistics version 21 (IBM Corporation, Armonk, NY, USA) for all statistical analyses. Correlations were expressed as Pearson correlation coefficients. Subgroup analyses for lipid profiles were performed by t-test. Multiple linear regression analyses were performed to investigate the potential contributing factor(s) to the levels of PT, aPTT, and TGA. A probability value (P) of less than 0.05 was considered significant.
RESULTS
1. Correlation of global coagulation test results with blood lipid levels
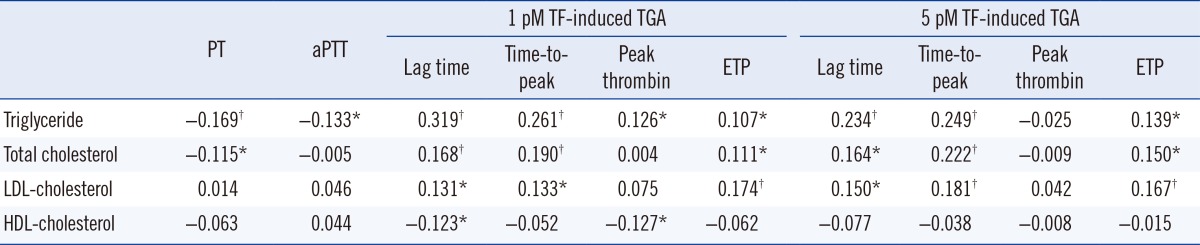
Correlations of four blood lipid levels (triglyceride, total cholesterol, LDL-cholesterol, and HDL-cholesterol) with global coagulation test results were analyzed (Table 1). PT negatively correlated with triglyceride and total cholesterol (P<0.001 and P=0.015, respectively). In addition, aPTT showed negative correlation with triglyceride (P=0.005). In 1 pmol/L TF-induced TGA, four parameters-lag time, time-to-peak, peak thrombin, and ETP-correlated with triglyceride (P<0.001, P<0.001, P=0.008, and P=0.024, respectively). Lag time, time-to-peak and ETP correlated with total cholesterol (P<0.001, P<0.001, and P=0.020, respectively) and LDL-cholesterol (P=0.006, P=0.005, and P<0.001, respectively); in addition, lag time and peak thrombin correlated with HDL-cholesterol (P=0.009 and P=0.008). In 5 pmol/L TF-induced TGA, lag time, time-to-peak, and ETP correlated with triglyceride (P<0.001, P<0.001, and P=0.003, respectively), total cholesterol (P=0.001, P<0.001, and P=0.002, respectively), and LDL-cholesterol (P=0.002, P<0.001, and P<0.001, respectively).
2. Correlation of procoagulant and anticoagulant factors with blood lipid levels
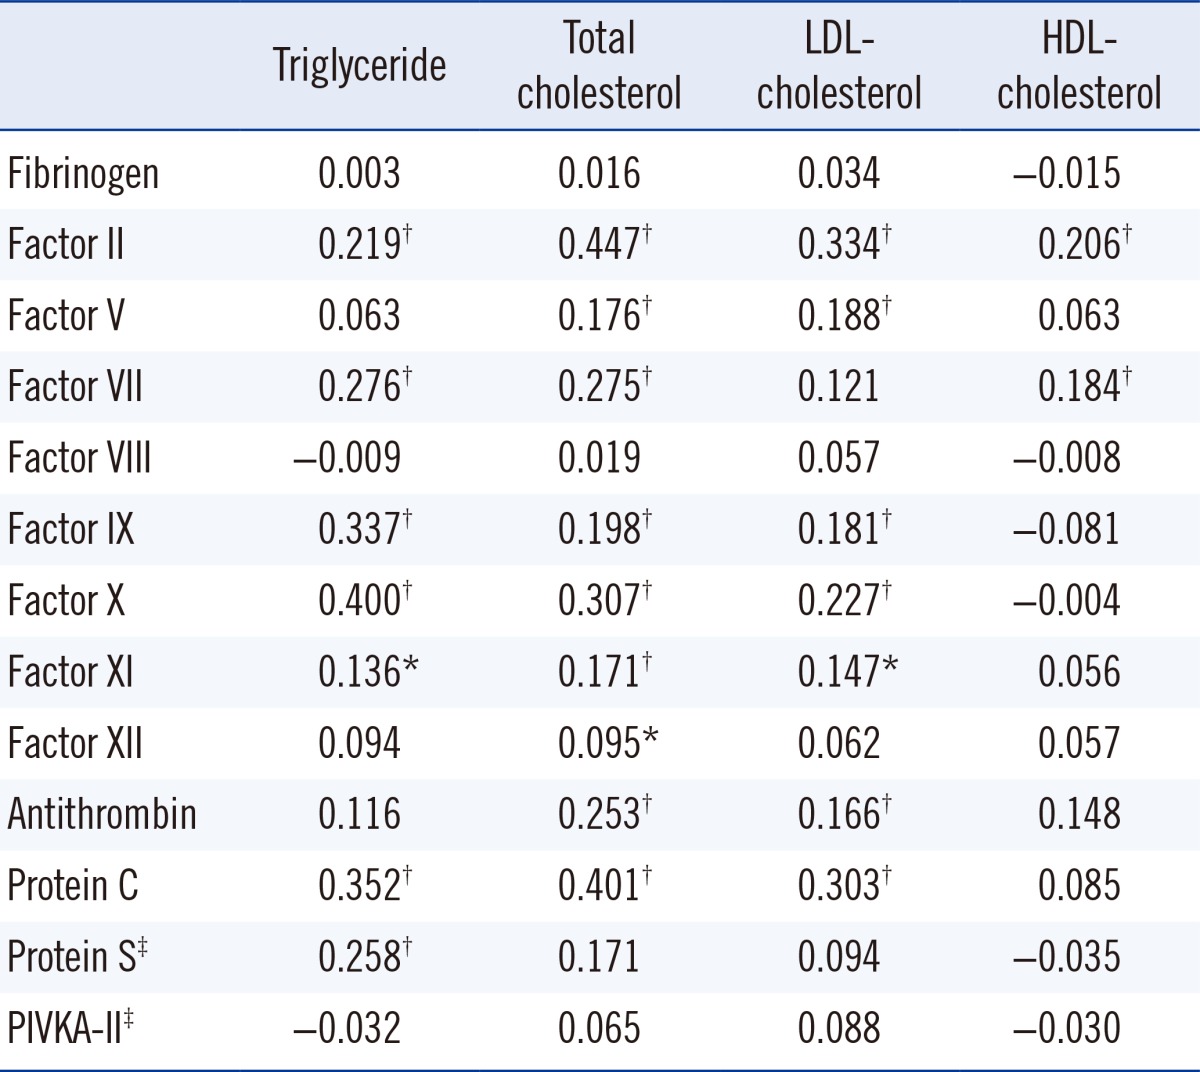
There were significant correlations of some procoagulant and anticoagulation factors with blood lipid levels (Table 2). The procoagulant factors II, VII, IX, X, and XI and anticoagulant factors protein C and protein S showed significant correlations with triglyceride (P<0.001, P<0.001, P<0.001, P<0.001, P=0.004, P<0.001, and P<0.001, respectively) (data on protein S were missing in 204 normal participants). The procoagulant factors II, V, VII, IX, X, XI, and XII and anticoagulant factors antithrombin and protein C correlated with total cholesterol (P<0.001, P<0.001, P<0.001, P<0.001, P<0.001, P<0.001, P=0.044, P<0.001, and P<0.001, respectively). LDL-cholesterol also correlated with procoagulants II, V, IX, X, and XI and the anticoagulants antithrombin and protein C (P<0.001, P<0.001, P<0.001, P<0.001, P=0.002, P<0.001, and P<0.001, respectively). HDL-cholesterol correlated with procoagulant factors II and VII (P<0.001 and P<0.001). Factor VIII and PIVKA-II levels did not show any correlation with blood lipid levels (data on PIVKA-II were missing in 249 normal participants).
3. Mean values of global coagulation test results in terms of blood lipid levels
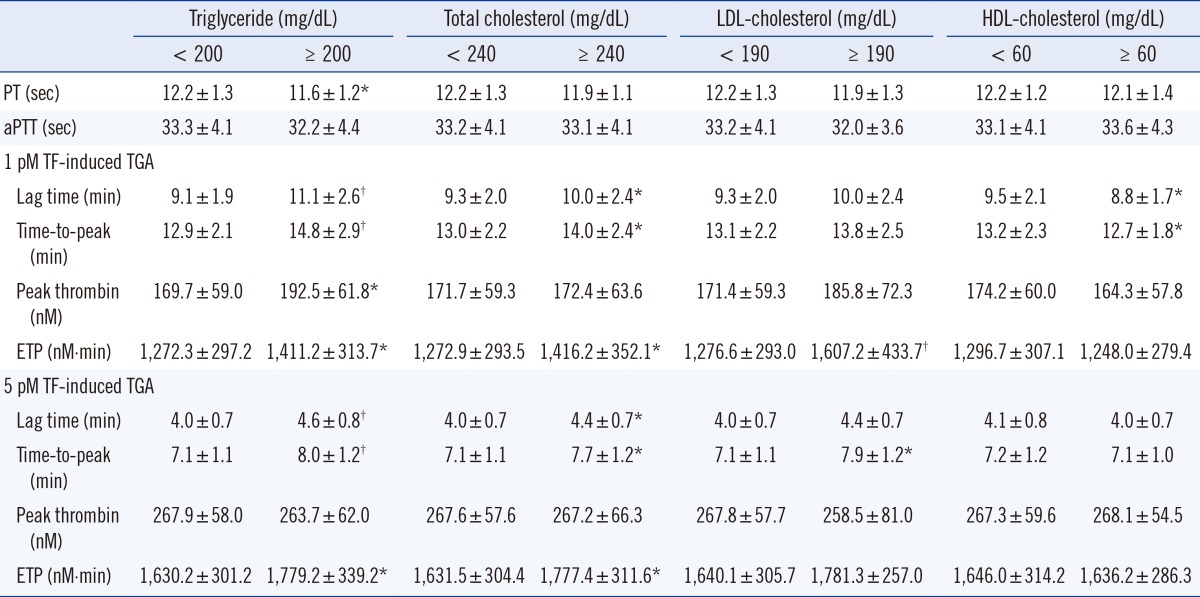
Blood lipid levels were divided into two groups according to the National Cholesterol Education Program (NCEP) guidelines [16]. Subjects with high triglyceride levels (≥200 mg/dL) significantly showed shorter PT values than those with lower triglyceride levels (<200 mg/dL) (P=0.003) (Table 3). However, the mean value of aPTT was not changed according to blood lipid level measurements. In 1 and 5 pmol/L TF-induced TGA, subjects with high triglyceride levels showed higher levels of lag time (P<0.001 and P<0.001), time-to-peak (P<0.001 and P<0.001), and ETP (P=0.005 and P=0.003) than those with low triglyceride levels. Mean levels of PT and aPTT were not different in terms of total cholesterol. Subjects with high total cholesterol levels (≥240 mg/dL) showed high levels of lag time (P=0.032 and P=0.007), time-to-peak (P=0.009 and P= 0.001), and ETP (P=0.005 and P=0.006) in 1 and 5 pmol/L TF-induced TGA. According to LDL-cholesterol levels, ETP of 1 pmol/L TF-induced TGA was significantly different (P<0.001). Subjects with high HDL-cholesterol levels (≥60 mg/dL) had high levels of lag time (P=0.001) and time-to-peak (P=0.022) in 1 pmol/L TF-induced TGA.
4. Contributing factors to the results of global coagulation tests
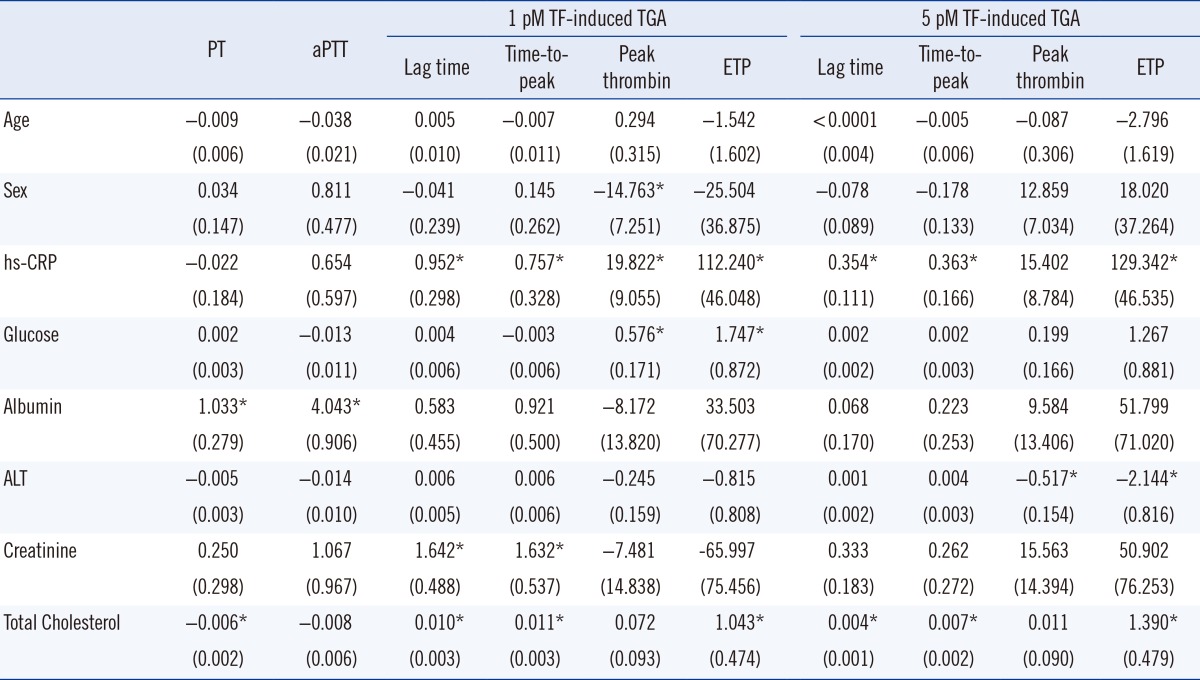
Multiple linear regression analyses were performed to investigate the potential independent contributor(s) to PT, aPTT, and TGA results (Table 4). The significant contributors to PT were albumin (P<0.001) and total cholesterol (P=0.001); albumin was also a contributor to the aPTT level (P<0.001). A lag time and time-to-peak of 1 pmol/L TF-induced TGA were significantly affected by hs-CRP (P=0.002 and P=0.022), creatinine (P=0.001 and P=0.003), and total cholesterol (P=0.001 and P=0.001). The ETP of 1 pmol/L TF-induced TGA was determined by hs-CRP (P=0.015), glucose (P=0.046), and total cholesterol (P=0.029). The lag time and time-to-peak of 5 pmol/L TF-induced TGA were mainly determined by hs-CRP (P=0.002 and P=0.030) and total cholesterol (P=0.001 and P=0.001). The ETP of 5 pmol/L TF-induced TGA was determined by hs-CRP (P=0.006), ALT (P=0.009), and total cholesterol (P=0.004).
DISCUSSION
This study demonstrated significant associations of global coagulation test results with blood lipid levels. The normal individuals with high triglyceride levels (≥200 mg/dL) showed definitively shorter PT values than those with lower triglyceride levels. In both 1 and 5 pM TF-induced TGA, lag time, time-to-peak, and ETP were increased in the high triglyceride or high cholesterol groups (≥240 mg/dL) compared with the lower triglyceride or cholesterol groups. Total cholesterol was revealed as a significant determinant of PT and TGA values.
It has been shown that patients with hypercholesterolemia or triglyceridemia had higher fibrinogen and factor VII levels and shorter PT and aPTT values than patients with lower cholesterol level [10, 11]. Similarly, our study showed significant correlations of total cholesterol and triglyceride levels with procoagulant factors II, VII, IX, and X except fibrinogen, implying that elevation of procoagulant factors may contribute to short PT value in subjects with high blood lipids. Because there was no association of factor VIII with blood lipid levels in our study, subjects with hyperlipidemia also did not show a short aPTT value.
Besides procoagulant factors, anticoagulant factors such as protein C and protein S significantly correlated with triglyceride, whereas antithrombin and protein C correlated with total cholesterol. It is plausible that elevated procoagulant factors may be balanced by increased anticoagulant factors in hyperlipidemia and suggests a natural defense mechanism against athrombotic event. However, total hemostatic balance tends to shift to hypercoagulability, considering that PT was short and ETP increased in hyperlipidemia.
It has also been reported that vitamin K-dependent coagulation factors correlated with blood lipid levels [17, 18]. Hence, vitamin K status may correlate with blood lipids. Our study assessed vitamin K status by measuring the circulating PIVKA-II level. There was no association between PIVKA-II and blood lipid levels. Our results eventually disclosed no apparent relationship between vitamin K status and blood lipid levels.
TGA recently emerged as a new coagulation test that provides useful information about hemorrhagic or thrombotic tendencies [2, 4, 5, 6, 7]. TGA can measure the global hemostatic potential that is balanced by both procoagulant and anticoagulant factors [17]. ETP value represents total endogenous thrombin amount that can be generated by TF stimulation. The ETP value increases as procoagulant factors increase or anticoagulant factors decrease [17, 19]; therefore, our results showed that high levels of ETP were observed in hyperlipidemia, suggesting relatively high levels of procoagulant factors. Peak thrombin level is also changed similar to ETP values.
TGA's lag time is mainly determined by factor VII, factor XII, and protein S levels [17, 19]. In other words, a decrease in factor VII and XII or elevation of protein S can increase lag time. It has also been reported that procoagulant fibrinogen can paradoxically increase the lag time [20]. Our results showed that subjects with high lipid levels had increased lag times. Because high levels of protein S were associated with high triglyceride levels, the elevation of protein S in hypertriglyceridemia may increase lag time. Determining the exact cause of this paradoxical observation - that subjects with high lipid levels had increased lag times - needs further study.
Statins, the well-known lipid-lowing drugs not only decreases blood lipid levels but also reduces coagulation activity through the downregulation of TF in blood monocyte and endothelial cells [14]. Moreover, long-term statin treatment can reduce coagulation activity in subjects with hypercholesterolemia [21]. In the same way, our data imply an association of hyperlipidemia with hypercoagulability.
This study has a few limitations. First, a prospective study would be necessary to verify the causal relationship suggested in this study, although our data demonstrated a clear relationship of blood lipid levels with global coagulation test results. Second, we could not assess other hypercoagulable status such as obesity, hormonal treatment, or socioeconomic factors that may affect global coagulation test results. Third, this study focused on effects of lipids on coagulation assay results only in a normal population. The effects of lipids on coagulation test results in patients with various diseases needs to be studied further. Fourth, we could not get detailed medical or medication history of the study participants. However, we analyzed the correlation of current lipid levels with coagulation assay results.
In summary, our study showed significant associations between blood lipid levels and global coagulation test results. Of note, normal subjects with high triglyceride levels (≥200 mg/dL) exhibited significantly shorter PT values than those with lower triglyceride levels. However, aPTT values were not changed in terms of blood lipid levels. In both 1 and 5 pM TF-induced TGA, subjects with high triglycerides or those in the high cholesterol groups (≥240 mg/dL) had high levels of lag time, time-to-peak, and ETP. Total cholesterol was shown as a significant determinant of PT and TGA values. These findings are expected to help interpret global coagulation test results in the population with high lipid levels.
 XML Download