

 PDF
PDF ePub
ePub Citation
 Print
Print


Abstract
Background
Tumor markers are used for diagnosing cancers and monitoring responses to cancer therapy. In this study, we evaluated the performance of Lumipulse G1200 (Fujirebio, Japan), a fully automated serum analyzer, for immunoassays of tumor markers.
Methods
We determined the precision and linearity of assays performed using Lumipulse G1200 and the correlation between the results of this and other analyzers used for tumor markers according to the guidelines of the Clinical and Laboratory Standards Institute (CLSI). We used 9 tumor markers, namely, carcinoembryonic antigen, α-fetoprotein, cancer antigen 125, cancer antigen 15-3 (CA 15-3), cancer antigen 19-9, prostate specific antigen, protein induced by vitamin K absence or antagonist-II, and pepsinogens I and II. Further, we validated reference intervals using 20 serum samples of healthy individuals.
Results
Lumipulse G1200 yielded acceptable precision with total CV≤5% and within-run CV≤3% for all markers. Total CV for all markers was 2.4-3.7%, with the exception of CA 15-3 and pepsinogens I and II (CV, 4.0-5.0%). Linearity was observed for all markers over the entire analytical range. Results of Lumipulse G1200 were in good agreement with those of currently used analyzers with correlation coefficients>0.975 for all markers, except pepsinogen I (0.9569). The reference intervals provided by the manufacturer met the criteria mentioned in the CLSI guideline.
Figures and Tables
Fig. 1
Linearity of concentrations estimated by the Lumipulse G1200 assay for 9 tumor markers. Concentration of each tumor marker is shown on a separate graph (A-I).
Abbreviations: AFP, α-fetoprotein; CEA, carcinoembryonic antigen; CA 125, cancer antigen 125; CA 15-3, cancer antigen 15-3; CA 19-9, cancer antigen 19-9; PSA, prostate specific antigen; PIVKA-II, protein induced by vitamin K absence or antagonist-II.
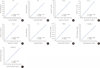
Fig. 2
Regression plots of concentrations of 9 tumor markers measured using Lumipulse G1200 and other analyzers. (A) AFP: Modular analytics E170 vs. Lumipulse G1200, (B) AFP: Architect i2000 vs. Lumipulse G1200, (C) CEA: Modular analytics E170 vs. Lumipulse G1200, (D) CEA: Architect i2000 vs. Lumipulse G1200, (E) CA 125: Modular analytics E170 vs. Lumipulse G1200, (F) CA 125: Architect i2000 vs. Lumipulse G1200, (G) CA 19-9: Modular analytics E170 vs. Lumipulse G1200, (H) CA 19-9: Cobas 6000 vs. Lumipulse G1200, (I) CA 15-3: Modular analytics E170 vs. Lumipulse G1200, (J) PSA: Modular analytics E170 vs. Lumipulse G1200, (K) PIVKA-II: EP-one vs. Lumipulse G1200, (L) Pepsinogen I: TBA-200 FR Neo vs. Lumipulse G1200, (M) Pepsinogen II: TBA-200 FR Neo vs. Lumipulse G1200. The blue line represents the linear regression, and the gray line is a theoretical line with a slope of 1.0 and a Y intercept of 0.
Abbreviations: AFP, α-fetoprotein; CEA, carcinoembryonic antigen; CA 125, cancer antigen 125; CA 15-3, cancer antigen 15-3; CA 19-9, cancer antigen 19-9; PSA, prostate specific antigen; PIVKA-II, protein induced by vitamin K absence or antagonist-II.
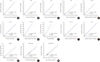
Fig. 3
Bland-Altman plots showing the means of the paired difference in the concentrations of tumor markers measured using Lumipulse G1200 and different analyzers. (A) AFP: Modular analytics E170 vs. Lumipulse G1200, (B) AFP: Architect i2000 vs. Lumipulse G1200, (C) CEA: Modular analytics E170 vs. Lumipulse G1200, (D) CEA: Architect i2000 vs. Lumipulse G1200, (E) CA 125: Modular analytics E170 vs. Lumipulse G1200, (F) CA 125, Architect i2000 vs. Lumipulse G1200, (G) CA 19-9: Modular analytics E170 vs. Lumipulse G1200, (H) CA 19-9: Cobas 6000 vs. Lumipulse G1200, (I) CA 15-3: Modular analytics E170 vs. Lumipulse G1200, (J) PSA: Modular analytics E170 vs. Lumipulse G1200, (K) PIVKA-II: EP-one vs. Lumipulse G1200, (L) Pepsinogen I: TBA-200 FR Neo vs. Lumipulse G1200, (M) Pepsinogen II: TBA-200 FR Neo vs. Lumipulse G1200. Thick solid lines show the means of the paired differences, and thin solid lines represent lines of identity. Dashed lines show 95% limits of agreement (means of paired differences±1.96 SD).
Abbreviations: AFP, α-fetoprotein; CEA, carcinoembryonic antigen; CA 125, cancer antigen 125; CA 15-3, cancer antigen 15-3; CA 19-9, cancer antigen 19-9; PSA, prostate specific antigen; PIVKA-II, protein induced by vitamin K absence or antagonist-II.
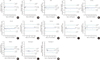
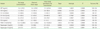
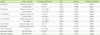
Table 1
Precision profiles for the 9 tumor markers
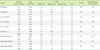
*Within-subject biological variation and desirable analytical precision criteria are referred from Rico et al. [8] and the biological variation database specification in Westgard's web site (http://www.westgard.com/biodatabase1.htm) [11].
Abbreviations: CVw, within-subject biologic variation; AFP, α-fetoprotein; CEA, carcinoembryonic antigen; CA 15-3, cancer antigen 15-3; CA 19-9, cancer antigen 19-9; CA 125, cancer antigen 125; PSA, prostate specific antigen; PIVKA-II, protein induced by vitamin K absence or antagonist-II; NA, not applicable.
References
1. Bates SE. Clinical applications of serum tumor markers. Ann Intern Med. 1991. 115:623–638.

2. Forest JC, Massé J, Lane A. Evaluation of the analytical performance of the Boehringer Mannheim Elecsys 2010 immunoanalyzer. Clin Biochem. 1998. 31:81–88.
3. Clinical and Laboratory Standards Institute. CLSI document EP5-A2. Evaluation of precision performance of quantitative measurement methods; approved guideline. 2004. 2nd ed. Wayne, PA: Clinical and Laboratory Standards Institute.
4. Clinical and Laboratory Standards Institute. CLSI document EP6-A. Evaluation of the Linearity of Quantitative Measurement Procedures: A Statistical Approach; Approved Guideline. 2003. Wayne, PA: Clinical and Laboratory Standards Institute.
5. Clinical and Laboratory Standards Institute. CLSI document EP9-A2. Method Comparison and Bias Estimation Using Patient Samples; Approved Guideline. 2002. 2nd ed. Wayne, PA: Clinical and Laboratory Standards Institute.
6. Clinical and Laboratory Standards Institute. CLSI document C28-A2. How to Define and Determine Reference Intervals in the Clinical Laboratory; Approved Guideline. 2000. 2nd ed. Wayne, PA: Clinical and Laboratory Standards Institute.
7. Fraser CG, Harris EK. Generation and application of data on biological variation in clinical chemistry. Crit Rev Clin Lab Sci. 1989. 27:409–437.
8. Ricós C, Alvarez V, Cava F, Carcía-Lario JV, Hernández A, Jiménez CV, et al. Current databases on biological variation: pros, cons and progress. Scand J Clin Lab Invest. 1999. 59:491–500.
9. Cotlove E, Harris EK, Williams GZ. Biological and analytic components of variation in long-term studies of serum constituents in normal subjects. 3. Physiological and medical implications. Clin Chem. 1970. 16:1028–1032.
10. Harris EK. Statistical principles underlying analytic goal-setting in clinical chemistry. Am J Clin Pathol. 1979. 72:Suppl 2. S374–S382.
11. Ricos C, Alvarez V, Cava F, Garcia-Lario JV, Hernandez A, Jimenez CV, et al. Desirable Specifications for Total Error, Imprecision, and Bias, derived from intra- and inter-individual biologic variation. Updated on Apr 2012. http://www.westgard.com/biodatabase1.htm.
12. Fraser CG, Petersen PH. Analytical performance characteristics should be judged against objective quality specifications. Clin Chem. 1999. 45:321–323.
13. Dolci A, Scapellato L, Mozzi R, Panteghini M. Imprecision of tumour biomarker measurements on Roche Modular E170 platform fulfills desirable goals derived from biological variation. Ann Clin Biochem. 2010. 47:171–173.
14. Sturgeon CM, Hoffman BR, Chan DW, Ch'ng SL, Hammond E, Hayes DF, et al. National Academy of Clinical Biochemistry Laboratory Medicine Practice Guidelines for use of tumor markers in clinical practice: quality requirements. Clin Chem. 2008. 54:e1–e10.
15. van Gammeren AJ, van Gool N, de Groot MJ, Cobbaert CM. Analytical performance evaluation of the Cobas 6000 analyzer - special emphasis on trueness verification. Clin Chem Lab Med. 2008. 46:863–871.
16. Hubl W, Zogbaum M, Boyd JC, Savory J, Schubert M, Meyer D, et al. Evaluation of analytical methods and workflow performance of the Architect ci8200 integrated serum/plasma analyzer system. Clin Chim Acta. 2005. 357:43–54.
17. Stephan C, Köpke T, Semionow A, Lein M, Deger S, Schrader M, et al. Discordant total and free prostate-specific antigen (PSA) assay: dose calibration with WHO reference materials diminish the problem? Clin Chem Lab Med. 2009. 47:1325–1331.
18. Fraser CG, Hyltoft Petersen P, Libeer JC, Ricos C. Proposal for setting generally applicable quality goals solely based on biology. Ann Clin Biochem. 1997. 34:8–12.
 XML Download