

 PDF
PDF ePub
ePub Citation
 Print
Print


INTRODUCTION
The number of genetic and genomic tests is rapidly increasing, and interpretation of sequence variants is challenging; now many sequence variants of unknown significance have been identified [1]. In response to the need for standardized and inter-communicable assessment, the American College of Medical Genetics and Genomics (ACMG) published guidelines for sequence variant interpretation in 2000 [2], 2007 [3], and 2015 [4].
The 2015 ACMG and Association for Molecular Pathology (AMP) guidelines described specific rules and evidence used for variant classification and interpretation [4]. These guidelines provide a framework for laboratories to evaluate the pathogenicity of sequence variants in a consistent manner. They recommend the classification of these variants into five categories: pathogenic, likely pathogenic, variant of uncertain significance, likely benign, or benign. The classification is based on the strength of available evidence, which includes population data, computational and predictive data, functional data, segregation data, and other evidence detailed in the ACMG-AMP guidelines [4].
While the 2015 ACMG-AMP guidelines for the classification of Mendelian variants have advanced the field of clinical genetics, the degrees of subjectivity and uncertainty allowed by these guidelines can lead to inconsistent classification across clinical molecular laboratories [5678]. The discordance between classifications is caused by differences in how individual laboratories interpret the mapping of variant data according to the levels of evidence and by inaccurate usage of the ACMG-AMP guidelines [9]. A previous study of 6,169 variants in the ClinVar database (http://www.ncbi.nlm.nih.gov/clinvar/) found a discordant interpretation rate of 11.7% among four clinical laboratories [5]. Another study of 603 variants of cancer susceptibility genes reported a discordance frequency of 26% [6]. Discordance can be as high as 66% [7] or 71% [8]. The variation in the rates of inconsistent classification between groups could be due to differences in the number of participating laboratories, scope of variants and genes, data sharing practices among laboratories, etc. [5678].
We describe the critical elements of variant interpretation processes and potential pitfalls through practical examples and provide updated information from our review of recent literature. The variant classification described in this review is applicable to sequence variants for Mendelian disorders, whether identified by single-gene tests, multi-gene panels, exome sequencing, or genome sequencing. Classification of copy number variants and other structural variation is beyond the scope of this review.
POPULATION DATA
Variant frequencies from large population datasets can provide powerful evidence for variant interpretation in individuals with rare Mendelian diseases [410]. The 2015 ACMG-AMP guidelines contain three benign rules and two pathogenic rules to determine the impact of population frequency on variant classification: BA1 (allele frequency is >5%), BS1 (allele frequency is greater than expected), BS2 (observed in a healthy adult individual for certain zygosity in a disease with full penetrance at an early age), PS4 (higher prevalence in affected individuals than controls), and PM2 (absent from controls) [4].
Considerations for using population data
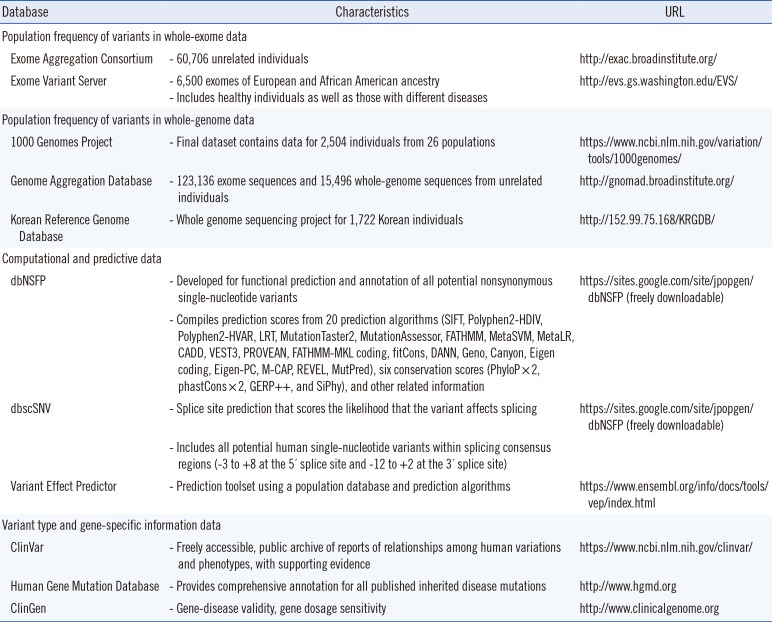
Many large-scale reference datasets have become publicly available for the wider biomedical community (Table 1). The 1000 Genomes Project (1000G) includes individual-level genotype data from whole-genome and exome sequence data for 2,504 individuals [11]. The Exome Variant Server, created as part of the National Heart, Lung, and Blood Institute Exome Sequencing Project (ESP), contains frequency information spanning 6,503 exomes [12]. The Exome Aggregation Consortium (ExAC) compiled whole-exome sequencing data from 60,706 unrelated individuals and provides information on different human populations, as well as the presence of heterozygous, homozygous, and hemizygous individuals [13]. The recently released Genome Aggregation Database (gnomAD) is a large source of variants that includes 123,136 exome sequences and 15,496 whole genome sequences from unrelated individuals, sequenced as part of various disease-specific and population-wide genetic studies (http://gnomad.broadinstitute.org/).
The filtering of candidate variants by frequency in unaffected individuals is a key step for discovering causal variants in Mendelian disease patients; there are several considerations for using the available population data. For example, PMS2 (NM_000535.5) c.2007-4G>A is a variant absent from ExAC, which has weak coverage of intronic regions, but is present at 16.3% in 1000G and 16.0% in gnomAD. This example demonstrates that the absence of a variant from ExAC does not always indicate that it is rare. At intronic loci, smaller datasets (such as 1000G) or gnomAD, which has adequate coverage of intronic regions, may have more relevant information [14]. ExAC and gnomAD provide large-scale data with high-quality variant calls, but there are certain loci at which data quality problems occur, and these are represented as non-pass variants [10]. For example, NF1 (NM_001042492.2) c.8133G>T (p.Leu2711Phe) is a missense variant present in ExAC at a high frequency of 4.8%; however, the variant is flagged as low quality. The ESP and 1000G data do not report a variant at this position. This example demonstrates that the frequency information at the location of the quality flag should be used carefully [10]. In contrast, ARX (NM_139058.2) c.1247C>G (p.Ala416Gly) is a quality filter-passed variant in ExAC, although it is present in <4% of the individuals in ExAC (the adjusted allele number was only 4,657), which may indicate low-quality data. Variant frequency with low total allele count may be unreliable at these loci because of the small sample size [10].
Variant frequency thresholds as an aid for determining pathogenicity
A filtering approach based on removing variants in sequence data from unaffected individuals and those in the large-scale reference datasets maximizes variant classification accuracy and efficiency [10]. However, Harrison et al. [5] found that one of the major causes of persistently inconsistent interpretation was differences in the application of evidence associated with population data; specifically, BS1, BS2, and PS4. The 2015 ACMG-AMP guidelines provide a single highly conservative threshold (5%) for BA1; thus, they do not adequately capture this variable likelihood of pathogenicity [4]. Furthermore, the guidelines provide no detailed guidance for determining the expected allele frequency of pathogenic variants.
Several studies have evaluated minor allele frequency (MAF) thresholds to aid in determining the pathogenicity of candidate variants [1015161718]. A study of 197 variants from 29 known dilated cardiomyopathy genes estimated that a median of 0.04% of variants captured in the ESP dataset had a frequency ranging from 0.02% to 1.33%, suggesting that a 0.04% cutoff may be a useful for lower penetrance alleles when filtering exome data [15]. Another study of 2,197 reported pathogenic deafness variants found >325 variants in a control dataset of 8,595, indicating a MAF >0.00006 [16]. Based on these results, they established MAF thresholds of 0.005 for autosomal recessive variants (excluding some specific common pathogenic variants in GJB2, c.35delG, and c.167delT) and 0.0005 for autosomal dominant variants. A study on pathogenic variant burden in a set of 1,508 variants from 79 disease genes (39 dominant and 40 recessive inheritance) found that 97.3% had an MAF <0.01% in the ExAC database [17]. According to the 2015 ACMG-AMP guidelines, the BS1 rule is that an “allele frequency greater than expected for a disorder” should be considered strong evidence for a benign classification [4]. Based on the findings from the above study, global ExAC allele frequencies >0.01% should be considered “greater than expected” for diseases with Mendelian inheritance, and this threshold may be lowered even further for certain genes [17]. Another study suggested five levels of MAF thresholds: very high, high, somewhat high, pathogenic range, and absent (quantitatively subdivided by the quality of population data and inheritance mode) [10]. Furthermore, some studies have suggested a method for calculating MAF thresholds using a statistical framework that considers disease prevalence, genetic and allelic heterogeneity, inheritance mode, penetrance, and sampling variance in reference datasets [1920].
However, more stringent MAF thresholds may increase the risk of incorrectly classifying pathogenic variants with a high frequency as benign [2122]. Well-known examples include RNF213 (NM_001256071.1) c.14429G>A (p.Arg4810Lys), a variant observed at MAF 1.24% in the Korean population [21], and CFTR (NM_000492.3) c. 1521_1523delCTT (p.Phe508del), a variant observed at 1% frequency in the European population [22]. These high-frequency variants should not be classified as likely benign or benign without a thorough literature review; thus, careful consideration is needed to assess pathogenicity [22].
Frequencies in affected and unaffected populations
The 2015 ACMG-AMP guidelines recommend that the odds ratio (OR) be calculated based on the occurrence of the variant in affected individuals and in the general population [4]; it is regarded as strong evidence of pathogenicity (PS4). To accurately calculate the OR of an identified sequence variant, it is important to use an appropriate number of ethnicity-matched controls. A study of 144 BRCA1 and BRCA2 variants in Korean patients found that the calculated ORs were falsely inflated when the authors used non-Korean population data as the control [23]. The use of relevant Korean controls related to the identification of pathogenic variants is critical, given that the ORs remained at abnormally high levels even when they used the East Asian controls from the ExAC cohorts [23]. In addition, they determined that the minimal number of relevant ethnic controls needed for accurate variant classification was 820 for a variant existing in 1% of individuals [23]. The reference population dataset for the Korean population is the Korean Reference Genome Database (KRGDB), which includes 1,722 whole-genome sequences from unrelated individuals (http://152.99.75.168/KRGDB/). For example, NOTCH3 (NM_000435.2) c.224G>C (p.Arg75Pro) is a pathogenic variant identified in 24.1% (7/29) of individuals with cerebral autosomal dominant arteriopathy with subcortical infarcts and leucoencephalopathy (CADASIL) [2425], a significantly higher allele frequency than in the controls (0.3%, 6/1,722), giving an OR of 91 (95% confidence interval, 28.3–292.8) for the 1,722 Korean controls.
COMPUTATIONAL AND PREDICTIVE DATA
The 2015 ACMG-AMP guidelines contain one benign and one pathogenic rule to determine the impact of computational prediction on variant classification [4]. These rules are supporting evidence for multiple lines of computational algorithms that suggest no impact (BP4) or deleterious effect (PP3) on a gene or gene product. The guidelines note the possibility of overestimating computational evidence and different predictive capabilities for different genes and algorithms. Therefore, these rules should be applied only when all prediction results agree [4].
However, the ACMG-AMP guidelines do not specify which algorithms are recommended or how many agreements are required, and there is little consensus among laboratories [426]. In general, BP4 or PP3 is the most available evidence in the ACMG-AMP guidelines; however, it is also a major source of discordance among different laboratories [7]. The reasons for discordance might be the subjective process of choosing certain criteria and different usage of in silico algorithms among laboratories [7]. For example, in-silico analysis of a novel variant identified in a Korean study for glucose-6-phosphate dehydrogenase deficiency [27], c.1153T>G (p.Cys385Gly) in G6PD (NM_0010 42351.2), results in a tolerable prediction by the Polymorphism Phenotyping (PolyPhen) [28] and Sorting Intolerant From Tolerant (SIFT) [29] algorithms, which is suitable for the BP4 evidence. However, if the laboratory adds the deleterious result from Protein Variation Effect Analyzer (PROVEAN) [30], the evidence rule could not be applied because of a lack of concordance.
In addition, the accuracy of most algorithms has been questioned [2630313233]. There are vastly different predictive capabilities for different genes, originating from the inherent bias in the datasets used for the development of algorithms [26]. Lack of concordance or false concordance among algorithms should be considered as well [34]. For example, c.3700A>G (p.Ile1234Val) in CFTR (NM_000492.3), which is a well-known pathogenic variant [35], demonstrates discordant results; it is tolerable according to PolyPhen, SIFT, Combined Annotation-Dependent Depletion (CADD) [36], and PROVEAN, but deleterious according to MutationTaster [30].
The five most commonly used algorithms in dbNSFP [37], including PolyPhen, SIFT, CADD, PROVEAN, and MutationTaster, resulted in 79% (5,904/7,473) concordance for pathogenic variants, but only 33% (2,464/7,346) for benign variants [26]. In addition, 10.5% (773/7,346) of variants classified as benign in ClinVar were predicted as pathogenic using the five algorithms, while 0.8% (64/7,473) of pathogenic variants in ClinVar were predicted as benign [26]. The higher discordance for benign variants is due to algorithm prediction of protein domain disruption, not disease causality [26]. Therefore, clinical laboratories should consider different sets of algorithms for classification of benign or pathogenic variants. For pathogenic variants, the combination of MutationTaster, Mendelian Clinically Applicable Pathogenicity (M-CAP) [38], and CADD or other algorithms revealed higher concordance rates [26]. For benign variants, Variant Effect Scoring Tool (VEST3) [39], Rare Exome Variant Ensemble Learner (REVEL) [40], and Meta-analytic Support Vector Machine (Meta-SVM) [41] showed 81.3% true concordance rate and a 2.8% false concordance rate [26]. Furthermore, relatively newer algorithms such as REVEL and VEST3 have better performance than older algorithms such as PolyPhen and SIFT. Ensemble predictors, such as REVEL, VEST3, or Meta-analytic Logistic Regression (MetaLR) [41], are robust against technical artifacts, underlying characteristics of variants or genes, and Mendelian inheritance pattern [26]. The development of gene-specific algorithms using a well-characterized dataset and refinement of guidelines are required for better performance.
VARIANT TYPE AND GENE-SPECIFIC INFORMATION DATA
The pathogenicity of a variant results from the effect of the gene product, which is related to the variant type and mechanism by which the gene product causes disease [10]. The ACMG-AMP guidelines suggest seven rules for the consequence of a variant: null variant in a gene with loss of function mechanism (PVS1), same amino acid change as an established pathogenic variant (PS1), in-frame indel in a nonrepeat region (PM4) or repeat region without known function (BP3), variant on a mutational hotspot or functional domain (PM1), novel amino acid change in a previously reported different pathogenic missense variant (PM5), missense variant in a gene that rarely has missense changes (PP2) or missense variant in a gene where only truncation causes disease (BP1), and silent variant with non-predicted splice impact (BP7) [4].
Loss-of-function variant classification: PVS1 rule
PVS1 is widely used as evidence for a loss-of-function (LOF) variant classification among the ACMG-AMP guidelines [7]. The guidelines outline considerations for the application of the criteria [4]. First, the rule of evidence should be applied to only a gene with an LOF disease mechanism. Second, a gene product with a variant in the last exon or within the last 50 bp of the penultimate exon would escape nonsense-mediated decay. Third, even splice site variants that are predicted to have a null effect require confirmation through further functional studies such as RNA or protein analysis. Fourth, the isoform of a transcript should be considered because of differential tissue expression. An exon without any reported pathogenic variants could be spliced alternatively as a normal isoform, and an LOF variant in the exon should be carefully interpreted [4]. However, the ACMG-AMP guidelines do not provide alternative criteria to classify variants that partially fulfil these requirements; for example, an LOF variant in a gene with an unknown disease mechanism or a deep intronic variant likely to result in alternative splicing [4]. In addition, there are no suggested methods for molecular mechanism evaluation. Therefore, grade modification of PVS1 or stepwise criteria have been suggested for clarification of the ACMG-AMP guidelines [10].
First, a downgrade of strength from very strong to strong could be considered for LOF variants with minor retention of a wild-type transcript or a deep intronic variant demonstrating an impact on splicing [7]. Second, variable-weighted criteria have been proposed for modulation based on the relative location of the stop codon in the mRNA (nonsense-mediated decay versus truncated proteins) and the molecular mechanism of the gene (confirmed versus unconfirmed LOF) [10]. Third, resources should be established to define the LOF mechanism for the gene. Clinical reports of affected individuals with LOF variants from a literature review or ClinVar database and in vitro studies with knock-out models could be utilized as evidence. The gene-level evaluation refers to the gene-dosage sensitivity of ClinGen (http://www.clinicalgenome.org) or ExAC pLI score, which indicates an LOF intolerant gene with a score >0.9 [13]. Taking c.1090+1del of APP (NM_000484.3) as an example, this variant is located at a consensus splice site, where it critically impacts mRNA splicing, and it is absent from the gnomAD database, which contains more than 120,000 whole exome or whole genome sequences from unrelated individuals of various ethnicities. However, there is no reported pathogenic mutation LOF variant in Alzheimer's dementia from ClinVar or a literature review. Without supporting clinical observations, PVS1 evidence could not be applied for classification of the variant.
Other variant types for PS1, PM5, and PM1 rules
Conflicting usage of the PS1 (same amino acid change as an established pathogenic variant) rule could be invoked based on premature application of the ACMG-AMP guidelines [7]. This rule is intended for only a variant with different nucleotide changes. The PM5 (novel missense at the same position) rule has a higher probability of being pathogenic when the novel variant results in a more conservative amino acid residue [4]. Various phenotypes could result from different amino acid substitutions [4]. The PM1 (mutational hot spot and/or critical and well-established functional domain) rule redundantly describes the target region. Critical residues, motifs, and domains are designated on a gene-by-gene basis, and classification by rule should be applied conservatively. For example, NOTCH3, the causative gene for CADASIL, has a spectrum of mutational hot spots between exons 2 and 25 and the spectrum differs by ethnicity and geography [42]. Over 60% of NOTCH3 mutations are clustered in exons 2–6, with the highest frequency in exon 4 in European CADASIL individuals [24]. However, most mutations in Korean CADASIL individuals are found in exon 11, followed by exon 3 [24]. In addition, most of these mutations are located within the extracellular domain that encodes the first five epidermal growth factor repeats and cause either gain or loss of a single cysteine residue [43]. Therefore, it is uncertain whether application of the PM1 rule to the NOTCH3 variant sparing cysteine residue or beyond exon 25 would constitute as pathogenic evidence.
SEGREGATION DATA
The ACMG-AMP guidelines include two rules for segregation data: PP1 (co-segregation with disease) and BS4 (non-segregation with disease) [4]. The evidence for pathogenicity should be carefully applied, because segregation signifies evidence for linkage of a locus, rather than pathogenicity [444]. In addition, the necessary number of family members required to determine segregation and the extent of the medical work-up needed for affected or unaffected individuals are unknown [4].
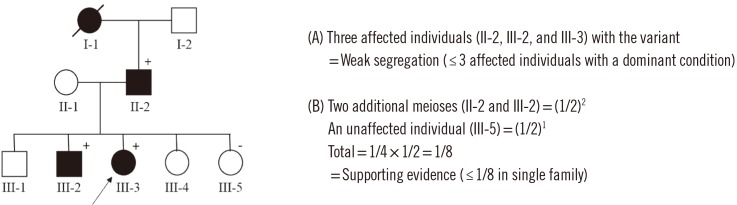
Performance evaluation of the ACMG-AMP guidelines revealed that PP1 was the most commonly available evidence [7]. Therefore, a detailed threshold for the degree of segregation has been suggested for clarification of the lines of evidence. Quantifying segregation by the number of affected individuals and unrelated families has led to the proposal of three categories: weak (≥3 affected individuals with a dominant condition, ≥2 with two rare variants in trans with a recessive condition), moderate (≥6 with a dominant condition or ≥3 with a recessive condition from at least two families), strong (≥10 with a dominant condition or ≥5 with a recessive condition from more than two families) [10]. According to the quantifying segregation based on the number of affected individuals with sequence variant [10], the sample pedigree in the Fig. 1 shows weak segregation. In addition, a simplified calculation could be implemented in clinical laboratories using the numbers of affected and unaffected individuals with dominant inheritance [44]. This method calculates the probability of observed co-segregation, N=(1/2)m, where m is the number of meioses of the variant of interest in a family. Moreover, the absence of the variant in affected individuals is also considered as co-segregation information. Therefore, the probability for such individuals should be multiplied by the probability for the affected events to determine the final probability. Supporting, moderate, and strong evidence levels are determined for a given N; supporting (≤1/8 in a single family, ≤1/4 in >1 family), moderate (≤1/16 in single family, ≤1/8 in >1 family), and strong (≤1/32 in single family, ≤1/16 in >1 family) [44]. The ACMG-AMP evidence level for the pedigree in Fig. 1 meets the 1/8 single family threshold for pathogenic support.
FUNCTIONAL DATA
The 2015 ACMG-AMP guidelines contain two rules for determining functional studies: BS3 (well-established assay, no deleterious effect) and PS3 (well-established assay, deleterious effect) [4]. However, a recent study found that one of the most frequent differently applied ACMG-AMP criteria was functional data (48%) [5]. The value of functional data depends on the relevance of the measured property to disease biology, the quality of the experiment, the reproducibility of the results, and the amount of measured change [10]. Experimental models are more valuable if they directly mimic the predicted functional impact of the candidate variants: for example, knock-out mice are better models of recessive loss of function than of dominant mutations in a candidate gene [45]. In addition, gene-disease-specific guidelines for a single gene, gene family or set of genes implicated in a single disease provided by experts could serve as a method for increasing concordance [7]. For example, in the guidelines for MYH7-associated heritable cardiomyopathies, strong functional evidence can be provided by only a mammalian variant-specific knock-in model, while other in vivo models that alter the dosage of the normal protein (transgenic or knockout mice, zebrafish knock-downs) are not acceptable [20]. The RASopathy expert panel determined that the mouse model for BRAF should be evaluated using five characteristics: congenital heart defect, lymphatic system, growth, ectodermal system, and craniofacial anomalies for functional studies [46].
CONCLUSIONS
Although the ACMG-AMP guidelines were developed to enable consistent and reliable interpretation of variants, classification discrepancies and potential inaccuracies exist across clinical laboratories. In recent years, there have been many efforts to improve the interpretation of variants [47]. First, international collaborations to create gene-disease-specific guidelines have been published, specifically for MYH7-associated inherited cardiomyopathy [20] and RASopathy [46]. These expanded guidelines are expected to reduce the subjectivity of variant interpretation and increase inter-laboratory concordance through factors that explain specific rules such as allele frequency thresholds for assessing rarity, clinical validity of the functional assay, and the role of LOF variants [47]. Similar efforts are underway for other disease-gene pairs through the ClinGen project, which is a central resource that defines the clinical relevance of genes and variants for use in precision medicine and research [48]. Second, data sharing, exemplified by projects, such as ExAC and databases like ClinVar, provides a valuable opportunity for each submitter to address differences in variant interpretation across individuals or laboratories and to resolve those differences [549]. Third, there has been a push for the development of software tools that automate the computable aspects of the 2015 ACMG-AMP guidelines. Each program uses a different application of automatic scoring rules for variant interpretation, so the choice of program should be carefully considered [505152].
In conclusion, we reviewed the 2015 ACMG-AMP guidelines and recent literature to provide updated information and recommendations for classifying sequence variants. Combined with our rapidly growing understanding of the genome, these efforts will improve our ability to make meaningful use of genomic variations in medical care.
 XML Download