

 PDF
PDF ePub
ePub Citation
 Print
Print


The electroretinogram (ERG) is a total response for the whole retina to photo stimuli and the record of the action potential generated at that time. In 1865, Holmgren recorded such action potential in the eye of frogs for the first time,1 and in humans, Dewar2 reported in 1877. Clinically, since Riggs3 reported the use of the corneal electrode in 1941, it has been used widely to examine retinal function.
Retinal action potential appears as various waveforms and changes diversely according to the light- and dark-adapted condition, stimulation intensity, wavelength, frequency, etc. Hence, to standardize individual clinical ERG and simplify the test, the International Society for Clinical Electrophysiology of Vision (ISCEV) established an international standard in 1989,4 which was subsequently revised twice in 1994 and 1999. Hence, the standardization of the test, the objective analysis of the results, and their comparison became possible.5,6
The standard ERG recommended by ISCEV (standard ERG) consists of 5 basic responses: the three responses in the dark-adapted condition (rod response, maximal combined response, and oscillatory potentials), and the two responses in the light-adapted condition (single-flash cone response and 30 Hertz flicker response).
However, such standardized ERG could not record cone response in the dark-adapted condition selectively. We thus examined the characteristic of the waves appearing in response to blue light and red light stimuli at variable intensity in the dark-adapted condition while maintaining other conditions constant. We also investigated the dark-adapted cone response and the waveforms of cone ERG.
Materials and Methods
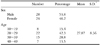
The study population consisted of 88 eyes of 52 subjects with a corrected visual acuity over 1.0, without ophthalmological diseases or systemic diseases that may have affected the eyes (for example, diabetes, hypertension, etc.), and with normal ocular pressure. In 16 eyes of corrected visual acuity lower than 1.0, or because of personal reasons of the subjects, the test was performed on one eye only. The age of the 28 males and 24 females was 10~48 years (mean, 28.87) (Table 1). In slit lamp biomicroscopic test, special findings on the anterior segment of the eye were not detected. The subjects' pupils were dilated using 1% tropicamide and 2.5% phenylephrine and normal fundus findings were confirmed by indirect ophthalmoscope. Subsequently, the dark adaptation was carried out in a double sealed dark room for 45 minutes.
The dark-adapted ERG was performed by UTAS E-3000 (LKC, Gaithersburg, MD), and the entire retina was stimulated with a Ganzfeld dome stimulator. The eye to be tested was anesthetized using 0.5% proparacaine. A Burian-Allen positive retinal electrode was inserted, and a ground electrode was attached to the earlobe of the same side of the eye to be tested. The Ganzfeld dome was fixed to the subject's face, and the subject was asked to stare at the red light of the dome.7,8 Red light stimulation was carried out by using Kodak Wratten No. 26 (red) filters (605 nm), blue light stimulation using Kodak Wratten No. 47 (blue) filters (440 nm), and the stimulation intensity ranged from 0 dB (2.4 cd.s/m2) to -16 dB at 2 dB intervals (Fig. 1). The duration was less than 5 milliseconds, with a high cut of 500 Hz and a low cut of 0.3 Hz. First, blue light stimulation was performed, with the amplitude and implicit time of the b-wave appearing at that time being recorded. Next, with red light stimulation, the amplitude and implicit time of the b-wave and another positive potential that appeared prior to the b-wave, i.e., the x-wave,9,10 were recorded.
During the red light stimulation at various intensities, the selected responses were the b-wave showing an x-wave as well as the b-wave induced by the blue light that showed the same amplitude. The amplitude and implicit time of these three waves were recorded, and the effects of age and gender on each wave were examined.
In addition, using the red minus blue digital subtraction technique,11,12 the pattern of the waveform of cone ERG (cone ERG) in the dark-adapted condition was examined. In the dark-adapted ERG, to examine the effects of gender and age on ERG appearing in response to the blue and red light stimulation, the correlation was examined by performing t-test and ANOVA test.
Results
In the dark-adapted ERG under red light stimulation, in response to 0 dB stimulation intensity, the biphasic positive response that is the appearance of another positive potential x-wave prior to the b-wave was observed in all 88 eyes. Under blue light stimulation, the x-wave was not detected at any stimulation intensity, from 0 to -16 dB.
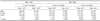
Table 2 shows the amplitude and implicit time of the x-wave and b-wave appearing on the dark-adapted ERG in response to the red light stimulation. Also shown are the amplitude and implicit time of the b-wave of the dark-adapted ERG in response to blue light stimulation that shows the same amplitude and implicit time. The average amplitude of the b-wave in the blue and red light was 216.389 µV and 213.586 µV, respectively, the average implicit time was 77.591 ms and 76.348 ms, respectively, but these differences were not statistically significant. At that time, there were three types of blue light stimulation intensity, -12, -14, and -16 dB, with an average of -14.57dB. The average amplitude and implicit time of the x-wave were 172.439 µV and 46.260 ms, respectively. The x-wave response appeared before the b-wave, and the amplitude was smaller.
Table 3 shows the result of the test that was performed to examine the effect of gender on each wave. In regard to the difference of the amplitude and implicit time of the b-wave, the amplitude in response to the blue and red light was 209.665 µV and 207.139 µV, respectively, in males, and 223.752 µV and 220.648 µV, respectively, in females. These responses were larger in females. The implicit time was 80.163 ms and 78.885 ms, respectively, in males, and 74.774 ms and 73.569 ms, respectively, in females. The times were delayed in males. The difference was significant in the implicit time (blue light, P=0.001; red light, P=0.006), but not in the amplitude. As for the difference of the x-wave according to gender, the amplitude was 170.783 µV in males and 174.252 µV in females; being larger in females. The implicit time was 46.185 ms in males and 46.343 ms in females; being rather more delayed in females. The amplitude and implicit time according to gender were not statistically significantly different. The differences of the amplitude and implicit time according to age are shown in Table 4. In regard to the difference of the amplitude of the b-wave according to age, both blue and red light were highest in the 20s (blue light, 221.851 µV; red light, 220.010 µV), and lowest in the 40s (blue light, 191.718 µV; red light, 199.427 µV). Regarding the implicit time, in blue light, it was shortest in the 20s (77.061 ms), and in red light, it was shortest in the teens (73.829 ms). The time was most delayed in the 40s (blue light, 80.500 ms; red light, 79.409 ms) in both light sources. Nevertheless, the amplitude and implicit time of the b-wave according to age were not statistically significantly different. Concerning the difference of the amplitude of the x-wave according to age, it was highest in the 30s (179.327 µV), and lowest in the over 40s (166.555 µV). The implicit time was shortest in the 30s (45.114 ms), and longest in the 40s (46.773 ms). Nonetheless, the amplitude and implicit time of the x-wave were not statistically significantly different.
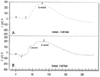
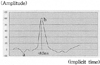
Figure 2 is the dark-adapted ERG of one of the subjects, a 23-year-old female. In response to 0 dB red light, the biphasic positive response, comprising both the x- and b-waves, was detected. When stimulated with 14 dB intensity blue light, the b-wave corresponding to it was detected. These two ERGs were able to be presented as the dark-adapted cone ERG by applying the digital subtraction technique (Fig. 3).
Discussion
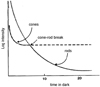
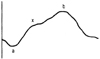
The standard human ganzfeld ERG is a pooled electrical response from cones, rods and most of the postreceptoral neural retina in response to white light, and it is composed of three types of waveforms clinically. First, the negative a-wave, followed by the positive b-wave, and the series of small waves oscillatory potentials (OPs) that appears overlapped with the upper branch of the b-wave. The a-wave is generated by cone cells and rod cells, the b-wave by bipolar cells and Muller cells, and OPs is a transmission process in the inner plexiform layer that reflects the response of bipolar cells by feedback.14 Such response appears regardless of the retinal adaptation (light- or dark-adapted condition). The dark-adapted condition is the reverse response of the mechanism of the light-adapted condition, and it is the phenomenon that retinene and opsin degraded by light were synthesized again and regenerated as rhodopsin. To undergo the dark adaptation, metabolic energy for the regeneration of such photoreceptors is needed, and as it requires the substance transport to the retinal pigment epithelium (RPE), it takes approximately 5~7 minutes (Fig. 4). The maximum inverse value of rod cells appeared 40 minutes after the dark-adapted condition, at which time the sensitivity of rod cells to the light is increased up to 100,000 times during the dark-adapted condition, and it reaches 1,000 times of the cone. Hence, when the retina in the dark-adapted condition is stimulated with single white light, the cone responds sensitively, and thus only the rod response appears in response to low stimulation intensities. In response to strong stimulation, the maximal combined response of the cone and rod cells appears, which makes it difficult to detect only the cone. Verdon11 has reported that rod cells are sensitive to blue light that has short waves, and to the long wave red light that cone cells are responsive, the sensitivity is decreased, and that cone cells show responses faster than rod cells to the long wave red light. Fishman1 has reported that stimulated with red light (approximately 600 nm) in the dark-adapted condition, the biphasic positive response appears, and at that time, the first appearing response is the x-wave that is the cone activity (Fig. 5).
In our study, we observed that when the retina was stimulated with red light in the dark-adapted condition, the biphasic positive response was detected, and that such response was detected in all subjects, 88 eyes, and only in response to the stimulation intensity of 0 dB. When the retina was stimulated with blue light, regardless of the stimulation intensities, x-wave was not detected. The stimulation intensity of 0 dB red and blue light with the same amplitude and implicit time was from -12 dB to -16 dB (average -1.51 dB), and comparing stimulation intensities, in response to weak blue light stimulation, a similar cone response to red light was detected. This result confirmed that rod cells respond to blue light more sensitively and that the response to red light is weak and slow, enabling the cone cell response to be distinguished.
The implicit time of the x-wave observed in our study appeared within 50 ms from the initiation of the stimulation in all cases, and it had a smaller amplitude than the b-wave that appeared subsequently. This results is in agreement with the proposal by Verdon11 that cone cells show faster response than rod cells to the long wave red light. In addition, comparing the cone cell response that appeared during the dark-adapted condition with that in the light- adapted condition, it was found that the amplitude of the response of cone cells in the dark adaptation was larger than that of the light-adapted condition. The implicit time appeared to be delayed relatively. However, it was stimulated with the same stimulation intensity of 0 dB but with different waves. Therefore, from the results of this study, it may be difficult to compare the cone response during the dark-adapted period with that during the light-adapted period.
Reviewing the normal average value of the standard ERG according to age recommended by ISCEV, as the age increased, the b-wave amplitude was decreased, such that the amplitude of those in the 70s was less that half that of those in the 20s. This is believed to be because the density of photoreceptor decreases with increasing age.15 In regard to the difference according to gender, the amplitude of ERG in males tended to be smaller than in females.16-19 In our study, with increasing age, in response to the stimulation with blue and red light, the b-wave amplitude was decreased, and the implicit time was delayed. Similarly, dependent on gender, regarding the b-wave, the amplitude was smaller in males and the implicit time was delayed.
Also in the case of the x-wave, the amplitude was smaller in older age and men. However, significant difference was only detected in the implicit time of the b-wave according to gender and was not detected in any other factor.
We believe that such result was obtained because the number of study subjects was small (n=88), and that young subjects in the 20s~30s (77%) were prevalent and older individuals over 50 years were not included in the study population.
It has been reported that by the dark-adapted ERG using red and blue light, by matching the amplitude and implicit time of the b-wave, the dark-adaptive scotopic balance could be achieved.20 In our study, after distinguishing the response of the cone and rod by red light, the identical rod response was identified by blue light. From the response of the cone and the rod response to red light, the rod response to blue light was removed by digital subtraction, to obtain the dark-adapted cone ERG. The composition had negative and positive responses, and the series reactions occurring between them were considered to be OPs based on their shape and the time to appear. OP is the assessment of the ischemia level in the inner layer of the retina. It is decreased in ischemic retinal diseases, and it varies in response to the light-adapted condition and stimulation conditions.21 The OPs detected in our study appeared in response to red light stimulation, and were thus considered to be related to the strength of stimulation intensity.
Clinically, in regard to the ERG test applying red and blue light, after Sachs22 performed the ERG in 1929 in protanopes using red light, it has been used in dyschromatopsia or cone dystrophies23,24 to evaluate the level of the abnormality in the cone by distinguishing between the cone and rod through the scotopic balance,25 for which, until now, the basic information on normal eyes has not been sufficient. In our study, the dark-adapted cone response in normal eyes was evaluated, and it is believed that the results may be clinically useful in evaluating the severity of the dysfunction of the cone.
Conclusion
In our study, in the dark-adapted ERG, we were able to distinguish the cone response by using red light. In the dark-adapted condition, when the retina was stimulated with 0 dB (2.4 cd.s/m2) red light, a biphasic positive response was observed in all study subjects. The cone response was the first positive response, appearing within 50 ms from the stimulation time, and the amplitude was smaller than the following rod response.
Examining the effects of gender and age on the result, the implicit time of the b-wave in response to separate blue and red light was delayed significantly in males,. However, the differences of the b-wave amplitude according to gender and of the b-wave amplitude and implicit time according to age were not significant. We believe that this result was because the study subjects were limited to individuals under 50 years old. In the case of the x-wave, no difference between gender or ages was detected. However, our study results alone can not confirm the absence of any difference in the dark-adapted cone response according to gender and age. Hence, further research is required with a larger sample size.
It is believed that the dark-adapted cone ERG obtained by the dark-adapted cone response to the red light stimulation and digital subtraction technique may be a test method able to evaluate the cone function of the retina objectively. In the future, this method shows promise in the clinical evaluation of cone dysfunction.

 XML Download