

 PDF
PDF ePub
ePub Citation
 Print
Print


INTRODUCTION
Prediabetes is an intermediate state of hyperglycemia with glycemic parameters above normal but below the diabetes threshold.1 According to the 6th Diabetes Atlas, the number of individuals with prediabetes is almost similar to the number of patients with diabetes worldwide.2 This increasing trend deteriorates as time progresses and the health economic burden due to this problem is huge. Considering the socioeconomic burden of diabetes and the potential of prediabetes to progress to diabetes, the prevention of this progression is the most important strategy to overcome the global burden of cardiovascular disease associated with diabetes.
It has been reported that atherosclerosis occurs in the prediabetic stage and even progress. The Collaborative analysis Of Diagnostic Criterion in Europe (DECODE) study confirmed that asymptomatic hyperglycemia was associated with an increased risk of premature mortality and cardiovascular disease.3 In the Diabetes Epidemiology: Collaborative Analysis of Diagnostic Criterion in Asia (DECODA) study, the correlation between glycemic status in the non-diabetic range and mortality due to CVD was also confirmed among Asians.4 These two studies showed that post-challenge hyperglycemia other than fasting hyperglycemia had a higher correlation with CVD risk.
The Framingham Risk Score (FRS), which has been derived from the data from Caucasians, has been used for the calculation of the 10-year CVD risk with the view to identify subjects who are eligible for statin treatment according to the cholesterol guideline.5 However, there are still controversies regarding the appropriateness of applying this risk calculator to other ethnic groups. In 2013, the American College of Cardiology/American Heart Association (ACC/AHA) task force released a new report on the treatment of blood cholesterol.6 This guideline included a new risk assessment tool designated Pooled Cohort Equations (PCE) to quantify the 10-year atherosclerotic CVD (ASCVD) risk, which has been the subject of controversy regarding its accuracy in risk prediction.7 In this respect, only a few studies have reported the predictive power of the PCE using other datasets.
To date, no studies have evaluated the 10-year ASCVD risk in subjects with prediabetes using PCEs. Therefore, herein we analyzed the 10-year ASCVD risk using the PCE in 17,519 Korean subjects who participated in a health screening program, and compared these rates across different groups stratified by fasting blood glucose (FBG) and glycated hemoglobin (HbA1c) levels.
MATERIALS AND METHODS
1. Study subjects
This cross-sectional study was part of the Kangbuk Samsung Health Study (KSHS), in which the subjects were evaluated in a medical health checkup program at the Health Promotion Center of Kangbuk Samsung Hospital, Sungkyunkwan University, Seoul, Korea. The purpose of this checkup program was to promote the health of employees through regular health checkups and to enhance early detection of existing diseases. Most of the examinees are employees and family members of various industrial companies from around the country. The costs of the medical examinations are largely paid for by their employers and a considerable proportion of the examinees undergo examinations annually or biannually.
The initial study population comprised 34,464 subjects who participated in the program between January 2011 and December 2012. Among them, 20,937 subjects aged between 40 and 75 years were selected. In addition, the subjects with diabetes, being treated with hyperlipidemic agent and those with missing data were excluded from the study, leaving 17,519 subjects for the final analysis.
The study was approved by the institutional review board of Kangbuk Samsung Hospital. The requirement of informed consent was waived because we used non-identifiable data routinely collected during the health screening process.
2. Anthropometric measurement and laboratory assessment
Height and weight were measured twice and then averaged. Body mass index (BMI) was calculated by dividing the weight (kg) by the square of the height (m). Blood pressure was measured using a standardized sphygmomanometer after 5 minutes of rest.
All of the subjects were examined after an overnight fast. The hexokinase method was used to measure fasting blood glucose (FBG) concentrations (Hitachi Modular D2400; Roche, Tokyo, Japan). An enzymatic calorimetric test was used to measure the total cholesterol and triglyceride concentrations. The selective inhibition method was used to measure the level of high-density lipoprotein cholesterol (HDL-C), and a homogeneous enzymatic calorimetric test was used to measure the level of low-density lipoprotein cholesterol (LDL-C).
HbA1c was measured using an immunoturbidimetric assay with a Cobra Integra 800 automatic analyzer (Roche Diagnostics, Basel, Switzerland) with a reference value of 4.4%–6.4%. The methodology was aligned with the Diabetes Control and Complications Trial and National Glycohemoglobin Standardization Program (NGSP) standards.8 The intra-assay coefficient of variation (CV) was 2.3% and the inter-assay CV was 2.4%, both of which were within the acceptable limits of the NGSP.9
The presence of diabetes mellitus was determined using a self-reported questionnaire applied to the participants and according with the diagnostic Criterion of the American Diabetes Association (ADA).1 Whether the subject was on anti-hypertensive medication or not was assessed using the self-reported questionnaire. The smoking status was also determined using the questionnaire and current smokers were defined as the subjects who responded yes to the question "Do you currently smoke?" in the questionnaire. Alcohol drinking status was assessed by the self-questionnaire, and confirmed 'yes' if the subject was drinking alcohol equal to or more than three times a weeks.
Subjects were divided into four groups according to the FBG levels, as follows: group I: FBG<100 mg/dL, group II: 100≤FBG<110 mg/dL, group III: 110≤FBG<120 mg/dL, and group IV: FBG≥120 mg/dL.
In addition, subjects were divided into four groups according to the HbA1c quartile, as follows: 1st quartile: HbA1c<5.5%, 2nd quartile: 5.5%≤HbA1c<5.6%, 3rd quartile: 5.6%≤HbA1c<5.8%, and 4th quartile: HbA1c≥5.8%.
3. Assessment of the 10-year cardiovascular disease risk using the Pooled Cohort Equation
The 10-year ASCVD risk was assessed using the PCE as recommended by the 2013 ACC/AHA guideline on the treatment of blood cholesterol.7 The PCE assesses the 10-year ASCVD risk considering data on age, ethnic group (African-American vs. Caucasians or others), gender, total cholesterol, HDL-C, systolic blood pressure, treatment with anti-hypertensive medications, smoking status, and the presence of diabetes. The proportion of subjects with 10-year ASCVD risk were assessed and the risk for being 10-year ASCVD≥7.5% were analyzed.
4. Statistical analysis
All data were presented as the mean and standard deviation and were analyzed using PASW Statistics software version 18.0 (SPSS Inc., Chicago, IL, USA). The comparisons of the mean values and the prevalence of the variables among the four groups divided by HbA1c and FBG were performed with one-way analysis of variance (ANOVA) test and chi-square test. Multiple comparisons of differences in the means of continuous variables between individual groups were performed using the post-hoc analyses after one-way ANOVA test with Tukey's b test.
Logistic regression analysis was performed to analyze the odds ratio (OR) for increased 10-year ASCVD risk in the four groups divided by HbA1c and FBG. Statistical significance was defined by a p value less than 0.05.
RESULTS
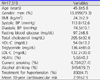
The general characteristics of the participants are presented in Table 1. The mean age of the participants was 46 years and 79.3% were men. The mean BMI was 24.3 kg/m2 and the mean HbA1c was 5.66%.
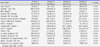
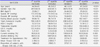
The classification of the groups according to the FBG levels indicated that the subjects in the highest group were the oldest and the most obese among the four groups (Table 3). The mean 10-year ASCVD risk increased as the mean FBG increased from the lowest to the highest group, although groups III and IV did not show any significant differences in the post-hoc analyses (Table 2).
The classification of the groups according to HbA1c quartiles indicated that the subjects in the 4th quartile were the oldest and mostly obese among the four groups (Table 2). Other metabolic parameters showed a significant increase from the lowest to the highest quartile groups. The mean 10-year ASCVD risk increased as the mean HbA1c increased from the lowest to the highest quartile group (Table 3).
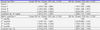
When logistic regression analyses were performed with the 10-year cardiovascular risk of ≥7.5% as the dependent variable, the OR increased from group I to IV according to the FBG (Table 4). This significance was maintained even after adjusting for age, BMI, and fasting insulin levels. When 10-year ASCVD risk of ≥7.5% was calculated according to 10 mg/dL of FBG increment, OR was 1.208 after adjustment for age, BMI, and fasting insulin levels (Table 4).
When the OR for the 10-year ASCVD risk of ≥7.5% was analyzed using logistic regression according to the HbA1c quartile groups, the OR significantly increased from quartile I to IV (Table 4). This significance was maintained even after adjusting for age, BMI, and fasting insulin level. When 10-year ASCVD risk of ≥7.5% was calculated according to 1% of HbA1c increment, OR was 1.367 after adjustment for age, BMI, and fasting insulin levels (Table 4).
DISCUSSION
In this study, we observed that the estimated 10-year ASCVD risk calculated using the PCE increased as the FBG increased within the non-diabetic range in apparently healthy Korean adults, although no significant differences were observed between the subjects with 110≤FBG<120 mg/dL and those with FBG ≥120 mg/dL. With regard to the HbA1c quartiles, a significantly increased estimated 10-year ASCVD risk was observed as HbA1c increased from 1st to 4th quartile groups. When logistic regression analysis was performed using the increased 10-year ASCVD risk defined by ≥7.5%, the group with FBG ≥120 mg/dL showed a 1.62-fold increased risk for a ≥7.5% 10-year ASCVD risk compared with those with FBG <100 mg/dL. With regard to HbA1c, the subjects with HbA1c ≥5.8% showed a 1.34-fold increased risk for a ≥7.5% 10-year ASCVD risk compared with those with HbA1c <5.5%. These results suggest that even within the non-diabetic range, the increase in FBG or HbA1c can increase the cardiovascular risk as calculated using the PCE.
The increased cardiovascular risk in subjects with elevated glucose levels in the non-diabetic range is still a subject of debate. In a large European multicenter study, the DECODE study confirmed that symptomatic hyperglycemia is associated with a higher future risk of mortality due to CVD among individuals with impaired glucose tolerance (IGT) compared with those with impaired fasting glucose (IFG).3 In contrast, the AusDiab study found that, compared with normal glucose tolerance, the relative risk of developing CVD events was higher among those with IFG compared with those with IGT.10 Moreover, the Atherosclerosis Risk in Communities (ARIC) study did not find any association between high FBG and coronary heart disease (CHD) or ischemic stroke, whereas HbA1c concentrations of 5.5%–6.0% were associated with a 45% increased risk of CHD but not with ischemic stroke, and HbA1c concentrations of 6.0%–6.5% were associated with a 40%–60% increased risk of both CHD and stroke compared with individuals with HbA1c levels of 5.0%–5.5%.11 A meta-analysis of 9 prospective studies concluded that a 1%–point increase in HbA1c within the nondiabetic range was associated with a 20% increased risk of CHD.12
In 2013, the ACC/AHA task force released a new report on the treatment of blood cholesterol, suggesting the four groups to benefit from statin treatment and removing the specific target levels for blood cholesterol for the reduction of CVD.6 This guideline recommended the use of a totally new risk assessment tool designated PCEs to assess the 10-year ASCVD risk. PCEs use age, gender, race, total cholesterol, HDL-C, systolic blood pressure, treatment for high hypertension, diabetes, and smoking as risk factors and is different from the Framingham Risk Score (FRS), which uses age, gender, total cholesterol, HDL-C, blood pressure, and smoking as risk factors.7,12 Although the FRS has been validated in many populations, its accuracy is somewhat limited among Asian populations.
No previous studies have estimated the 10-year ASCVD risk using the PCE for the non-diabetic status. In our study, the estimated 10-year ASCVD risk calculated with the PCE linearly increased as the groups were classified according to FBG and HbA1c. In addition, the subjects with FBG higher than 110 mg/dL showed a significantly increased (≥10%) ASCVD risk compared with those with FBG lower than 110 mg/dL. This result suggests that even within the non-diabetic glycemic range, there can be different risk stratification with different glucose levels, particularly among those with FBG higher than 110 mg/dL. This result opposes the rationale of ADA for lowering the normal range of FBG level from 110 mg/dL to 100 mg/dL, which differed from the cutoff of the World Health Organization.13,14 However, our results support those of previous studies in that subjects with IFG could have increased CVD risk, despite the absence of diabetes in those patients in that instance.15
In this study, an increase in HbA1c higher than 5.5% resulted in a linearly increased risk for a 10-year ASCVD risk ≥7.5% calculated with the PCE. The cutoff of 5.5% was a value defined accidentally when dividing the population into four groups, not an artificial selection. In the ARIC study, subjects with an HbA1c level higher than 5.5% showed a significantly increased risk for CHD.11 The agreement of the cutoff with that of a previous study in which the ASCVD risk was assessed using the actual occurrence of CVD events could have occurred by chance or it's the actual fact; thus we should interpret the result cautiously.
This study has a few limitations worth noting. First, the glycemic status was assessed only using HbA1c and FBG, and not using a glucose challenge test. Therefore, there could be alterations in the diagnosis of the glycemic status if both FBG and post-challenge glucose had been measured. However, many studies have reported the accuracy of measuring only FBG levels for the detection of diabetes or prediabetes in mass screening programs.16,17 Secondly, the status of the cardiovascular burden was assessed only using the PCE, not using the actual CVD events. However, the purpose of this study was not to assess the correlations with the real CVD risk, but to observe that the PCE could be validated in subjects with prediabetes. In addition, we aimed to compare the agreement of PCE values with the glycemic status assessed using HbA1c or FBG. Therefore, further studies should be performed to prove the accuracy of the PCE to predict actual CVD events in subjects with prediabetes. In spite of these limitations, this is the first study to analyze the 10-year ASCVD risk calculated using the PCE in subjects with prediabetes.
In conclusion, we found that the 10-year ASCVD risk calculated using the new risk calculator, the PCE, increased linearly as the glycemic status assessed using both HbA1c and FBG worsened in the non-diabetic range in Korean subjects without underlying diabetes. This result corroborates previous findings in which the CVD risk assessed using the PCE increased as the glucose level increased even in the non-diabetic range. Further studies are necessary to confirm the results of our study in different ethnic groups.
 XML Download