

 PDF
PDF Citation
 Print
Print


INTRODUCTION
Diabetes mellitus (DM), which is the sixth leading cause of death in Korea, has a prevalence rate of 13.9% in adults older than 30 years and that of 27.6% in those aged over 65. As the prevalence of diabetes in older individuals is expected to increase further due to population aging, necessary preparation is warranted [1].
Older adults with diabetes are more likely to experience complications and have a higher risk of cardiovascular disease than younger adults because blood sugar control becomes more difficult due to the physiological changes associated with aging [2]. Diabetes is a chronic disease that requires lifelong management because it is difficult to cure; moreover, to reduce the prevalence of diabetes, its early prevention is extremely important. Smoking, lack of physical activity, and poor eating habits have been reported as major risk factors for diabetes [3]. As dietary habits are less challenging to control than other factors, establishing an optimal nutrient intake is imperative for diabetes prevention and management.
Despite strong presumptive evidence of relationships between certain diseases and particular nutrients, studies have often demonstrated negligible or no associations between them [4]. Data analyzed using general statistical techniques including linear regression are often difficult to interpret correctly when the sample size is small, the functional relationship is unknown, or the relationship among several factors is complex and highly correlated; furthermore, identifying a specific inherent type or influencing factor is not easy. The neural network proposed to address this challenge is an artificial intelligence data analysis method that identifies patterns or knowledge hidden in large-scale data and showed better performance against linear regression in predicting diabetes [5]. In the early days, it was merely a simple logical operator; however, with the rapid advancement of computer calculation speed, its application field has gradually widened, and it has actively been used in medical systems for diagnosis and prediction of diseases such as hypertension [6], hyperlipidemia [7], and cardiac arrhythmia [8].
When configuring a neural network system, increasing the number of input factors complicates the system’s structure, thus amplifying the amount of computation and consuming considerable time. After simplifying the system and enhancing its performance by excluding input factors with a relatively low contribution, identifying factors essential for generating an efficient system becomes expedient [91011].
The disadvantage of the neural network system is that only the output value can be derived, and the extent to which the input variable contributes to this output cannot be determined. By incorporating sensitivity analysis into the neural network system, the relative contribution of each participating input factor can be expressed as a quantified number [121314]. Therefore, it is possible to develop an optimized neural network system that reveals the maximum predictive accuracy when the minimum input factors necessary for constructing a neural network are determined through an iterative process of sequentially removing minimally contributing factors and monitoring the prediction-rate trend. By so doing, the predictive importance of each input factor can be determined. To date, most studies on diabetes prediction using neural networks have evidently employed non-nutrient input factors, such as body mass index (BMI), diastolic blood pressure, stress, smoking, and age [151617], and few studies have constructed neural network systems based on nutrient factors. In particular, few cases exist in which sensitivity analysis has been applied to improve the prediction rate when constructing a system.
Therefore, this study established a nutrient intake-based diabetes-prediction system for the older population using neural network sensitivity analysis. The contribution of each nutrient to diabetes prediction was determined to pave way for future nutrient intake-based diabetes predictions in older individuals. This study’s findings will prove useful as fundamental data for customized nutrition education based on the identified nutrients.
SUBJECTS AND METHODS
Study design
Data and participants
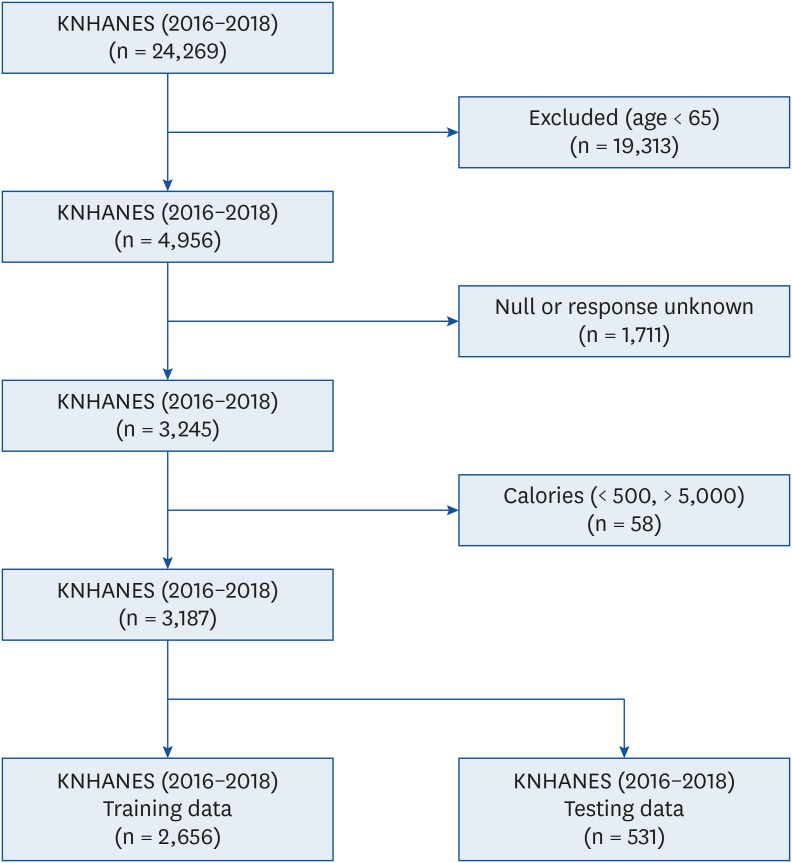
This study utilized data from the 7th Korea National Health and Nutrition Examination Survey (KNHANES) (2016–2018). In particular, nutritional intake data on older adults aged over 65 years from a total of 24,269 participants were analyzed. A total of 4,956 older individuals were included in the KNHANES during this period, and 3,245 of them participated in both the “check-up survey” and “nutrition survey.” In total, 3,187 participants (1,303 men and 1,884 women) were finally selected after excluding those whose daily caloric intake was < 500 kcal or > 5,000 kcal (n = 58) to avoid errors due to anomalous food intake. To construct this neural network system, training and test data are required; therefore, 2,656 of the included participants were assigned to the training subset, while 531 were preserved for test one according to the 6-fold cross validation theory (Fig. 1) [16].
Variable classification
The survey participants’ nutrient intakes were set as input factors. Nutrient intake data were collected using the individual 24-hour dietary recall method during the KNHANES nutrition survey. The nutrient factors used in this analysis included energy, carbohydrates, protein, fat, sugar, cholesterol, vitamin A, thiamine, riboflavin, niacin, vitamin C, calcium, phosphorus, sodium, potassium, and iron. The values of all nutrient input factors were converted to render them suitable neural network input data of the same scale through normalization. The diagnostic criteria for diabetes constituted the output variable. Diabetes was diagnosed using diabetes diagnosis criteria based on the World Health Organization (WHO) classification of diabetes mellitus [18]. It was defined as a fasting plasma glucose level ≥ 126 mg/dL.
Analysis methods
Neural network
A neural network comprises an input layer, several hidden layers, and an output layer, and each layer is composed of nodes (or neurons) that receive, calculate, and transfer data to the subsequent layer (Fig. 2). Data calculation at the node proceeds in the order of weight multiplication, summation, and activation-function application. Output y can be calculated using input x in the following expression,
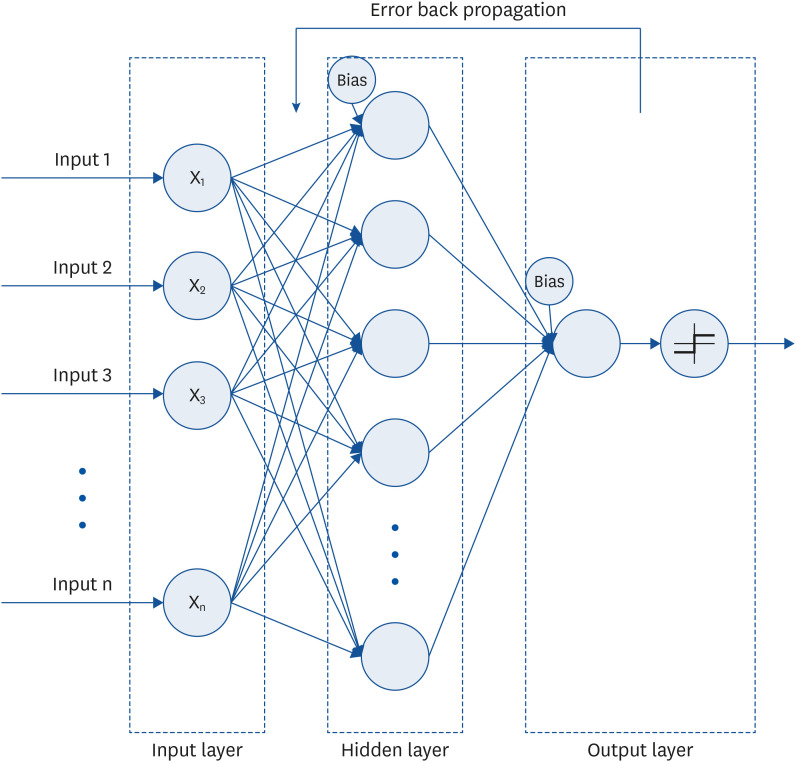
w and u are the weights and b is the bias value while f and g represent the activation functions. At this time, the weight is updated to minimize the error, which is the difference between the value predicted in the output layer and actual value yielded by the training process according to the error backpropagation algorithm [19]. After the neural network has undergone this training process, its predictive accuracy is confirmed by subjecting the test data to verification, and the neural network’s suitability is determined from this process.
This study applied the supervised learning theory [20], which uses data that exhibit correlations between input and output variables, to construct a neural network. As 16 nutrient factors were applied to the input factors, the number of nodes in the input layer was set to 16, one hidden layer was used, and the output layer comprised one output node. Predictive accuracy was determined by applying the verification data to the neural network constructed using the training data. A mean square error (MSE) of 0.005 or 1,000 epochs of training was applied as a condition for completing neural network training. The neural network system was developed using MATLAB (R2023a; MathWorks, Boston, MA, USA) software.
Sensitivity analysis
Sensitivity analysis is a statistical analysis method used in various fields to remove unnecessary or noisy variables from the predictive model and select input variables that have the greatest impact on the overall performance as important factors. The sensitivity index (pi), as a quantitative measure, indicates the importance of each input factor and is calculated as the ratio of output-factor change to input-factor change (input perturbation method) [21].
yimax, yimin: maximum and minimum output with respect to the ith input variable xi
σi: standard deviation of the ith input variable xi
mj: mean of the jth input variable xj
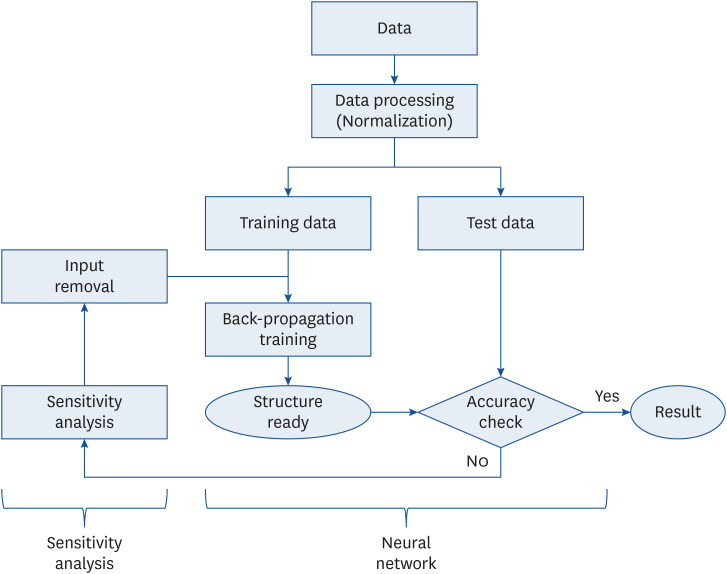
In the sensitivity analysis, after reconstructing the neural network via a new training process that removed one input factor each time, the updated predictive accuracy was compared with the previous predictive accuracy, and this process was repeated until the predictive accuracy was optimized (Fig. 3). Sensitivity analysis can reduce the number of input factors in the neural network system, thereby reducing the time and cost required for calculation and improving predictive performance by combining optimal input factors [2223].
This study performed a sensitivity analysis of the neural network to obtain the sensitivity index values of 16 input factors. The neural network’s predictive accuracy was updated after training it with 15 inputs, excluding the input factor with the lowest sensitivity index value, and compared with its previous accuracy involving all 16 input elements. By repeating this procedure, the final neural network structure eventually included factors exhibiting the highest predictive accuracy.
RESULTS
Neural network performance evaluation
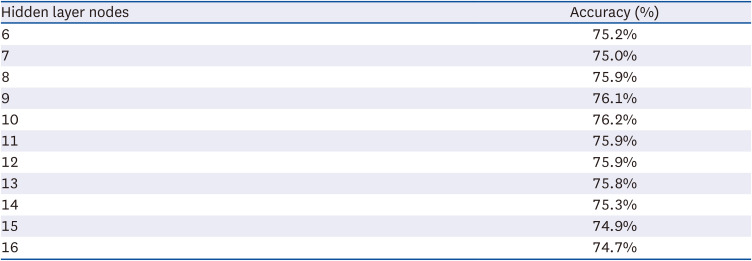
To construct a neural network, its basic structure must initially be formed, and the number of nodes must be determined for each of the input, hidden, and output layers. In the input layer, 16 nodes representing 16 nutrients were set, and in the output layer, one node predicting diabetes was established. Regarding the hidden layer connecting the input and output layers, the prediction results (accuracy) were compared while varying the number of nodes from six to 16, since predictive accuracy potentially varies with the number of nodes. Table 1 shows the accuracy of the hidden layer according to the number of nodes. When the number of hidden layer nodes was 6, the accuracy was 75.2%, and as the number of nodes increased, the accuracy also increased. The highest accuracy (76.2%) was yielded when there were 10 nodes, and the accuracy subsequently decreased as the number of nodes exceeded 11. Accordingly, the optimal number of nodes for the hidden layer was set to 10, and the structure was confirmed.
Table 1
Accuracy values for hidden layer nodes
| Hidden layer nodes | Accuracy (%) |
|---|---|
| 6 | 75.2% |
| 7 | 75.0% |
| 8 | 75.9% |
| 9 | 76.1% |
| 10 | 76.2% |
| 11 | 75.9% |
| 12 | 75.9% |
| 13 | 75.8% |
| 14 | 75.3% |
| 15 | 74.9% |
| 16 | 74.7% |
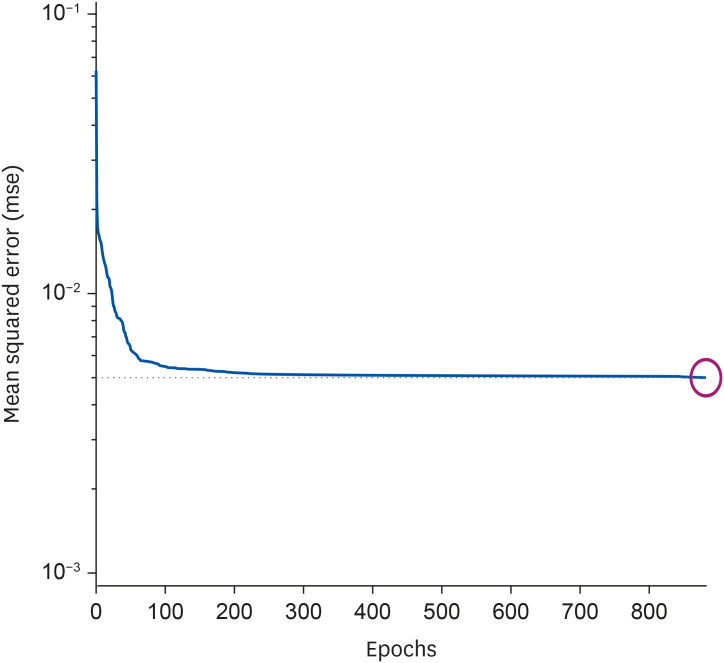
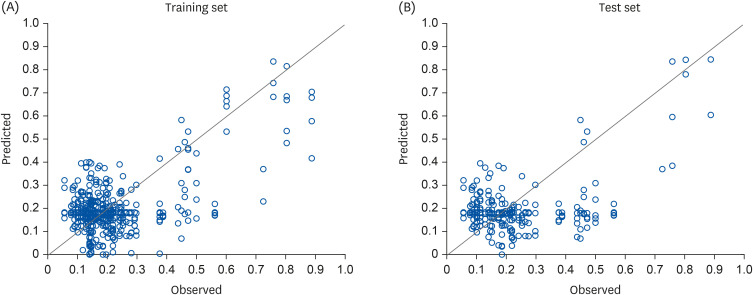
Fig. 4 shows the output error value as the neural network training proceeded. The MSE rapidly decreased from 0.6 at training initiation to 0.006 at 80 epochs, and training ended when a target error value of 0.005 was reached at 882 epochs. Fig. 5 shows the relationship between the observed and predicted DM outputs by comparison at the training and test stages. The accuracy of the training stage was 84.1%, which exceeded that of the test stage (76.2%). This revealed a vast variance as R2 ranged from 0.375 for the training set to 0.517 for the test set [24].
Sensitive analysis and optimization
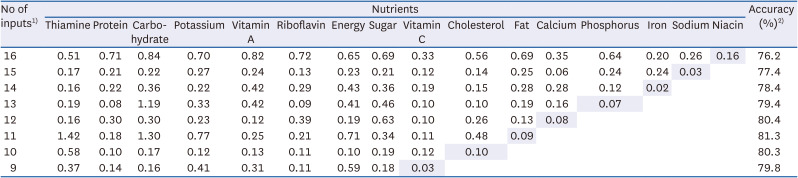
In this study, a sensitivity analysis was conducted to identify the nutrient combination displaying the highest accuracy for the trained neural network and determine the importance of each nutrient. Table 2 shows the predictive accuracy of each nutrient combination at its corresponding stage and sensitivity index (pi) when applying the neural network sensitivity analysis. In the study’s initial stage, the neural network was completed by applying all 16 nutrients, and the accuracy was 76.2%. The sensitivity analysis conducted thereafter revealed a range of values for each nutrient factor of 0.16–0.84, and niacin exhibited the lowest value (0.16).
Table 2
Sensitivity index (pi) distribution at each neural network step
 : The nutrient with the lowest pi at each step, and the corresponding input would be removed in the subsequent step.
In the next step, a neural network was generated by applying 15 nutrients after excluding niacin, which yielded the lowest pi
value; this produced an accuracy of 77.4%, an improvement from the previous outcome, which involved 16 factors. The range of pi
values for 15 nutrients was 0.03–0.27, and sodium exhibited the lowest value (0.03). Therefore, the subsequent step, which involved 14 nutrients after excluding sodium, yielded an accuracy of 78.4% as a result of repeated sensitivity analyses, marking an improvement from the previous value, and iron exhibited the lowest pi
value among the nutrients. Accordingly, the nutrients with the lowest sensitivity index values at each stage were excluded, and as iron and phosphorus were sequentially excluded, the accuracy increased to 79.4% and 80.4%, respectively.
The accuracy peaked at 81.3% in the subsequent step, when 11 nutrient combinations were applied after excluding calcium. Thereafter, as the number of nutrient combinations decreased to less than 10, the accuracy also decreased; moreover, when fat and cholesterol were sequentially excluded, the accuracy values were 80.3% and 79.8%, respectively. Accordingly, the number of nodes in the input layer of the most optimal neural network structure was 11, and the nutrient factors applied at this time were thiamin, carbohydrates, potassium, energy, cholesterol, sugar, vitamin A, riboflavin, protein, vitamin C, and fat. At this time, the maximum accuracy was 81.3%.
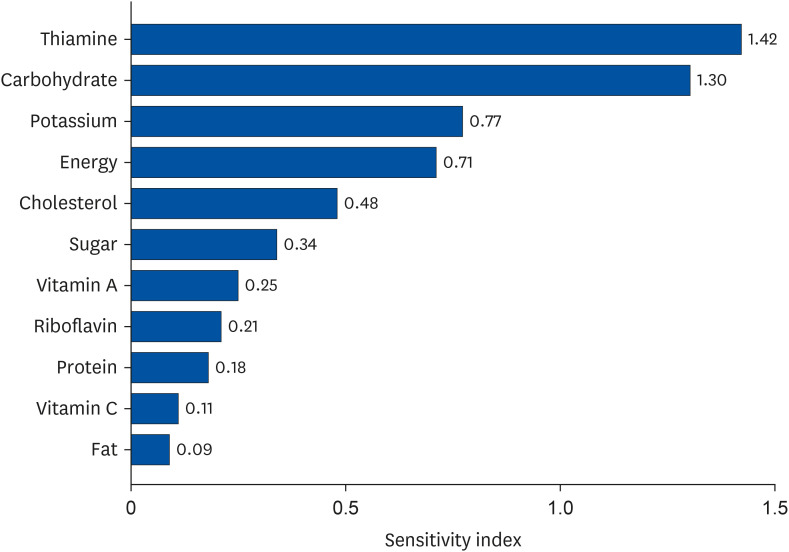
Fig. 6 shows the sensitivity index of each nutrient among the 11 nutrient factor combinations that demonstrated the maximum accuracy. The pi
values of thiamin and carbohydrates were relatively high (1.42 and 1.3, respectively), thus indicating their importance as nutrients in prediction. The sensitivity index values of potassium and energy were relatively high (> 0.5), followed by those of cholesterol, sugar, vitamin A, riboflavin, protein, vitamin C, and fat.
DISCUSSION
Older adults with diabetes encounter multifaceted challenges, such as economic, physical, and physiological functional problems; thus, managing their blood sugar levels is difficult, and their quality of life deteriorates. Therefore, appropriate customized management is required. On this premise, investigating the nutritional characteristics related to diabetes prevalence in the older population in Korea is considerably significant as it may enable the customized management of older patients with diabetes.
To date, studies on diabetes prediction using neural network systems have predominantly focused on adults, and few studies have paid attention to the older population. In addition, the input factors used to establish diabetes-prediction systems have mainly been BMI, blood pressure, stress, and smoking, and since few studies have used nutrients, obtaining information on the contribution of nutrients to diabetes prediction proves difficult.
This study conducted a neural network sensitivity analysis using nutrient factors to 1) establish an efficient, nutrient-based diabetes-determination neural network system for older KNHANES participants and 2) identify nutrients strongly related to diabetes onset to prevent diabetes. Its findings were intended to be used as fundamental data for customized nutrition education.
To efficiently configure a neural network’s structure, minimizing the number of constituent neurons (nodes) for each input, hidden, or output layer is necessary. In this study, 16 nodes were set to accommodate 16 nutrients in the input layer, and one node was set to predict diabetes in the output layer. Since predictive accuracy varies depending on the number of nodes in the hidden layer, 10 nodes with the highest predictive accuracy were identified via repeated experiments. Depending on the research conditions, the number of nodes in the neural network’s hidden layer was found to differ. A previous study that constructed a neural network for predicting diabetes in adults in the United States used 12 nodes [16] in the hidden layer, whereas another that constructed a neural network for predicting blood sugar in Korean adults used 7 [25]. The accuracy of the training process using training data was 84.1%, while that of the test phase using test data was 76.2%. In general, the predictive accuracy of the testing stage tends to be lower than that of the training stage [26].
In this study, a neural network system was developed based on 16 nutrients, namely, energy, carbohydrates, protein, fat, sugar, cholesterol, vitamin A, thiamine, riboflavin, niacin, vitamin C, calcium, phosphorus, sodium, potassium, and iron, which have not been used as input factors in previous studies. The diabetes predictive accuracy was 76.2%, which is not lower than that yielded by a non-nutrient-based neural network that was attempted in previous studies.
Güldoğan et al. [27] conducted a study on the establishment of a diabetes-prediction neural network system using the American Pima Indian female database, which is characterized by a high diabetes incidence rate. They used eight input factors as number of pregnancies, plasma glucose concentration, diastolic blood pressure, triceps skinfold thickness, serum insulin, BMI, diabetes pedigree function, and age and achieved predictive accuracy of 78.1%. Ryu et al. [28] constructed a diabetes-prediction neural network using KNHANES data and yielded an accuracy of 80.0% using seven input factors: age, gender, hypertension, family history of diabetes, smoking status, BMI, and waist circumference. In a study by Agliata et al. [16], a diabetes-prediction neural network system was generated using US National Health and Nutrition Examination Survey data, and the following nine input factors were used: sex, age, high-density lipoprotein (HDL) cholesterol, glucose, systolic blood pressure, diastolic blood pressure, triglycerides, weight, and BMI. Applying these factors yielded a relatively high accuracy of 86%. In contrast, Liu et al. [17] constructed a neural network system for predicting diabetes in Chinese older adults aged over 65 years using the following eight input factors: education, BMI, waist circumference, fasting plasma glucose, total cholesterol, triglyceride, HDL-cholesterol, and alanine aminotransferase and achieved a low predictive accuracy of 60.7%.
In a neural network system, configuring input factors with appropriate variables is directly related to improving the training ability of the neural network and securing excellent predictive accuracy. In the case of a model involving numerous input factors, including a factor with a negligible contribution or weak correlation potentially decreases the model’s predictive accuracy; therefore, optimization via a sensitivity analysis technique is required. In addition, the general neural network structure thus far merely shows the resulting predictive accuracy based on input factors; however, it is limited in that it cannot determine how each input factor contributed to the predicted outcome. However, the sensitivity index resulting from neural network sensitivity analysis may indicate the relative importance of each input factor in predicting the output.
Among the various sensitivity analysis methods available, this study selected the perturbation method [29], which determines the importance of an input factor by monitoring output-factor changes in response to input-variable changes. Compared with other sensitivity analysis methods, such as the stepwise elimination method [29], which removes input factors sequentially, reconstructs the neural network through an additional training process, and subsequently compares predictive accuracies to determine the importance of input factors, the perturbation method is simpler with fewer calculations and no additional training process, thereby being widely used due to its efficiency and simplicity.
In the neural network system involving 16 nutrients as input factors, the diabetes-prediction accuracy was 76.2%. Through sensitivity analysis, iron, phosphorus, calcium, fat, and cholesterol, which are nutrients of relatively low importance with low sensitivity index values, were sequentially excluded. Consequently, the predictive accuracy peaked at 81.3% with the updated neural network system of 11 input nutrient combinations, and this system was confirmed as the final structure. The 11 input factors of the confirmed optimal neural network structure were energy, carbohydrates, protein, fat, sugar, cholesterol, vitamin A, thiamin, riboflavin, vitamin C, and potassium. In particular, thiamin, carbohydrates, potassium, and energy were found to be relatively more important in predicting diabetes with higher sensitivity index values. Nutrients of high importance in predicting diabetes are not directly related to the mechanism of diabetes onset; nonetheless, they are probably related to diabetes onset to a certain extent. Therefore, in future, attention should be focused on dietary education in diabetes prevention.
Sensitivity analysis enabled a reduction in nutrient input factors from 16 to 11, thereby decreasing the number of nodes and weights and saving the time and resources required for neural network training and application. The predictability and efficiency were found to greatly improve compared with those previously determined.
This study aimed to classify and predict the risk of diabetes in relation to nutritional intake using a neural network model combined with a sensitivity analysis technique. It revealed that intake data alone could be useful in predicting diabetes risk. Neural network systems may present fluctuations in accuracy due to potential mechanisms such as physical activity, smoking, and genetic characteristics in addition to the nutritional intake applied in this study. Therefore, future studies should integrate risk factors that include the foregoing characteristics.
This study is based only on three years of KNHANES data and additional survey results are needed to develop a better performance neural network model for Korean older adults. Further studies utilizing multiple data of the same patient over time could lead to the development of a better neural network model for predicting disease process.
 XML Download