

 PDF
PDF Citation
 Print
Print


INTRODUCTION
Proper nutrition in young adulthood is essential for health and disease prevention in middle age and later [1]. Previous studies of young adult women reported several dietary problems, such as having irregular meals, skipping meals, imbalances in nutrient intakes, frequent consumption of convenience foods, eating-out, and inadequate consumption of foods including dairy products, vegetables, and fruits [23].
Having breakfast is a healthy behavior, vital for improving diet quality, work performance, cognitive function, and maintaining blood glucose. In contrast, skipping breakfast might lead to overeating in other meals and increase the risk of diseases, including obesity, diabetes mellitus, and metabolic syndrome [45]. Approximately 54.7% of Korean women aged 19–29 years skipped breakfast in 2021, which was the highest in all age groups of women [2]. Similarly, previous studies reported that having breakfast infrequently or skipping breakfast is common in young adult women [678]. Those who skipped breakfast had lower nutrient intakes such as carbohydrates, fiber, vitamin C, calcium and iron [6]. The major reasons for skipping breakfast in young women included waking up late, lack of time to have breakfast, no appetite, and habit. Young adult women also skipped breakfast to control weight [7891011]. In addition, those who skipped breakfast showed characteristics of living alone, having a lower household income, and a higher frequency of drinking alcohol [810].
The factors associated with breakfast consumption are essential to promote breakfast consumption. Theory-based research makes it possible to examine the factors influencing nutrition behaviors systematically. The Social Cognitive Theory (SCT) or the Theory of Planned Behavior (TPB) has been used to examine the psychosocial factors explaining nutrition behaviors [1213141516]. The SCT emphasizes reciprocal determinism, where a person’s cognitions, behaviors, and environment influence each other. Personal cognitions include constructs, such as outcome expectations, self-efficacy, and knowledge. The behavioral factors indicate if one has behavioral capabilities or skills. Constructs, such as intentions and reinforcement, were also classified as behavioral factors because these support the performance of health or nutrition behaviors. The environmental constructs include observational learning, social support, normative beliefs, and barriers/opportunities to perform the behavior [12]. Among these constructs, outcome expectations are beliefs regarding the advantages or disadvantages/barriers of performing a behavior. Self-efficacy refers to the perceived confidence in doing a behavior [12]. The TPB suggests that the intention to perform a behavior is a major determinant of the behavior, and the intention is influenced by attitudes, subjective norms, and perceived behavioral control [15]. These three factors are determined by the salient beliefs: behavioral, normative, and control beliefs. In particular, personal attitudes are determined by behavioral beliefs and evaluation of the beliefs. The subjective norms are formed by normative beliefs about what significant others think the individual should do and the motivation to comply with their significant others, suggesting the social influence in a person’s environment. The perceived behavioral control is determined by the control beliefs and the perceived power of each condition, making the behavior easy or difficult [15]. The outcome expectations in the SCT are similar to the behavioral beliefs in the TPB, and self-efficacy in the SCT is similar to the control beliefs in the TPB.
Previous studies of breakfast examined the status of nutrient intake, its relationship with obesity or other chronic diseases, and some demographic characteristics [1718], and only a few studies examined the psychosocial factors related to having breakfast [13192021]. In a study with Iranian university students applying the SCT, Askari et al. [13] reported that self-efficacy and observational learning were important for predicting breakfast consumption. Reeves et al. [19] showed that breakfast consumption was related to the beliefs and exercise level in UK adults, but other psychosocial factors were not examined in this study. Kim et al. [20] reported that factors in the TPB, attitudes, subjective norms, and perceived difficulty in access to breakfast or time restriction were related to having breakfast in a study with Korean adolescents. Previous studies applying the SCT or the TPB in examining breakfast behavior have been conducted with Korean adolescents, children or university students in Iran [132021]. On the other hand, a few studies applied the SCT or TPB to examine the factors associated with having breakfast among young adult women in South Korea. This study examined the breakfast status, and investigated if diverse psychosocial factors, such as the beliefs regarding having breakfast, self-efficacy, subjective norms, and eating behaviors, differ according to the breakfast frequency among female university students in South Korea. The psychosocial factors were based on some constructs suggested in the SCT and the TPB. This study will provide information for planning nutrition education for young adult women to promote breakfast consumption.
SUBJECTS AND METHODS
Subjects
The subjects were female students attending the university in Seoul, South Korea. The subjects were recruited from students taking liberal arts courses. The researcher explained the study, and students who agreed to participate in the survey completed informed consent. Three hundred and twelve students responded to the survey questionnaire in 2016. Incomplete responses on the breakfast frequency or major study variables were excluded, and the data of 291 students were used in statistical analysis (93.3% of response rate). The Institutional Review Board of Seoul Women’s University approved this study (IRB-2015A-4).
Measurements
The questionnaire draft was made based on the literature on the breakfast status and associated factors [822232425]. After revising the draft, the questionnaire included the general characteristics, breakfast status, beliefs regarding having breakfast, self-efficacy, subjective norms for breakfast, and eating behaviors.
General characteristics and breakfast status of subjects
The general characteristics measured were age, height, weight, grade, and residence type [22]. The items to measure the breakfast status included the breakfast frequency per week, place and people who eat breakfast together, person who prepares breakfast, breakfast menu and considerations in menu selection, support of significant others for breakfast, and methods of support for breakfast [78].
Beliefs regarding having breakfast
The beliefs regarding having breakfast were measured using 15 items, assessed on a 5-point scale of ‘strongly disagree’ (1) to ‘strongly agree’ (5) [819]. Factor analysis revealed 8 items regarding the advantages of having breakfast, 4 items regarding the disadvantages/barriers because of the lack of time or preparation difficulties, and 3 items regarding the disadvantages/barriers because of a lack of appetite or indigestion. The total score for beliefs regarding having breakfast was calculated by summing the 15 items while coding the scores of the disadvantage/barrier items reversely. A higher total or subscale score of beliefs regarding the advantages of breakfast showed subjects having more favorable beliefs. In contrast, the higher subscale score on beliefs regarding disadvantages/barriers indicates that subjects have more unfavorable beliefs. The Cronbach’s α was 0.767 (total beliefs), 0.781 (beliefs regarding the advantages of having breakfast), 0.653 (beliefs regarding the disadvantages/barriers because of the lack of time or preparation difficulties), and 0.746 (beliefs regarding the disadvantages/barriers because of a lack of appetite or indigestion).
Self-efficacy
Self-efficacy was measured using 12 items by asking about the perceived ability to perform behaviors [1423]. Self-efficacy had 2 subscales based on factor analysis. Self-efficacy regarding having breakfast was composed of 5 items, including the perceived ability in ‘waking up 15–20 min early to eat breakfast’, ‘preparing breakfast easily’, and ‘eating breakfast consisting of foods rich in proteins and vegetables’. Self-efficacy regarding general eating behaviors consisted of 7 items, including the perceived ability in ‘controlling eating high-calorie foods late at night,’ ‘eating meals with less salty foods,’ and ‘drinking milk instead of carbonated beverages’. Each item was assessed on a 5-point scale of ‘very difficult’ (1) to ‘very easy’ (5). A higher total or subscale score, which was the summated score on each scale, suggested that the subjects had more confidence in performing the behaviors. The Cronbach’s α was 0.772 (total self-efficacy), 0.789 (self-efficacy regarding having breakfast), and 0.649 (self-efficacy regarding eating behaviors).
Subjective norms for breakfast
The subjective norms were measured by normative beliefs and the motivation to comply [1624]. The significant others for having breakfast in young adults included parents, siblings, best friend, friends, health professionals, professors, and mass media. The normative beliefs were rated on a 5-point scale of ‘strongly disagree’ (1) to ‘strongly agree’ (5). The motivation to comply with each referent was also assessed on a 5-point scale of ‘not at all’ (1) to ‘very much’ (5). The subjects were asked to check on a response category (0) if each referent did not apply to them. The subjective norms for each referent were the product of normative belief and the corresponding motivation to comply. Two subscales were obtained from factor analysis: subjective norms from siblings/friends (3 items), and subjective norms from parents/professionals (4 items). The total or subscale score for subjective norms was the summated score. A higher total or subscale score indicated that subjects had more pressure from significant others to have breakfast. The Cronbach’s α was 0.824 (total subjective norms), 0.821 (subjective norms from siblings/friends), and 0.722 (subjective norms from parents/professionals).
Eating behaviors
The eating behaviors were measured using 15 items: 8 items of desirable eating behaviors (e.g., eating various foods, consumption of grains, and vegetables) and 7 items of undesirable eating behaviors (e.g., eating salty foods, sweets, and instant foods) [2526]. The subjects responded to one of three frequency categories for each eating behavior. For the total score, each item was coded from 1 (0–2 days/week) to 3 (6–7 days/week), and undesirable behaviors were coded reversely. The total or subscale score for eating behaviors was obtained by summing the score. A higher total or subscale score of desirable eating behaviors indicates that subject have more desirable eating behaviors. A higher subscale score of undesirable eating behaviors indicates more undesirable eating behaviors. The Cronbach’s α was 0.615 (total eating behaviors), 0.705 (desirable eating behaviors), and 0.584 (undesirable eating behaviors).
Statistical analysis
The Statistical Package for Social Sciences (SPSS, PASW Statistics 21.0; SPSS Inc., Chicago, IL, USA) was used in data analysis. The subjects were divided into a high-frequency breakfast group (HBG, 4 or more days per week) and a low-frequency breakfast group (LBG, 3 or fewer days per week) based on previous studies of breakfast frequency grouping [2728] and the distribution of subjects on the breakfast frequency in this study. χ2-test, t-test, or analysis of covariance (ANCOVA) were used to analyze the differences in variables, such as beliefs, self-efficacy, subjective norms, and eating behaviors between the HBG and the LBG. The age and residence type among the general characteristics were the covariates in ANCOVA to analyze the relationship of variables to the breakfast frequency group. Factor analysis was conducted to examine the subscales of variables. Multiple linear regression was conducted to examine the relationship of variables to the breakfast frequency. Multiple linear regression was done separately, at the total and subscale score of variables, and the final model was obtained using backward elimination. Statistical significance was set at P < 0.05.
RESULTS
General characteristics of subjects by the breakfast frequency group
The subjects were 19.7 years of age on average. The mean height and weight were 161.8 cm and 54.9 kg, respectively, with a mean body mass index (BMI) of 21.0 (Table 1). Approximately 47.4% of the subjects were freshmen, and 26.1% were sophomores. With respect to the residence type, 73.2% of subjects lived with family members, while 26.8% resided in the dormitory or by themselves.
Table 1
General characteristics of the subjects according to the frequency of having breakfast
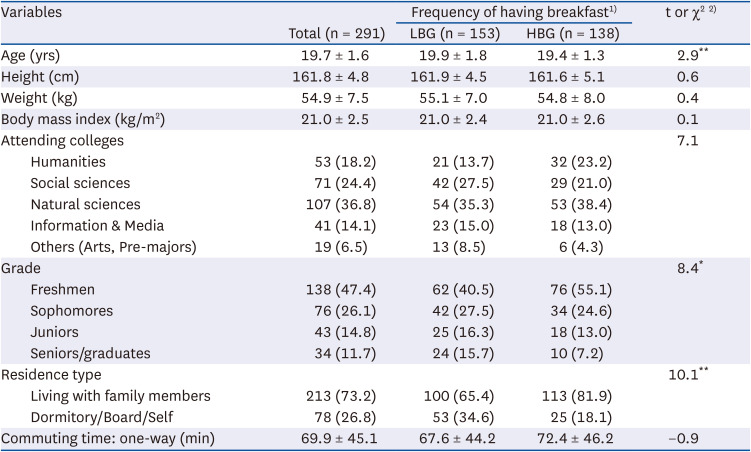
Approximately 47.4% of subjects were grouped into the HBG. Among the general characteristics, age (P < 0.01), grade (P < 0.05), and residence type (P < 0.01) differed significantly according to the breakfast frequency group. Compared to the LBG, the mean age was significantly lower; the proportion of freshmen and subjects living with family members were higher in the HBG (Table 1).
Status of having breakfast by the breakfast frequency group
The subjects ate breakfast 3.6 days per week on average, with 1.8 days per week in the LBG and 5.6 days per week in the HBG (P < 0.001; Table 2). The place and people who ate breakfast together differed significantly according to the breakfast frequency group. Those who had breakfast at home was 84.8% in the HBG and 60.8% in the LBG (P < 0.001), and those who ate alone were significantly lower in the HBG (39.1%) than the LBG (65.4%, P < 0.001).
Table 2
Breakfast status according to the frequency of having breakfast
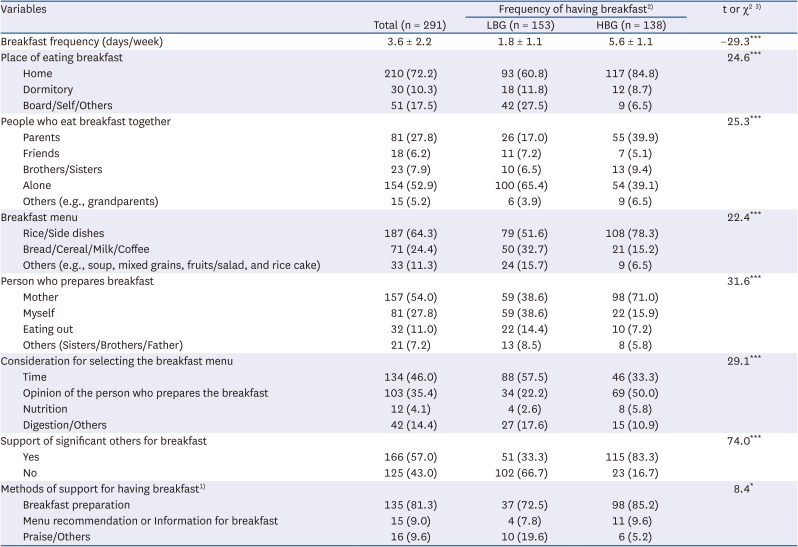
Regarding the breakfast menu, those who consumed Korean food were significantly higher in the HBG than the LBG (P < 0.001). ‘Time’ and ‘digestion’ were more important considerations in selecting the breakfast menu in the LBG than the HBG (P < 0.001). Those who made the breakfast also differed between the LBG and HBG (P < 0.001). Approximately 83.3% of the HBG reported that they had support from significant others for breakfast, while only 33.3% of the LBG had support for breakfast (P < 0.001). Breakfast preparation (81.3%) was the main support method for breakfast, followed by ‘praise/others’ (9.6%). The method of support for having breakfast also differed significantly according to the breakfast frequency group (P < 0.05).
Beliefs regarding having breakfast by the breakfast frequency group
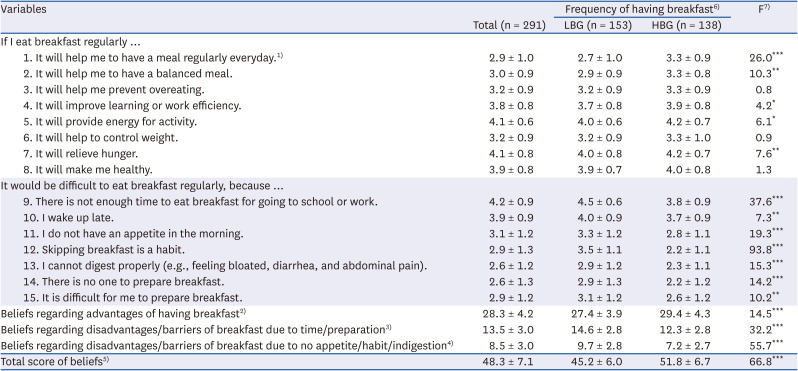
The total score for beliefs regarding having breakfast was 48.3 (64.4 out of 100), and the HBG scored significantly higher in the beliefs regarding having breakfast than the LBG (P < 0.001; Table 3). When the beliefs were examined on the subscales, the HBG agreed more with the advantages of having breakfast (P < 0.001), while they agreed less with the disadvantages/barriers of having breakfast than those in the LBG (P < 0.001).
Table 3
Beliefs regarding having breakfast according to the frequency of having breakfast
The values are mean ± SD.
1)Each item was rated on a 5-point scales from 1 (strongly disagree) to 5 (strongly agree); 2)Score of 8 items (items 1–8), possible score: 8–40; 3) Score of 4 items (items 9, 10, 14, 15), possible score: 4–20; 4)Score of 3 items (items 11–13), possible score: 3–15; 5)Total score of 15 items, possible score: 15–75. For the total score, the items from 9 to 15 were reversely coded; 6)LBG (low-frequency breakfast group): ≤ 3 days/week, HBG (high-frequency breakfast group): ≥ 4 days/week; 7)by analysis of covariance with covariates of age and residence type.
*P < 0.05, **P < 0.01, ***P < 0.001.
Twelve out of 15 beliefs showed significant differences between the LBG and HBG (Table 3). The subjects in the HBG agreed more with the advantages of having breakfast than those in the LBG, such as ‘helping me to have a meal regularly’ (P < 0.001), ‘balanced meal’ (P < 0.01), ‘relieving hunger’ (P < 0.01), ‘providing energy for activity’ (P < 0.05), and ‘good for learning or work efficiency’ (P < 0.05). On the other hand, the subjects in the LBG agreed more with all of the beliefs regarding the disadvantages/barriers of having breakfast than those in the HBG, including ‘skipping breakfast is a habit’ (P < 0.001), ‘time constraints’ (P < 0.001), ‘no appetite in the morning’ (P < 0.001), ‘indigestion’ (P < 0.001), ‘no one to prepare breakfast’ (P < 0.001), ‘difficult for me to prepare breakfast’ (P < 0.01), and ‘waking up late’ (P < 0.01).
Self-efficacy regarding breakfast and nutrition by the breakfast frequency group
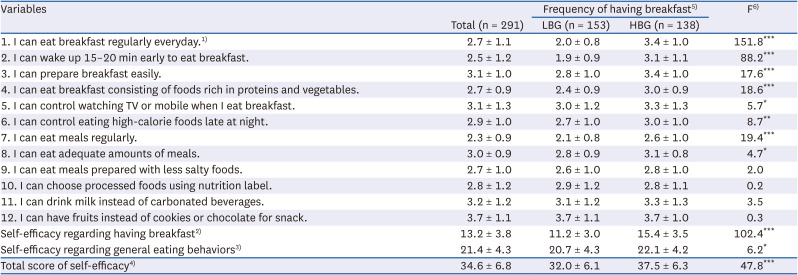
The total self-efficacy score was 34.6 (57.7 out of 100), and the HBG scored significantly higher on self-efficacy than the LBG (P < 0.001). The subscale scores for self-efficacy regarding having breakfast (P < 0.001) and self-efficacy regarding general eating behaviors (P < 0.05) were also higher in the HBG than the LBG (Table 4).
Table 4
Self-efficacy according to the frequency of having breakfast
The values are mean ± SD.
1)Each item was rated on a 5-point scales from 1 (very difficult) to 5 (very easy). 2)Score of 5 items (items 1–4, 7), possible score: 5–25; 3)Score of 7 items (items 5, 6, 8–12), possible score: 7–35; 4)Total score of 12 items, possible score: 12–60; 5)LBG (low-frequency breakfast group): ≤ 3 days/week, HBG (high-frequency breakfast group): ≥ 4 days/week; 6)by analysis of covariance with covariates of age and residence type.
*P < 0.05, **P < 0.01, ***P < 0.001.
Eight out of 12 beliefs showed significant differences between the LBG and HBG. In particular, the HBG felt more confidence in ‘eating breakfast regularly’ (P < 0.001), ‘waking up 15–20 min early to eat breakfast’ (P < 0.001), ‘eating breakfast consisting of foods rich in proteins and vegetables’ (P < 0.001), and ‘preparing breakfast easily’ (P < 0.001) than the LBG (Table 4). Those in the HBG also perceived more self-efficacy in ‘controlling eating high-calorie foods late at night’ (P < 0.01), ‘controlling watching TV or mobile while eating breakfast’ (P < 0.05), and ‘eating adequate amounts of meals’ than those in the LBG (P < 0.05).
Subjective norms by the breakfast frequency group
The total score for the subjective norms was 79.3 (45.3 out of 100), and the HBG scored significantly higher on subjective norms than the LBG (P < 0.001; Table 5). The subscale score for subjective norms from parents/professionals (P < 0.001) and from siblings/friends (P < 0.01) differed significantly between the LBG and HBG, suggesting that those in the HBG perceived more pressure to have breakfast from significant others. Five out of 7 items were significantly different between the two group, including parents (P < 0.001), sisters/brothers (P < 0.001), mass media (P < 0.01), professors (P < 0.05), and best friend (P < 0.05).
Table 5
Subjective norms according to the frequency of having breakfast
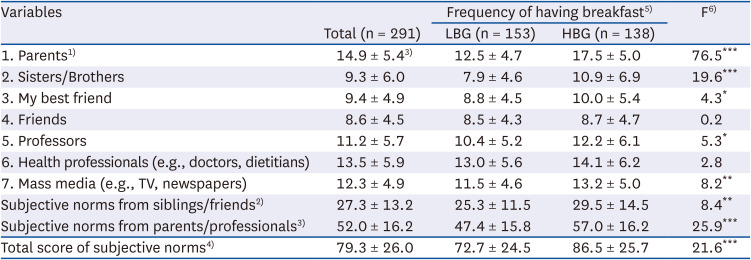
The values are mean ± SD.
1)Multiplied score of normative belief and motivation to comply. Normative belief was rated on a 5-point scales from 1 (strongly disagree) to 5 (strongly agree) and 0 (do not apply). Motivation to comply was rated on a 5-point scales from 1 (not at all) to 5 (very much) and 0 (do not apply); 2)Score of 3 items (items 2–4), possible score: 0–75; 3)Score of 4 items (items 1, 5–7), possible score: 0–100; 4)Total score of 7 items; possible score: 0–175; 5)LBG (low-frequency breakfast group): ≤ 3 days/week, HBG (high-frequency breakfast group): ≥ 4 days/week; 6)by analysis of covariance with covariates of age and residence type.
*P < 0.05, **P < 0.01, ***P < 0.001.
Eating behaviors by the breakfast frequency group
The total score for eating behaviors differed significantly according to the breakfast frequency group (P < 0.001; Table 6). Subscale level analysis showed that those in the HBG than the LBG scored significantly higher on desirable eating behaviors (P < 0.001), and lower on undesirable eating behaviors (P < 0.001).
Table 6
Eating behaviors according to the frequency of having breakfast
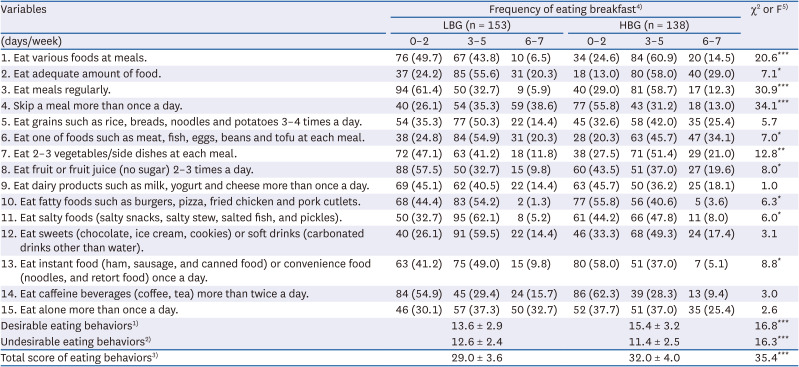
The values are number (%) or mean ± SD.
1)Score of 8 items (items 1–3, 5–9), possible score: 8–24. Each item was rated on a 3-point scales from 1 (0–2 days/week) to 3 (6–7 days/week); 2)Score of 7 items (items 4, 10–15), possible score: 7–21; 3)Total score of 15 items, possible score: 15–45. For the total score, the items (4, 10–15) were reversely coded. The higher the total score, the more desirable eating behaviors.; 4)LBG (low-frequency breakfast group): ≤ 3 days/week, HBG (high frequency breakfast group): ≥ 4 days/week; 5)by χ2-test or analysis of covariance with covariates of age and residence type.
*P < 0.05, **P < 0.01, ***P < 0.001.
Ten out of 15 items differed significantly between the LBG and HBG. Subjects who had eating behaviors, including ‘eating various foods at meals’ (P < 0.001), ‘eating meals regularly’ (P < 0.001), ‘eating 2–3 vegetables/side dishes at each meal’ (P < 0.01), ‘eating fruits/juice 2–3 times a day’ (P < 0.05), ‘eating adequate amount of food’ (P < 0.05), and ‘eating protein foods at each meal’ (P < 0.05) more frequently, were significantly higher in the HBG than the LBG. In contrast, fewer students in the HBG had undesirable eating behaviors, including ‘skipping a meal more than once a day’ (P < 0.001), ‘eating instant or convenience foods’ (P < 0.05), ‘eating fatty foods’ (P < 0.05), and ‘eating salty foods’ (P < 0.05), than the LBG.
Relationship of beliefs, self-efficacy, subjective norms, and eating behaviors to the breakfast frequency
Table 7 presents the multiple regression results of the breakfast frequency on the total score of variables. The final model, using backward elimination controlling for age and residence type, explained 39.0% of the variation in the breakfast frequency (P < 0.001). The multicollinearity among the independent variables did not exist according to the variance inflation factor (VIF < 10).
Table 7
Multiple linear regressions for having breakfast on the total score of beliefs, self-efficacy, subjective norms and eating behaviors
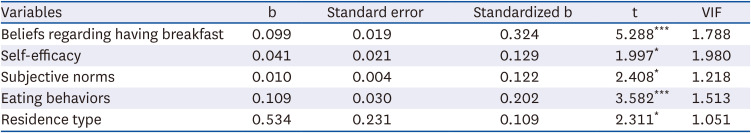
The beliefs regarding having breakfast (standardized b, β = 0.324, P < 0.001), and eating behaviors (β = 0.202, P < 0.001) were relatively strong predictors of the breakfast frequency. The self-efficacy (β = 0.129, P < 0.05), and subjective norms (β = 0.122, P < 0.05) were also associated with the breakfast frequency, although the degree of the association might be weaker than the beliefs regarding having breakfast and eating behaviors.
Table 8 shows the multiple regression results of the breakfast frequency on the subscale score of variables. The final model using backward elimination explained 57.3% of the variation in the breakfast frequency (P < 0.001). There was no multicollinearity among the independent variables based on the VIF.
Table 8
Multiple linear regression for having breakfast on the subscale score of beliefs, self-efficacy, subjective norms and eating behaviors
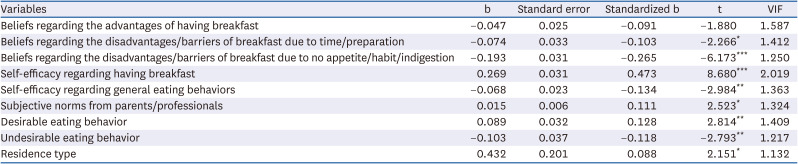
Among the subscale of variables, self-efficacy regarding having breakfast (β = 0.473, P < 0.001), and beliefs regarding disadvantages/barriers of breakfast because of a lack of appetite/habit/indigestion (β = –0.265, P < 0.001) were relatively strongly associated with the breakfast frequency. Two subscales of eating behaviors, which were desirable eating behaviors (β = 0.128, P < 0.01) and undesirable eating behaviors (β = –0.118, P < 0.01) were also significantly related to the breakfast frequency. The subjective norms from parents/professionals (β = 0.111, P < 0.05), and beliefs regarding disadvantages/barriers of time/breakfast preparation (β = –0.103, P < 0.05) explained the breakfast frequency, but the degree of the association was weaker than the other subscale variables.
DISCUSSION
This study investigated the breakfast status of female university students and examined whether psychosocial factors, including beliefs, self-efficacy, subjective norms, and eating behaviors, differed according to the breakfast frequency, applying the concepts suggested in the SCT and the TPB. Approximately 53% of subjects had breakfast 3 or fewer days per week or skipped breakfast, suggesting the inadequacy of having breakfast in young adult women. Kim et al. [10] also reported breakfast problems in young women; 49.8% had breakfast 1–4 days/week, and 25.6% skipped breakfast. A study reported that 63.9% of university students ate breakfast 4 or more days per week, which was higher than that in the present study [29].
This study showed that demographics such as age, grade and residence type, differed according to the breakfast frequency group. This finding is consistent with a previous study reporting that Chinese medical students with higher grades compared to the first class year had breakfast less regularly [17]. In particular, the percentages of those who lived alone were higher in the LBG than the HBG, suggesting that the residence type was important in the breakfast consumption of young adult women. As found in the breakfast status of subjects, those who had to prepare breakfast for themselves or those who did not have support from significant others were less likely to have breakfast. Hence, nutrition education includes how to have a simple breakfast. Consistently, a previous study reported that those who lived alone or resided in the dormitory had less frequency of eating breakfast and that ‘habit’ or ‘lack of appetite’ were the major reasons for skipping breakfast among those who lived alone [8]. In selecting the breakfast menu, ‘time’ (57.5%) was the major consideration in the LBG, while the ‘opinion of the breakfast preparer’ (50.0%) was important in the HBG. Several studies suggested that ‘lack of time’ was the major reason for skipping breakfast [8101130]. Thus, nutrition education for young adult women needs to focus on easy and less time-consuming methods of breakfast preparation. Alcohol consumption also might influence the diets of young adult women and be related to breakfast frequency. Although the results of alcohol consumption are not reported in this paper, the LBG and HBG had similar alcohol consumption (i.e., if they drink alcoholic beverages, frequency, and amount of drinking) in preliminary analysis.
This study showed that beliefs regarding having breakfast were important in breakfast consumption. The HBG was more likely to agree with the advantages of having breakfast than the LBG, while subjects in the LBG perceived more strongly the disadvantages or barriers to breakfast, such as lack of time, no appetite, indigestion, and problems with breakfast preparation. Consistently, a study with UK adults showed that frequent breakfast eaters (5 or more days per week) believed more strongly in the benefits of breakfast (i.e., breakfast assists in alertness, and daily activities) [19]. Sun et al. [17] also reported that breakfast consumption increased as subjects felt a stronger appetite. The study results suggested that education for having breakfast emphasize the specific, practical advantages of breakfast and reducing the barriers or disadvantages of having breakfast. The perceived barriers might be reduced by suggesting simple ways of preparing breakfast considering nutrition, methods of stimulating appetite, and preparing the breakfast menu with easily digestible foods.
Subjects in the HBG showed significantly higher self-efficacy for breakfast or other eating behaviors than the LBG. In particular, those in the HBG than the LBG perceived more confidence in performing diverse behaviors related to breakfast consumption, such as waking up 15–20 min early, eating breakfast consisting of diverse foods, and preparing breakfast quickly. In addition, the self-efficacy for general eating behaviors, including controlling the consumption of high-calorie foods at night and eating adequate amounts, differed between the LBG and HBG. These results support the importance of self-efficacy in nutrition behaviors. The methods to increase self-efficacy for specific eating behaviors might be used to foster breakfast consumption. An individual can increase self-efficacy through actual experience (e.g., preparation skills, simple ways of having breakfast, and the practice of desirable eating behaviors), vicarious experience, praise, and persuasion. Similar to the present study, Smith et al. [31] reported that those with higher self-efficacy for a healthy diet were more likely to eat breakfast (3 or more days/week) than breakfast skippers. Salimi et al. [32] reported that the intervention focused on the SCT, improved self-efficacy, and breakfast consumption in female university students.
This study showed that subjects in the HBG, compared to the LBG, perceived more pressure to have breakfast from their significant others. This suggests that informal groups such as parents, siblings, and formal groups (i.e., professionals) are essential sources of influence to have breakfast. In contrast, some studies partly support or did not find an association between social support and breakfast consumption [1333]. Based on the current study findings, significant others, such as parents and professionals, might help young adult women have breakfast by informing the importance of breakfast and encouraging and preparing breakfast for young adult women.
Subjects in the HBG had more desirable eating behaviors than those in the LBG. In particular, the HBG had diverse foods at meals, adequate amounts, and regular meals compared to the LBG. In addition, the HBG were more likely to eat vegetables, fruits, and protein foods, while they consumed fatty, salty, and instant/convenience foods less frequently than the LBG. Consistent with the current study, Lipsky et al. [34] reported that breakfast frequency was related to having desirable eating behaviors (i.e., fruits/vegetables and whole grains intake), while it was associated with less frequent soda intake. In the analysis using Korea National Health and Nutrition Examination Survey data, Korean adults with a lower breakfast energy intake (less than 20% of energy intake) showed a higher percentage of energy intake from protein and fat [18]. A study examining the diet quality [6] showed that dietary problems of breakfast skippers were skipping meals, irregular meals, and the lower consumption of vegetables or mushrooms than breakfast eaters, resulting in the lower intakes of vitamin C, dietary fiber, folic acid, and iron from plant foods. These studies suggested that those who have breakfast less frequently or skip breakfast were more likely to have eating behavior problems. Therefore, nutrition education should be developed considering the changes in eating behaviors and increasing breakfast consumption.
Multiple regression at the subscale level showed that self-efficacy regarding having breakfast, and beliefs regarding disadvantages/barriers (i.e., no appetite/habit/indigestion) were strong predictors of the breakfast frequency. In addition, desirable eating behaviors and subjective norms from parents/professionals were positively associated with the breakfast frequency, while undesirable eating behaviors and beliefs regarding disadvantages/barriers of breakfast due to a lack of time or preparation difficulties were negatively related to the breakfast frequency. In a study with female college students, Kim and Kim [35] reported better eating behaviors among those with a higher breakfast frequency (5 or more times per week) than those with a lower frequency, suggesting a positive relationship between breakfast frequency and eating behaviors. Ohara et al. [36] found a positive association of appetite and the inverse association of wake time with breakfast frequency, which were the major perceived barriers to having breakfast in the present study. A previous study [37] reported that a high level of self-efficacy, fewer perceived barriers, and fewer competing demands (e.g., staying longer in bed in the morning, and time constraints) were significant predictors of regular breakfast consumption.
This study was conducted with a sample of female university students in Seoul, South Korea. Thus, there are limitations to generalizing the study results to different groups of young adult women. In addition, household socioeconomic variables such as family income and home food environment, might influence the diet of young adult women, were not assessed, which might be another limitation of this study. In summary, this study showed that self-efficacy regarding breakfast, the perceived barriers to having breakfast, practicing desirable eating behaviors, limiting undesirable eating behaviors, and subjective norms from parents or professionals were important in explaining breakfast frequency. Thus, nutrition education for young adult women needs to focus on increasing self-efficacy for breakfast and reducing the perceived barriers to having breakfast because of lack of appetite, indigestion, time constraints and preparation skills. Nutrition education might include strategies to provide tips and simple recipes for breakfast preparation, and suggest breakfast menu considering nutrition and digestion. Self-efficacy could be increased by improving eating behaviors gradually, modeling other people’s behaviors, and encouraging confidence in having breakfast. In addition, nutrition education might employ strategies to improve specific eating behaviors and elicit social support from significant others for having breakfast.
 XML Download