

 PDF
PDF Citation
 Print
Print


INTRODUCTION
Adolescents’ eating behaviors have become nutritionally unhealthy [12]. With physical and mental growth, adolescence is essential for creating lifestyles and habitual routines that strongly influence adult health and life [3]. Unhealthy eating behaviors (UEB) can increase the risk of metabolic diseases, such as obesity, diabetes, and cardiovascular disease [456]. In particular, a high consumption of caffeine, fast food, carbonated beverages, and sugar-sweetened beverages is positively associated with metabolic diseases [789].
Body shape misperception (BSM) is the disagreement between the subjectively perceived body size and body mass index (BMI), which indicates the actual body size [10]. BSM is negatively associated with mental health [11]. As a critical aspect of evaluating oneself and others in social interactions, adolescents are incredibly conscious of their body image [1213]. Some public health studies have reported that correcting BSM is imperative for motivating adolescents to reduce their unhealthy eating habits [14151617].
A previous study found that an accurate perception of one’s body shape contributes to healthy eating behaviors. A direct association was observed between the weight underestimation group and the consumption pattern of pickled meat or sugar-sweetened beverages, and an inverse association was observed between weight overestimation and a healthy dietary pattern [1718]. Some studies have examined the association between BSM and eating behaviors; however, most examined eating disorders, such as fasting, loss of control over eating, and purging [1519].
Many studies have reported factors associated with adolescents’ perceived body shape, including socioeconomic status, sex, and health habits [202122]. Girls overestimate their body size because their image of an ideal female body shape tends to be thinner [2324]. However, boys often underestimate their body size, as bulky and muscular physiques are ideal male body shapes [252627].
Changes in BSM and related health behaviors during adolescence can play a critical role in future outcomes of obesity and psychosocial burden. Therefore, it is essential to ensure adolescents engage in appropriate eating behaviors. Previous studies show that accurate body shape recognition is related to appropriate eating behaviors [13141516171819]. Although studies have been conducted on weight perception and related factors among Korean adolescents [1628], only a few have determined the relationship between BSM and dietary patterns [142930]. However, these studies did not examine associations with UEB using the latest Korea Youth Risk Behavior Web-based Survey (KYRBWS). Accordingly, more research needs to be conducted to understand better the complex relationship between BSM and UEB using recently available data, indicating the need for further study of the target factors.
This study aimed to examine the association between BSM and UEB among Korean adolescents using recently available 2019 data. These findings may contribute to developing Korean adolescents’ health and health education policies.
SUBJECTS AND METHODS
Study population
This study used data from the 2019 KYRBWS, which provides statistics on youth health behaviors, to establish and evaluate youth healthcare plans in Korea [31]. The KYRBWS has been conducted annually since 2005 under the supervision of the Korea Centers for Disease Control and Prevention Agency. The KYRBWS uses a multistage cluster sampling design to obtain a nationally representative sample of Korean students from 800 schools (400 middle and 400 high schools) comprising all public and private middle- and high-school students from 17 provinces in Korea [3132]. This study did not require approval or prior consent from an Institutional Review Board, as KYRBWS is a secondary dataset available in the public domain with de-identified data.
Eating behaviors
Adolescents’ eating behaviors were classified based on the frequency of caffeinated energy drinks, fast food, carbonated beverages, and sugar-sweetened beverages in the last 7 days.
Adolescents’ eating behaviors were assessed using four questions: a) During the last week, how often did you drink caffeinated energy drinks such as HOT6, Red Bull, or Bacchus? b) How often did you eat fast food, such as breakfast or fried chicken, during the last week? c) How often did you drink carbonated beverages, other than sparkling water, in the previous week? d) How often did you drink sugar-sweetened beverages, such as sports, canned fruit, or coffee, during the last week? Each item had 5 response options per week: 1) not at all, 2) 1 or 2 times, 3) 3 or 4 times, 4) 5 or 6 times, or 5) more than 7 times.
If participants responded with “more than 3 times per week” (options: 3 to 5) to at least one of the items, they were classified into the “unhealthy eating behavior” group. If they responded with “less than 3 times per week (options:1 and 2)” to all items, they were classified into the “healthy eating behavior” group [33].
Variables
BSM
BSM is determined by the difference between BMI and body weight perception (BWP). The BSM was categorized into 3 estimation groups: the “underestimation”, “accurate estimation”, and “overestimation” groups. Participants with BWP that was lower than their actual BMI were classified in the “underestimation” group. Those who perceived their BWP as normal and had a normal range in BMI were classified in the “accurate estimation” group, and those who perceived it to be above their actual BMI were classified in the “overestimation” group (i.e., if participants whose BMI was a normal weight perceived their body weight as obese, they were placed in the “overestimation” group) [2930].
BMI values were calculated using self-reported height and weight. BMI percentiles for age and sex were calculated according to the 2017 Standard Growth Charts created by the Korean Pediatric Society for Korean children and adolescents. Four categories were created: underweight (≤ 15th percentile), normal weight (16th to 84th percentile), overweight (85th to 95th percentile), and obese (≥ 95th percentile or BMI ≥ 25) [34]. The overweight and obese groups were considered a single group when performing BWP comparisons. BWP was measured using responses to the question: “How do you describe your weight?” This question had 5 response options: very underweight, underweight, normal weight, overweight, or very overweight. Each option was regrouped into 3 categories: thin, normal, and obese.
Covariates
The covariates included demographic and socioeconomic characteristics and health-related factors. Demographic and sociodemographic characteristics included sex, age, grade, residential area, and household economic status. Residential areas were classified as “metropolitan”, “urban”, or “rural.” Household economic status was classified as “low (very low and low)”, “middle”, and “high (high and very high)”.
Health-related factors included current smoking status, alcohol consumption, subjective stress status, depressive symptoms, and weight control attempts. Current smoking status was classified into “yes (not zero)” or “no (zero)” options in response to the following question: “In the last 30 days, how many cigarettes have you smoked?” Current alcohol consumption was classified into “yes (not zero)” or “no (zero)” options in response to the following question: “In the last 30 days, how many days have you had more than one drink?” Subjective stress status was based on the answers describing a person’s daily level of stress; answers such as “high stress”, “very stressed”, and “stressed” were classified as “high”, “a little stressed” was classified as “low”, and “not stressed” was classified as “none” stress categories. Depressive symptoms were defined as feelings of sadness or despair in the past year leading to disruptions in daily life for 2 whole weeks and were classified into “yes” or “no” responses. Weight control attempts were classified into “yes” or “no” options in response to the following question: “In the last 30 days, have you ever tried to control your weight?”
Statistical analysis
A frequency analysis was conducted to identify the general characteristics of the study participants. The χ2 test was used to evaluate and compare the general characteristics of the study participants. Multiple logistic regression analysis examined the associations between BMI, BSM, and UEB. Additionally, a subgroup analysis using BSM was conducted to determine whether sex led to differences in the association between BSM and UEB. All analyses were conducted using SAS software (version 9.4; SAS Institute, Cary, NC, USA), and statistical significance was set at P < 0.05. The relevant primary sampling units, sample weights, and stratifications were considered in the analysis because the KYRBWS was designed as a complex sample.
RESULTS
Study participants and general characteristics
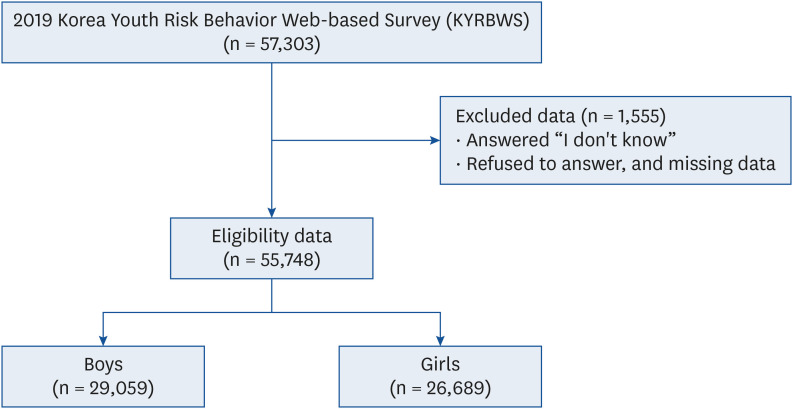
The study population comprised 57,303 participants. We excluded those who answered, “I do not know”, refused to respond to the questions, and had missing data on the questions included in this study. Finally, 55,748 participants were included in this study (Fig. 1).
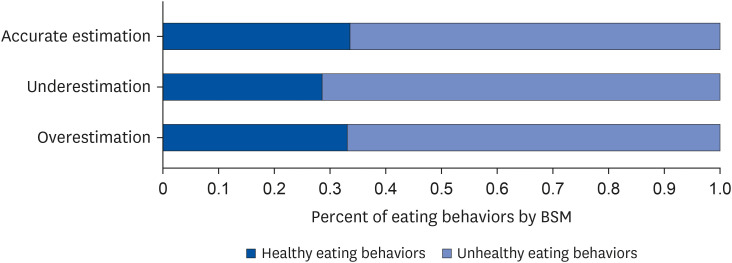
The demographic and socioeconomic characteristics of the participants are summarized in Table 1. In total, 32.5% (n = 18,141) of the healthy eating behaviors and 67.5% (n = 37,607) of UEB were analyzed. Most of the study participants (60.8%) accurately estimated their body shape. In the underestimation group, the proportion of UEB was the largest (8,248, 71.3%) to the BSM shown in Fig. 2. The gap between UEB among the BSM was the largest at 5.0%p between the underestimation and accurate estimation groups.
Table 1
General characteristics of the study population

Fig. 2
Comparison of eating behaviors by BSM among Korean adolescents.
BSM, body shape misperception.
The study results revealed that most of the study participants were boys (29,059, 52.1%), aged 14 years (9,637, 17.3%), in 9th grade (9,721, 17.4%), residing in a metropolitan area (28,598, 51.3%), and belonging to a middle socioeconomic status (26,856, 48.2%). The distribution of UEB was found among boys (20,742, 71.4%), 17-year-olds (6,475, 70.3%), and 12th-grade students (6,521, 70.3%). Regarding health habits, adolescents who smoked (2, 883, 83.0%), consumed alcohol (6,222, 77.9%), had higher stress (15,555, 70.8%) and depression (11,192, 72.3%), and did not attempt weight control (18,232, 68.9%) showed UEB. All demographic and socioeconomic characteristics were statistically associated (P < 0.001), except for household income (P = 0.084).
Multivariate logistic regression analysis for association between BSM and UEB
The association between BSM and UEB is shown in Table 2. Compared to the accurate estimation group, the underestimation group was likelier to have UEB (adjusted odds ratio [AOR], 1.18; 95% confidence interval [CI], 1.11–1.25). Boys (AOR, 1.51; 95% CI, 1.45–1.58) and age group of 17 years (AOR, 1.27; 95% CI, 1.02–1.57) are likelier to have UEB than girls and other age groups. Regarding health habits, adolescents with current smoking (AOR, 1.64; 95% CI, 1.47–1.83), consumed alcohol (AOR, 1.48; 95% CI, 1.38–1.59), high-level stress (AOR, 1.59; 95% CI, 1.43–1.77) and depression showed more likely to have UEB and statistically significant (P < 0.001). Conversely, adolescents who were overweight (AOR, 0.94; 95% CI, 0.89–0.99) and had not attempted weight control (AOR, 0.89; 95% CI, 0.85–0.92) were less likely to have UEB and statistically significant (P < 0.05).
Table 2
Factors associated with UEB

Subgroup analysis for the sex-based association between BSM and UEB
A subgroup analysis of the association between BSM and UEB according to sex is presented in Table 3. The underestimation group of boys showed a higher likelihood of UEB (AOR, 1.16; 95% CI, 1.08–1.26) than the accurate estimation group. Similarly, girls who underestimated their body shape were likelier to have UEB (AOR, 1.19; 95% CI, 1.09–1.30) than the accurate estimation group (P < 0.001).
Table 3
Subgroup analysis of the association between BSM and UEB by sex

DISCUSSION
This study aimed to identify the association between BSM and UEB among Korean adolescents. Approximately 70% of the participants exhibited UEB, regardless of their BSM group. The age group of 17 years and adolescents who experienced stress showed a higher likelihood of UEB. Girls were more likely to underestimate their body shape than boys.
Most are busy because of excessive competition for entrance exams, resulting in irregular and unhealthy dietary habits [3]. Furthermore, a new eating pattern denoted “mukbang” started trending globally in 2014 [35]. The word “mukbang” (also stylized as muk-bang or meokbang) has been described as a virtual substitute for socialization involving eating one’s own food; it has also been called a stress buster. During this Korean “eating show”, the host consumes large amounts of food, typically unhealthy dishes such as fast food or instant ramen noodles, and streams or posts their video on an online video platform [36]. The main viewers of mukbang are singles or individuals living alone, especially adolescents who spend most of their time alone at study cafés or gaming at computer centers; thus, this population is more inclined toward imitating UEB [37]. Kim et al. [38] reported that adolescents who frequently watched mukbang were likelier to engage in UEB.
This study found that the underestimation group was likelier to consume unhealthy foods than the precise estimation group. Individuals who perceived themselves as skinny might have consumed unhealthy foods because they thought their metabolism was faster and burned more calories than those who did not [39]. Similarly, adolescents who undervalue their body size might lack the motivation to adopt healthy habits [40]. This finding partly supported previous results, as the associations in previous studies differed according to the food type consumed. The underestimation group was more likely to consume fast food, and the overestimation group was less likely to drink sugar-sweetened beverages [1435]. However, this study used different standards of UEB from the present study.
We also found that health habits and psychological problems such as smoking, alcohol consumption, high stress, and depression with improper weight control increased the probability of UEB among adolescents, consistent with other relevant studies [2830344041]. Furthermore, our findings revealed that students with excessive BMI and lack of weight control were negatively associated with UEB. Studies have shown that obese children and adolescents are more likely to experience an underestimation of body shape and are linked to UEB [303940414243]. Generally, adolescents are constantly exposed to unrealistic body norms depicted by the media and are accepted as the benchmark of society's ideas of beauty. Additionally, Silva et al. [17] reported that black and brown adolescent girls had 58% more BSM than White adolescent girls, indicating that race plays a significant role in BSM. Overestimation of body weight among Korean girls must be empowered to rectify their perceptions and obtain appropriate instructions focusing on changing eating patterns while considering their growth and development.
Among girls, those who underestimated their body shape showed a stronger association with UEB than those who accurately estimated their body shape. Lim et al. [14] reported similar findings; girls who underestimate their weight usually have unhealthy eating patterns, adopt inappropriate weight-loss strategies, and do not have proper eating behaviors to maintain weight control. Adolescents spend more than an hour daily on social media [42], and girls spend more time on appearance-focused social media, such as Facebook and Instagram [43]. Due to the increase in mass media and commercial advertisements that idealize skinny body shapes for women and muscular body shapes for men, girls tend to overestimate their body shape. In contrast, boys tend to underestimate it [4445].
Thus, boys tended to engage in UEB more than girls. After stratification by sex, both sexes showed a similar association with the underestimation of body shape and UEB compared with the accurate estimation group. Specifically, future studies on adolescents who underestimate their body shape should be designed regardless of sex. Most studies have attempted to find a relationship between exaggerated body size and mental problems or disordered eating while focusing on girls. Therefore, further studies are needed to determine sex-based associations between underestimating body shape and food consumption (unhealthy eating habits), regardless of current outcomes. Moreover, adolescents need to acquire the correct knowledge regarding physical activity to minimize their chances of harm. Therefore, the government requires additional large-scale prospective studies to evaluate the dietary patterns of adolescents. Consequently, parents need to promote a healthy lifestyle.
This study had several limitations. First, the cross-sectional design precludes discussions of the causal relationships between BSM and UEB. Second, self-reported weights tended to be lower than actual weights. Finally, we did not address the frequency of consumption of fruits and vegetables, healthy fats, etc., because of the lack of data regarding the quantity of food consumed and the number of servings in the KYRBWS. Nevertheless, this study analyzed the association between BSM and UEB using nationally representative school-based data. Unlike previous studies that mainly focused on the association between overestimation and mental diseases, this study analyzed the dietary patterns related to various health problems. In addition, the present study included variables of UEB with the same standards as those of food overdoses.
In conclusion, our findings suggest that underestimating body shape may increase UEB among Korean adolescents. These findings support the notion that educating adolescents on their body shape and teaching them not to underestimate their figure aids them in forming suitable eating behaviors. Ultimately, preventing noncommunicable diseases must be integral to school nutrition education. Longitudinal studies are needed to verify whether accurate body shape perception during adolescence can help form healthy eating behaviors and lifestyles in adulthood.
 XML Download