

 PDF
PDF Citation
 Print
Print


INTRODUCTION
In 2003, the World Health Organization and International Diabetes Federation predicted that the prevalence of diabetes would reach 350 million by 2030.1 However, in 2021, the International Diabetes Federation estimated that 537 million people already had diabetes worldwide, a number 1.5-fold higher than the official prediction, and that an additional 240 million people had undiagnosed diabetes.2 The prevalence and disease burden of diabetes are expected to increase continuously.
A simulation study demonstrated that early detection of diabetes through screening improves the prognosis of patients.3 Identification of individuals at high risk of disease allows effective disease prevention through targeted interventions and delays the development of disease. Therefore, several studies have evaluated predictive models for diabetes, including some based on machine learning. Fregoso-Aparicio et al.4 systematically reviewed 90 studies of prediction models based on machine learning and deep leaning that were published between 2017 and 2021. Although several of the models demonstrated good performance, they have limited clinical applications. In 2007, the Framingham Diabetes Risk Model (FDRM), which is based on age, sex, body mass index (BMI), blood pressure, parental history of diabetes, fasting blood glucose (FBG), high-density lipoprotein cholesterol (HDL-C), and triglyceride (TG) levels, was proposed in the Framingham offspring study.5 The FDRM is based on easily available features that have good discriminative ability (area under the curve [AUC] = 0.85). It was developed for use in middle-aged adults and predicts the 8-year diabetes risk. Since 2011, the World Health Organization has recommended the use of hemoglobin A1c (HbA1c) for the diagnosis of diabetes.6 Additionally, in 2017, the American College of Cardiology/American Heart Association (ACC/AHA) changed its definition of hypertension (HTN) from blood pressure ≥ 140/90 mmHg to ≥ 130/80 mmHg.7 Meanwhile, the Korean Society of HTN announced that it would maintain the existing diagnostic criteria in accordance with the 2022 HTN management guidelines.8 These discrepancies may affect the predictive power of disease prediction models.
Therefore, we evaluated the validity of the FDRM in an independent cohort in Korea and herein propose a modified version thereof based on predictors redefined using current clinical criteria. Additionally, we assessed whether predictive performance improved when additional predictors were added to the modified FDRM.
METHODS
Data and study subjects
We obtained data from the community-based cohort of the Korean Genome and Epidemiology Study (KoGES), which was established in 2001–2002 and has a biennial follow-up. The study included 10,030 volunteers aged 40–69 years who were living in the rural area of Ansung (n = 5,018) and the industrial area of Ansan (n = 5,012) in the province of Gyeonggi-do. Detailed information on the cohort has been published elsewhere.9
We excluded participants with cancer, a history of cardiovascular disease (myocardial infarction, stroke, coronary artery disease, or congestive heart failure), diabetes, an FBG level ≥ 126 mg/dL, or HbA1c ≥ 6.5%. This study included data up to the fourth follow-up, conducted in 2009–2010. Data were randomly split into derived and validation datasets at a ratio of 7:3. Finally, data from 2,547 males and 2,862 females (derivation dataset) were used to validate and improve the FDRM, while data from 1,097 males and 1,221 females (validation dataset) were used for internal validation of the prediction models. For temporal validation, data from the fourth follow-up of the same cohort conducted in 2009–2010 were used as the baseline, whereas incident diabetes recorded in the fifth to eighth follow-ups (2017–2018) was used as the outcome. Based on the eligibility criteria, data from 1,914 males and 2,177 females (temporal validation data) were included in the study.
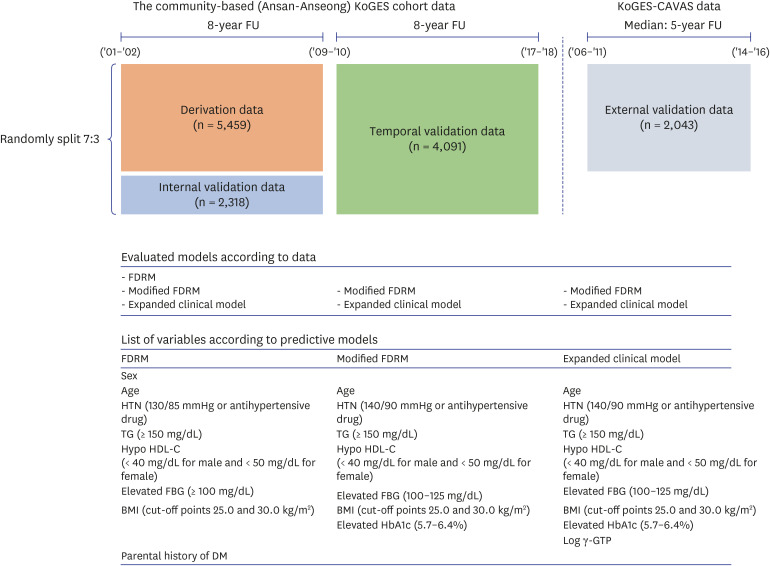
For external validation, the validity of the predictive models was assessed using data from the KoGES Cardiovascular disease association study (KoGES-CAVAS), which was selected based on the availability of data that could be explained by the developed predictive model. We evaluated the validity of the prediction model among subjects aged 40–69 years using diagnosed and undiagnosed diabetes as the outcome. Thus, after applying the eligibility criteria, we obtained data from 790 males and 1,253 females (external validation data). Briefly, KoGES-CAVAS were collected from 28,337 people living in rural areas from 2005 to 2011 for the purpose of preparing measures for disease prevention and early diagnosis through identification of risk factors related to the development of diseases, focusing on cardiovascular disease.9 Up to the 4th follow-up (2014-2016) data are available. HbA1c at baseline was measured only in some regional participants, so only 5,906 data exist. Fig. 1 presents an overview of the study procedures.
Fig. 1
Study summary.
The data sources used in this study, predictive models evaluated, and variables included therein are presented.
KoGES = Korean Genome and Epidemiology Study, KoGES-CAVAS = Korean Genome and Epidemiology Study-cardiovascular disease association study, FDRM = Framingham Diabetes Risk Model, HTN = hypertension, TG = triglyceride, HDL-C = high-density lipoprotein cholesterol, FBG = fasting blood glucose, BMI = body mass index, HbA1c = hemoglobin A1c, DM = diabetes mellitus, γ-GTP = γ-glutamyl transpeptidase.
Outcome
Incident diabetes was defined as diagnosis of diabetes by a physician and the use of medication for diabetes, or as an FBG level ≥ 126 mg/dL or HbA1c level ≥ 6.5%. The cumulative incidence of diabetes was 8.5% (255 of 2,547 males and 205 of 2,862 females) in the 8-year follow-up derivation dataset and 7.8% (85 of 1,097 males and 95 of 1,221 females) in the internal validation dataset. In the temporal validity dataset, 368 individuals (9.0%) developed diabetes during the 8-year follow-up period (172 of 1,914 males and 196 of 2,177 females). In the external validation dataset from the KoGES-CAVAS, the estimated cumulative incidence of diabetes was 6.8% (62 of 790 males and 76 of 1,253 females).
Assessment of prediction model
We assessed the validity of the FDRM and modified it as follows: first, the predicted individual diabetes risk was calculated by applying the beta coefficient derived from the FDRM to the derivation and validation datasets. Thus, according to the FDRM definition,5 eight component features were defined: age, sex, blood pressure, parental history of diabetes, BMI, and FBG, HDL-C, and TG levels:
Beta = −5.517 + (male × −0.01) + [HTN (> 130/85 mmHg or receiving therapy) × 0.498] + [high TG (≥ 150 mg/dL) × 0.575] + [hypo HDL-C (< 40 mg/dL for males and < 50 mg/dL for females) × 0.944] + [high FBG (≥ 100 mg/dL) × 1.98] + (parental history of diabetes × 0.565)
if BMI 25.0–29.9 kg/m2, + 0.301; if BMI ≥ 30.0 kg/m2, + 0.92 and if age 50-64 years, −0.018; if age ≥ 65 years, −0.081
Second, we modified the FDRM by adding the revised definition of HTN (blood pressure ≥ 140/90 mmHg or use of antihypertensive drugs8) and HbA1c (5.7–6.4%),610 as well as by excluding sex and parental diabetes history (named modified FDRM).511 Third, additional clinical features were applied to the modified FDRM to improve its performance (named expanded clinical model). We assessed diabetes-related features identified in previous studies1012131415 that are recorded routinely and were available in the KoGES dataset. We assessed the associations of incident diabetes with 35 features (Supplementary Table 1). Regarding redundant features, we excluded highly correlated features (correlation coefficient [γ] > 0.8). The stepwise selection method was used to identify the most important features in the modified FDRM. To evaluate collinearity among the features included in the predictive model, we estimated the variance inflation factor. We also evaluated the interaction terms for the features included in the predictive model. The internal and external validity of the modified FDRM and expanded clinical model were evaluated.
Statistical analysis
Statistical analysis was performed using R (version 3.6.2; R Foundation for Statistical Computing, Vienna, Austria) and SAS (version 9.4; SAS Institute Inc., Cary, NC, USA) software. Demographic characteristics are presented as means with standard deviations or medians with interquartile ranges for continuous variables, as appropriate, and as numbers with percentages for categorical variables. Associations of incident diabetes with the features are presented as odds ratios, 95% confidence intervals (CIs), c-index (i.e., AUC) values, and scores derived from the logistic model. We calculated the AUC to compare the predictive models in terms of discrimination ability. Within-study validity was assessed using 10-fold cross validation. Sensitivity analysis was performed as follows. In the validation data, HTN was defined according to the ACC/AHA standards7 (blood pressure ≥ 130/80 mmHg or use of antihypertensive drugs) and the difference in discrimination power was evaluated when applied to the prediction models. We also evaluated model performance for diabetes, defined as physician diagnosis and diabetes medication use, FBG level ≥ 126 mg/dL or HbA1c level ≥ 6.5% or 2-hour blood glucose level ≥ 200 mg/dL in oral glucose tolerance test. Due to data availability, it was evaluated on internal and temporal validation data. We also evaluated model performance in subgroups (male/female, normoglycemia/prediabetes). A two-tailed P value < 0.05 was considered to indicate statistical significance.
Ethics statement
This study was performed in accordance with the Declaration of Helsinki. The study protocol was approved by the Institutional Review Board (IRB) of Ewha Womans University Hospital (approval no. EUMC 2021-03-008). The requirement for written informed consent was waived by the IRB because the study used an anonymous dataset.
RESULTS
Table 1 presents the baseline characteristics of the participants. In the derivation dataset, 47.1% of the participants were males; their mean age was 51.5 (range, 40–69) years, 40.4% had a BMI > 25.0 kg/m2 and 7.8% had a parental history of diabetes. Approximately a quarter of the participants had a blood pressure ≥ 140/90 mmHg (24.4%) and half of the participants had a low HDL-C level (52.6%). The mean FBG and HbA1c levels were 83.1 mg/dL and 5.6%, respectively. There were no significant differences between the derivation and validation datasets in terms of the baseline characteristics.
Table 1
Basic characteristics of the participants in the derivation and validation datasets
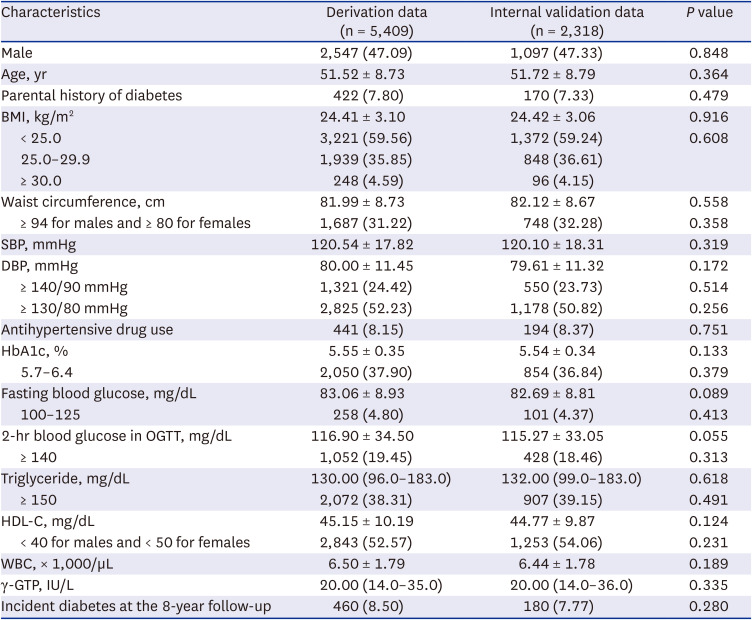
Values are presented as mean ± standard deviation or median (interquartile range) or number (%).
BMI = body mass index, SBP = systolic blood pressure, DBP = diastolic blood pressure, HbA1c = hemoglobin A1c, OGTT = oral glucose tolerance test, HDL-C = high-density lipoprotein cholesterol, WBC = white blood cell, γ-GTP = γ-glutamyl transpeptidase.
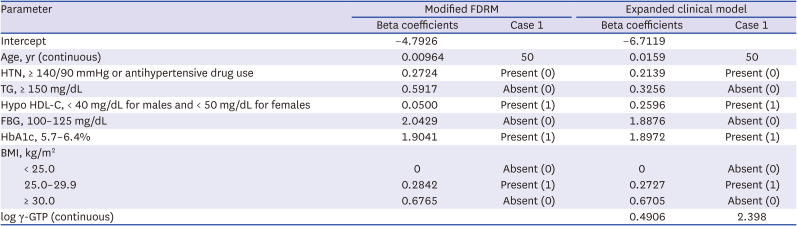
The modified FDRM included age (continuous variable; years), BMI (categorical variable; < 25.0, 25.0–29.9, or ≥ 30.0 kg/m2), HTN (≥ 140/90 mmHg or use of antihypertensive drugs), low HDL-C level (< 40 mg/dL for males and < 50 mg/dL for females), and elevated TG (≥ 150 mg/dL), FBG (100–125 mg/dL), and HbA1c (5.7–6.4%) levels. The stepwise selection method was used to develop an expanded clinical model including the white blood cell (WBC) count (continuous variable; × 1,000/µL) and log-transformed γ-glutamyl transpeptidase (γ-GTP) level (continuous variable; unit of raw value IU/L) to the modified FDRM. However, because the difference between the model adding WBC and γ-GTP (AUC = 0.831) and the model adding only γ-GTP (AUC = 0.830) was minimal (P = 0.474), only γ-GTP was included in the expanded clinical model. Table 2 presents the beta coefficients of the models. The modified FDRM and expanded clinical models can be used to calculate the diabetes risk as follows:
Table 2
Estimates and ORs for predictive models of incident diabetes based on the derivation dataset
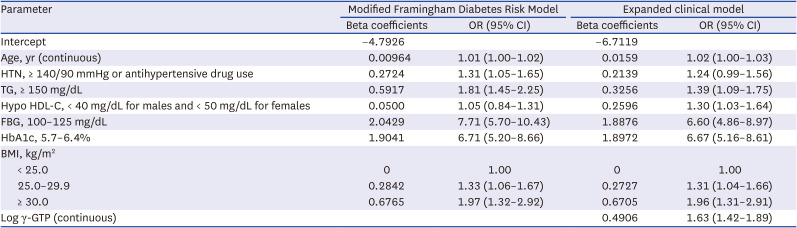
Modified FDRM:
Expanded clinical model:
Probability = 1/[1 + exp(−beta)]
Examples of the diabetes risk calculation are presented in the Appendix 1.
The relative importance of the features varied between the improved models (Fig. 2). HbA1c of 5.7–6.4% was the most important feature in both models, followed by an FBG level of 100–125 mg/dL. In the expanded clinical model, log-transformed γ-GTP ranked third in terms of importance and HTN was the least important variable. In the modified FDRM, a TG level ≥ 150 mg/dL ranked third and a low HDL-C level was the least important variable.
Fig. 2
Relative importance of features included in the improved predictive models for diabetes. (A) Modified Framingham Diabetes Risk Model and (B) expanded clinical model.
HTN was defied as blood pressure ≥ 140/90 mmHg or the use of antihypertensive drugs. Due to the skewed distribution, γ-GTP values were log-transformed. Hypo HDL-C was defined as HDL-C < 40 mg/dL for males and < 50 mg/dL for females. Age, log-transformed γ-GTP, and WBC were included as numerical variables; all of the other variables were binary.
HbA1c = hemoglobin A1c, FBG = fasting blood glucose, TG = triglyceride, BMI = body mass index, HTN = hypertension, HDL-C = high-density lipoprotein cholesterol, WBC = white blood cell, γ-GTP = γ-glutamyl transpeptidase.
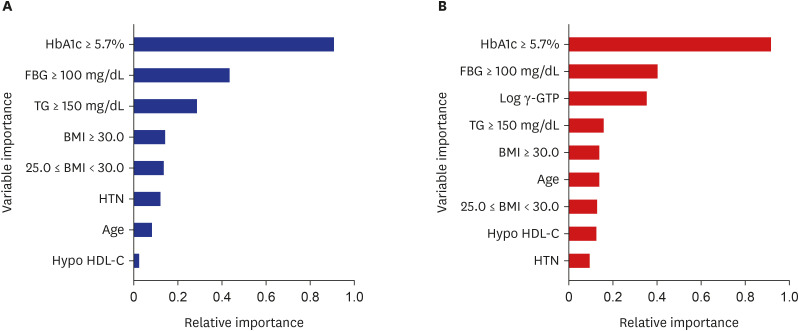
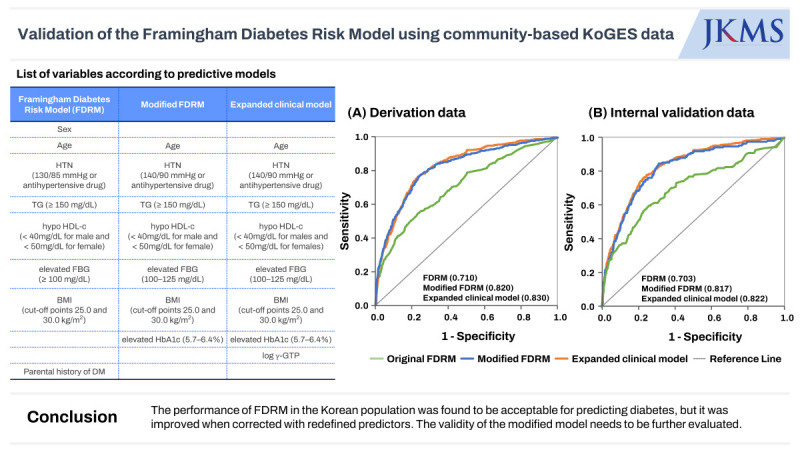
Fig. 3 compares the AUC values for the derivation and validation datasets among the predictive models. In the derivation dataset, the FDRM had the lowest AUC value (0.710, 95% CI, 0.684–0.736) and the expanded clinical model had the highest (0.830, 95% CI, 0.811–0.849); that of the modified FDRM was 0.820 (95% CI, 0.799–0.841). Both modified models had significantly higher AUC values than the FDRM (all P < 0.001), and the expanded clinical model had higher AUC values than the modified FDRM (P = 0.004). The accuracy of the expanded clinical model was 92.02% (95% CI, 91.27–92.73) and that of the modified FDRM was 91.93% (95% CI, 91.17–92.65). The accuracy of the FDRM was not calculated due to its low predictive value. When 10-fold cross-validation was applied, the AUCs of the modified FDRM and expanded clinical model were 0.813 and 0.825, respectively. The variance inflation factor of both models was < 1.5. We evaluated the interaction terms between the features of the predictive model. Although TG (≥ 150 mg/dL) and HbA1c (5.7–6.4%) showed a significant interaction, the interaction did not improve model performance (0.820 and 0.831 for the modified FDRM and expanded clinical model, respectively). Therefore, these features were not included in the model.
Fig. 3
Validation of the FDRM for predicting diabetes and comparison with the modified FDRM and expanded clinical model. (A) Derivation data, (B) internal validation data, (C) temporal validation data, and (D) external validation data.
FDRM = Framingham Diabetes Risk Model.
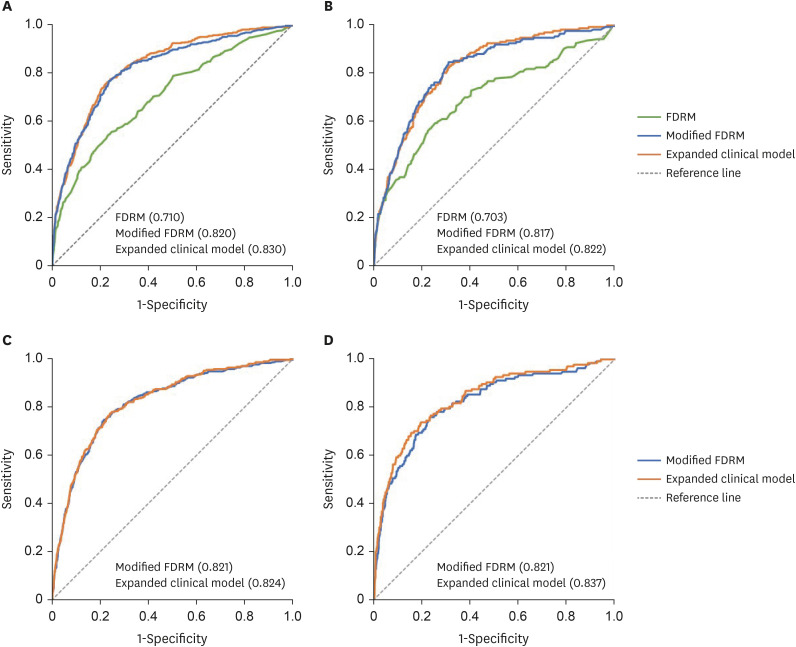
In the internal validation dataset, the discrimination abilities of the expanded clinical model and the modified FDRM were acceptable (0.822, 95% CI, 0.792–0.852 and 0.817, 95% CI, 0.785–0.850, respectively), and there was no significant difference between the models (P = 0.602). The accuracies of the expanded clinical model and the modified FDRM were similar to that in the derivation dataset (92.34%, 95% CI, 91.18–93.39 and 92.51%, 95% CI, 91.36–93.55, respectively; Fig. 3). In the temporal validation dataset, the γ-GTP data were not collected at the fourth follow-up, so data from the third follow-up were used. The AUC values were 0.824 (95% CI, 0.800–0.848) and 0.821 (95% CI, 0.796–0.846) for the expanded clinical model and the modified FDRM (comparison between two models, P = 0.345), respectively. The accuracies of both the expanded clinical model and the modified FDRM were greater than 88% (88.41%, 95% CI, 87.28–89.47 and 88.32%, 95% CI, 87.29–89.28, respectively). In the external validation dataset, the AUCs of the expanded clinical model and the modified FDRM were 0.837 (95% CI, 0.800–0.875) and 0.821 (95% CI, 0.781–0.860), respectively. The accuracies of the expanded clinical model and modified FDRM were 92.51% (95% CI, 91.29–93.62) and 92.17% (95% CI, 90.92–93.30), respectively (Fig. 3). Temporal and external-validated data for participant characteristics are presented in Supplementary Table 2. They had higher average age, FBG, and lower TG than the participants in the derivation data and internal validation data.
Even when HTN according to the ACC/AHA standards was applied to the two modified models, the model performance was slightly lower, but generally showed a similar level (Supplementary Table 3). The cumulative incidence of incident diabetes, defined by adding a 2-hour blood glucose level ≥ 200 mg/dL in the oral glucose tolerance test, was 13.53% (308/2,276) in internal validation data and 13.02% (490/3,764) in temporal validation, respectively. Overall, both modified models showed predictive power levels above 0.7, which were acceptable (Supplementary Table 4). The model performance of both modified models for men and women was above 0.8, with internal and temporal validation data being higher for women and external validation data being higher for men. However, the 95% CI were found to overlap. Although the overall model performance of both modified models was reduced in subjects with normoglycemia or prediabetes, model performance in prediabetic subjects was higher than that in normoglycemic subjects (Supplementary Table 5).
DISCUSSION
The FDRM showed acceptable predictive performance for incident diabetes in non-diabetic Korean individuals (AUC, 0.71); the predictive performance was improved by modifying the included factors (AUC, 0.82 for the modified FDRM). Although the addition of clinical features to the modified FDRM provided further improvement (AUC, 0.83), it was not maintained in the validation data. Furthermore, although the characteristics of the population-based cohort (e.g., KoGES-CAVAS) and the temporal validation dataset were different from those of the derived data, the modified FDRM showed good performance in each dataset (AUC, 0.82 and 0.82, respectively). This model performed equally well in both men and women. Even when diabetes prediction probability was calculated by defining HTN according to ACC/AHA, the overall model performance did not change significantly.
The FDRM has been validated for use in Taiwanese,16 German,17 Swedish,18 American,19 and Canadian populations,11 with only some studies reporting acceptable performance. The different results among previous studies may have been due to the heterogeneity in the distribution of predictors and disease.1119 Indeed, in the present study, the participants were thinner (24.4 vs. 27.1 kg/m2) and had higher proportions of low HDL-C level (52.6% vs. 36.9%) and incident diabetes (8.5% vs. 5.1%) than in the Framingham offspring study.5 Previous studies, including the Framingham offspring study, diagnosed diabetes on the basis of the FBG level, 2-hour postprandial blood glucose level, or use of antidiabetic drugs.51820 The American Diabetes Association recommends HbA1c as a substitute for FBG for the diagnosis of diabetes, and as a reliable prognostic marker for diabetes.621 HbA1c reflects the mean plasma glucose level over the previous 8–12 weeks.22 In the present study, HbA1c had the highest importance among the features included in the prediction model. Changes in diagnostic criteria may affect the performance of the predictive model. Previous studies of the predictive ability of clinical models based on 2-hour glucose and FBG levels have shown conflicting results.2324 The diagnosis guidelines for diabetes recommend a 2-hour glucose-tolerance test, but it is not mandatory for screening. Studies that developed diabetes prediction models using health checkup data generally did not consider 2-hour glucose when defining diabetes.2526 However, in line with previous studies,2728 we observed differences in prevalence depending on the definition of diabetes. Also, one meta-study suggested lowering the cutoff values for FBG and HbA1c in relation to diabetes diagnosis.28 Therefore, prior to developing a diabetes prediction model, it seems necessary to resolve this discrepancy.
Various prediction models for diabetes have been developed over the last 20 years.4 Age, family history of diabetes, HTN, BMI or obesity, waist circumference, and sex have frequently been included in prediction models of diabetes.10 To reduce the cost and the time required to predict diabetes risk, Lindstrom and Tuomilehto20 proposed the Finnish Diabetes Risk Score based on lifestyle features, rather than laboratory tests, to identify high-risk individuals; the score had an AUC of 0.85 for the prediction of diabetes. Stern et al.23 developed a predictive model based on the components of metabolic syndrome for Mexican-American and non-Hispanic whites. The model which consisted of metabolic features, had higher discriminative ability than the 2-hour oral glucose tolerance test alone for high-risk individuals.23 In the present study, the discrimination abilities of 2-hour glucose, HbA1c (5.7–6.4%), and FBG levels (100–125 mg/dL) were 0.78, 0.74, and 0.61, respectively (Supplementary Table 1). Our findings also showed that the modified FDRM had a higher 8-year prediction ability for diabetes than univariate models based on 2-hour glucose, HbA1c, and FBG levels. Several studies have found that metabolic features are reasonable and useful for the prediction of diabetes. However, as with the Framingham offspring study,5 making models more complex by adding clinical features did not improve their performance. We selected γ-GTP and WBC as potential risk factors of diabetes. Previous studies have identified an association between chronic subclinical inflammation and insulin resistance. In addition, several studies found an association between an elevated WBC count and diabetes.2930 In a study of Taiwanese individuals, a predictive model based on age, BMI, WBC count, TG, HDL-C, and FPG levels was developed and had an AUC of 0.70.16 However, it did not appear to primarily contribute to the performance of the diabetes prediction model, so it was not included in the expanded clinical model. Liver-related biomarkers are associated with diabetes, and γ-GTP is an early and sensitive marker of inflammation and oxidative stress.31 In addition, it has been suggested that γ-GTP is an independent predictor of diabetes, HTN, metabolic syndrome, and coronary artery disease.32 A study by Lee et al.33 from the same data source as this study also found that higher γ-GTP was associated with the development of diabetes. Another Korean study using health examination data also found that γ-GTP contributed to the prediction of diabetes.25 The role of oxidative stress in the development of diabetes-related complications is unclear; some studies found associations with peripheral neuropathy and retinopathy.3435 Although the Framingham offspring study developed a simple predictive model, the use of a parental history of diabetes is challenging. Parental history of diabetes is asked in routine clinical settings, but its availability in research appears to be limited. A Canadian study that analyzed electronic medical records as primary care data evaluated the FDRM after excluding a parental history of diabetes (due to a lack of data),11 whereas another study used family history instead of a parental history of diabetes.19 In external validation data, data on parental history of diabetes was missing in 26.2% of subjects. In addition, in our study, no significant contribution of parental history of diabetes was observed in predicting diabetes. Also, like previous studies,525 the contribution of sex to diabetes prediction was not found to be significant. Instead, the modified FDRM showed a predictive power of over 0.8 for both sexes.
Certain factors should be considered when interpreting our results. First, we evaluated the validity of the modified FDRM in various data settings. Further studies are needed to determine the validity of the model in other populations. Second, misclassification bias may have occurred due to measurement error.
Our results have significant implications because we evaluated the usefulness of the FDRM and proposed a modified FDRM in consideration of utilization in the clinical setting. In addition, the validity of the modified model was assessed using various datasets in terms of temporal validation and external validation. In total, 37.9% and 36.8% of the population had prediabetes (HbA1c of 5.7–6.4%) in the derivation and validation datasets, respectively; this variable made the largest contribution to the prediction of incident diabetes (Fig. 2). Therefore, for individuals with prediabetes, interventions to prevent or delay the onset of diabetes are required. In primary care, high-risk individuals should be targeted for counseling and interventions to prevent diabetes.
Taken together, our results show that the predictive performance of the FDRM was acceptable in a Korean general population, although lower than that in the Framingham offspring study. The discrimination ability of the FDRM was improved when the redefined features based on recent clinical criteria were added. However, adding clinical features to the modified FDRM did not improve model performance. Identification of high-risk individuals and early intervention may reduce the diabetes burden. Further studies are needed to confirm the validity of the diabetes-prediction models in various populations.
 XML Download