

 PDF
PDF Citation
 Print
Print


INTRODUCTION
Chronic obstructive pulmonary disease (COPD) is a very common condition with a prevalence of 12% worldwide and 11% in the Republic of Korea.1 According to the World Health Organization, COPD is responsible for 3.23 million deaths annually, accounting for approximately 5% of all deaths worldwide.12 Cigarette smoking is one of the most important risk factors for the development of COPD. Recent studies have shown that up to 50% of smokers experience a substantial decline in lung function and consequently would be diagnosed with COPD during their lifetime.34
Because a person’s diet comprises various foods containing nutrients that interact with each other, the overall effects of diet are more complex than the simple additive effects of the individual foods and nutrients. Therefore, dietary patterns, which are combinations of foods commonly consumed together, need to be considered to assess overall nutritional quality. However, although specific dietary nutrients, such as vitamins C and E, have been reported to be associated with the risk of COPD,5 studies investigating the association between dietary patterns67 and COPD-related outcomes are limited. For example, in a cross-sectional study using the data of a prospective cohort, a prudent dietary pattern (characterized by high consumption of vegetables, fruits, water, tea, coffee, fish, and nuts) was associated with forced expiratory volume in 1 second (FEV1), but not with FEV1/forced vital capacity (FVC) ratio, forced expiratory flow at 25–75% of FVC (FEF2575), and COPD.6 Our previous cross-sectional study also showed that higher ‘coffee, fat, and sweet’ dietary pattern was associated with lower lung function, particularly for FEV1/FVC ratio.7
Meanwhile, interestingly, it was reported that coffee consumption was associated with FEV1 and FVC only among never and former smokers but not current smokers.8 Furthermore, in another study, the association between coffee and green tea consumption and COPD prevalence was observed before adjustment for smoking status but disappeared after the adjustment.9 Given that cigarette smoking is an established risk factor for COPD and potentially modifies or confounds the associations between dietary patterns and COPD, it is important to consider the impact of smoking on the associations. Therefore, this study aimed to investigate the interactions between dietary patterns and smoking status and their associations with COPD-related outcomes. We explored the associations between dietary patterns and COPD-related outcomes in different strata of smoking status and evaluated the interactions between dietary patterns and smoking status using the data of a community-based cohort followed for 20 years.
METHODS
Study participants
The Korean Genome and Epidemiology Study (KoGES) was a prospective cohort study that aimed to elucidate the association between modifiable and genetic risk factors and major chronic diseases in the Korean population. Detailed information on the KoGES has been reported previously.10 In the present study, we used data from the Anseong-Ansan cohort (of the KoGES study), which included 10,030 adults aged ≥ 40 years residing in the Anseong and Ansan areas from 2001 to 2002. Surveys were conducted biannually; the 10th survey was conducted from 2019 to 2020, while the 11th survey is currently in progress. During each survey, trained interviewers obtained information on sociodemographic factors, lifestyles, diet, and disease history using structured questionnaires. In addition, trained technicians conducted anthropometric measurements and collected urine and blood samples.
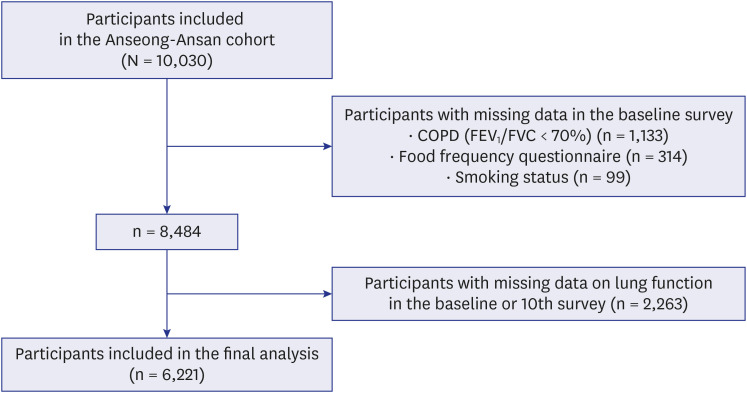
Of 10,030 study participants, we excluded those with COPD (n = 1,133) and those with missing data on the food frequency questionnaire (FFQ) (n = 314) and smoking status (n = 99) in the baseline survey. Participants with missing data on lung function (n = 2,263) in the baseline or 10th survey were also excluded. Thus, 6,221 participants were included in the final analysis (Fig. 1).
Assessment of dietary factors
Information on the dietary intake of the participants was obtained using the semi-quantified FFQ in the baseline survey. For validation, the FFQ was administered twice at a 1-year interval between December 2002 and May 2004, and dietary records were collected for three days during each of the four seasons. The nutrient intakes and densities were compared among the two FFQs and dietary records. The median Spearman correlation coefficient was 0.45 for all nutrient intakes and 0.39 for nutrient densities.711
For each of the 103 food items, study participants reported usual frequencies of consumption (nine categories ranging from “almost never” to “three times/day”) and typical portion sizes (“less than one serving size,” “one serving size,” or “more than one serving size”).711 The daily intake of each food item was converted to grams/day by multiplying the frequency/day by the portion size score. The intakes of 17 nutrients, including macronutrients, vitamins, and minerals, were calculated by multiplying the gram/day of food consumed with its nutrient content.12
For dietary pattern analysis, the 103 food items were categorized into 28 common food groups based on previous studies.71314151617 Factors were extracted by performing principal component analyses using these food groups with orthogonal transformation (a varimax method). We identified five dietary patterns with an eigenvalue > 1.4 and conducted further analyses with these dietary patterns. We interpreted the dietary patterns based on the identified food groups with absolute values of rotated factor loadings ≥ 0.30.718
Assessment of smoking status
Smoking status was assessed according to responses to three questions regarding cigarette smoking in the baseline survey: smoking experience (never, previous, and current), smoking duration in years, and the number of cigarettes smoked per day. We calculated pack-years by multiplying the smoking duration by the number of cigarettes and defined smoking status as never, light (< 20 pack-years), and heavy smokers (≥ 20 pack-years).1920
Assessment of outcomes
The outcomes of interest in this study were COPD and pre-bronchodilator FEV1/FVC ratio. Trained pulmonary technicians measured lung functions using spirometry in the baseline and 10th surveys in accordance with the American Thoracic Society/European Respiratory Society Task Force standardized protocols.721 After measuring the FEV1 and FVC, the FEV1/FVC ratio were calculated. We defined COPD as FEV1/FVC ratio < 0.7, according to the 2018 Global Initiative for Chronic Obstructive Lung Disease guidelines.22 In addition, COPD was defined alternatively as 1) a FEV1/FVC ratio < 0.7 and FEV1 < 80% of predicted value and 2) a FEV1/FVC ratio < 0.7 and the presence of respiratory symptoms (dyspnea, chronic cough, or chronic sputum). Study participants who answered positively to the questions, “Do you feel shortness of breath when walking on plain ground?,’ ‘Do you have cough lasting three months or longer in recent months?,’ and ‘Do you have sputum production accompanied by cough for at least three months a year?,’ were identified to have dyspnea, chronic cough, and chronic sputum, respectively.23
Statistical analysis
We categorized the dietary pattern scores into quartiles and used the lowest quartile (Q1) as the reference. For each stratum of smoking status (never, light, and heavy smokers), we analyzed the associations between dietary patterns and (a) COPD using Cox proportional hazard models and (b) FEV1/FVC ratio using linear mixed models. We evaluated the interactions between dietary patterns and smoking status by testing the product terms added to the Cox regression and linear mixed models with lower-order terms. For linear mixed models, participant identification numbers were used as random effects to control the correlation between multiple observations from the same participants.
Of the identified dietary patterns, the “coffee” pattern was characterized by a high intake of coffee, sugar, and cream. Therefore, we further analyzed the associations between the consumption levels of black coffee, combined coffee, and instant coffee and COPD, stratified by smoking status. Black coffee was defined as coffee made with the addition of coffee powder or extracts to water without other ingredients. Combined coffee was defined as coffee made with the addition of coffee powder with sugar or cream, while instant coffee was defined as coffee made with the addition of coffee powder with sugar and cream. Coffee consumption levels were assessed as “0 serving/day,” “1 serving/day,” or “> 1 servings/day.”2425
The following covariates were selected a priori based on assumed causal pathways: age, sex, education level, monthly household income, body mass index (BMI), physical activity, FEV1, and comorbidity in the baseline survey. The education level was categorized as elementary school, middle school, high school, and college or higher. Monthly household income was categorized as < 2 million Korean Won (< US$1,551) and ≥ 2 million Korean Won (≥ $1,551). BMI was calculated as the weight (kg) divided by the square of the height (m) and was categorized as underweight (< 18.5 kg/m2), normal (18.5–24.9 kg/m2), and overweight (≥ 25 kg/m2). Physical activity was calculated as the metabolic equivalent of task (MET) minutes per week. The participants reported the number of minutes they spent on sleep and five types of activities based on intensity: sedentary, very light, light, moderate, and heavy. The MET minutes per week were calculated by multiplying the number of minutes the participants spent on each type of activity per week and the MET values for each activity.2627 As a comorbidity status, asthma, tuberculosis, and other chronic respiratory diseases were considered.5
We conducted all analyses using SAS software version 9.4 (SAS Institute Inc., Cary, NC, USA).
Ethics statement
All study participants provided written informed consent before enrollment in the survey. This study, which used anonymized KoGES data, was approved by the Institutional Review Board of Hanyang University (IRB No. HYU-2023-126) and was performed according to the tenets of the Declaration of Helsinki. The informed consent was waived by the board.
RESULTS
Baseline characteristics of study participants
Table 1 presents the baseline characteristics of the study participants with (n = 5,179) and without (n = 1,042) incident COPD during the follow-up. Participants with incident COPD during the follow-up were more likely to be heavy or light smokers, men, older, and had lower education levels, monthly household income, diagnosed with tuberculosis, and chronic respiratory disease than those without incident COPD. In addition, participants with incident COPD were less likely to BMI and FEV1/FVC ratio than those without incident COPD.
Table 1
Baseline characteristics of study participants
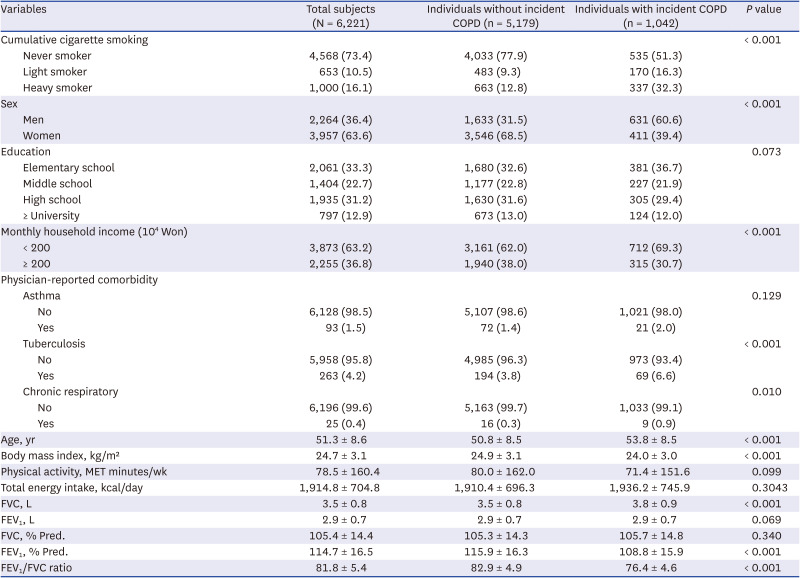
Values are presented as number (%) or mean ± standard deviation.
COPD = chronic obstructive pulmonary disease, MET = metabolic equivalent of task, FVC = forced vital capacity, FEV1 = forced expiratory volume in one second, % Pred = % of predicted value.
The smoker was definition of the three categories, which included ‘Never smoker,’ ‘Light smoker (< 20 pack-years),’ and ‘Heavy smoker (≥ 20 pack-years).’
Data are presented as mean (standard deviation) or the number of sample size and its percentage (%).
T-test for continuous variables and chi-squared test for categorical variables were used.
The analysis of baseline characteristics by smoking status showed that heavy smokers were more likely to be men, younger, and had higher education levels, lower monthly household income than light and never smokers. In addition, heavy smokers were less likely to be BMI, physical activity, and FEV1/FVC ratio. Never smokers were more likely to have had lower total energy intake than light and heavy smokers (Supplementary Table 1).
Correlations between dietary patterns and food groups
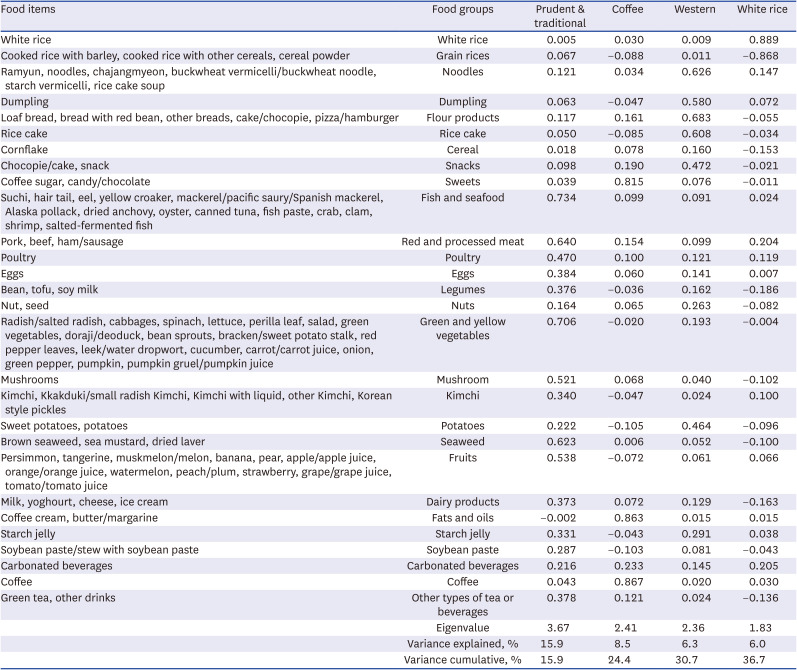
We identified five dietary patterns (“prudent & traditional,” “coffee,” “Western,” and “white rice”), accounting for 36.7% of the total variance of food intake (15.9%, 8.5%, 6.3%, and 6.0%, respectively). The “prudent & traditional” pattern was characterized by a high intake of fish and seafood, green and yellow vegetables, red and processed meat, seaweed, fruits, mushroom, poultry, eggs, tea or beverages, legumes, dairy products, kimchi, and starch jelly. The “Western” pattern was characterized by a high intake of flour products, noodles, rice cakes, snacks, dumplings, snacks and potatoes. Finally, the “white rice” pattern was characterized by a high intake of white rice and a low intake of grain rice (Table 2).
Table 2
Correlations between dietary patterns and food groups
Associations of dietary patterns with COPD
The hazard ratio (HR) of fourth (Q4, highest) quartiles of the dietary patterns for COPD was compared with the lowest quartiles. In analyses only adjusted for age, the Q4 of the “coffee” and “white rice” pattern were associated with a higher risk of COPD with the lowest quartile as a reference (HR, 1.47; 95% confidence interval [CI], 1.24–1.74 for Q4; HR, 1.45; 95% CI, 1.21–1.72 for Q4). However, these associations were attenuated when we adjusted the analyses for other covariates (Supplementary Table 2).
We also evaluated the associations between dietary patterns and COPD, defined alternatively. In analyses adjusted for age, the Q4 of the “coffee” pattern were associated with a higher risk of COPD defined as FEV1/FVC ratio < 0.7 and FEV1 < 80% of predicted value (HR, 2.19; 95% CI, 1.40–3.43). In addition, the Q4 of the “coffee” (HR, 1.32; 95% CI, 1.07–1.64) and “white rice” pattern (HR, 1.63; 95% CI, 1.29–2.05) were associated with a higher risk of COPD, defined as FEV1/FVC ratio < 0.7 and the presence of respiratory symptoms. However, similarly, these associations were attenuated when we further adjusted the analyses for other covariates (Supplementary Table 3).
Associations of dietary patterns with COPD and FEV1/FVC ratio stratified by smoking status
Among heavy smokers, the Q4 of the “coffee” pattern were associated with a higher risk of COPD with the lowest quartile as a reference (HR, 1.46; 95% CI, 1.03–2.08 for Q4). However, this association was not observed in light and never smokers (P value for interaction = 0.035). We did not identify any associations between other dietary patterns and COPD (Table 3).
Table 3
Associations between dietary patterns and chronic obstructive pulmonary disease stratified by smoking status
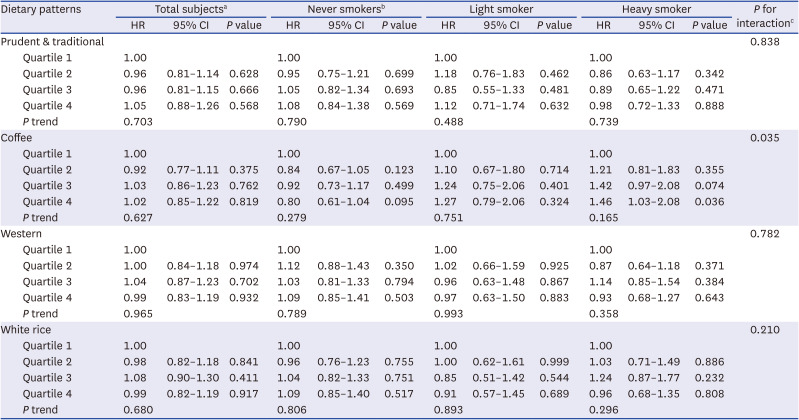
HR = hazard ratio, CI = confidence interval.
aAdjusted for age, sex, education level, monthly income level, body mass index, physical activity, smoking status, forced expiratory volume in 1 second, and comorbidity at baseline.
bAdjusted for age, sex, education level, monthly income level, body mass index, physical activity, forced expiratory volume in 1 second, and comorbidity at baseline.
cP values for interaction were estimated by testing product terms added to the main Cox regression models.
The Q3 and Q4 of the “coffee” pattern were also associated with lower FEV1/FVC ratio with the lowest quartile as a reference for heavy smokers (β = −1.2%; 95% CI, −1.8% to −0.5% for Q3; and β = −1.2%; 95% CI, −1.9% to −0.6% for Q4). The Q4 of the “Western” pattern were associated with lower FEV1/FVC ratio the lowest quartile as a reference for heavy smokers (β = −0.9%; 95% CI, −1.4% to −0.3% for Q4). The Q3 of the “prudent & traditional” pattern were associated with higher FEV1/FVC ratio for light smokers (β = 1.1%; 95% CI, 0.5%–1.7% for Q3). We did not identify any associations between other dietary patterns and FEV1/FVC ratio (Table 4).
Table 4
Associations between dietary patterns and lung function stratified by smoking status
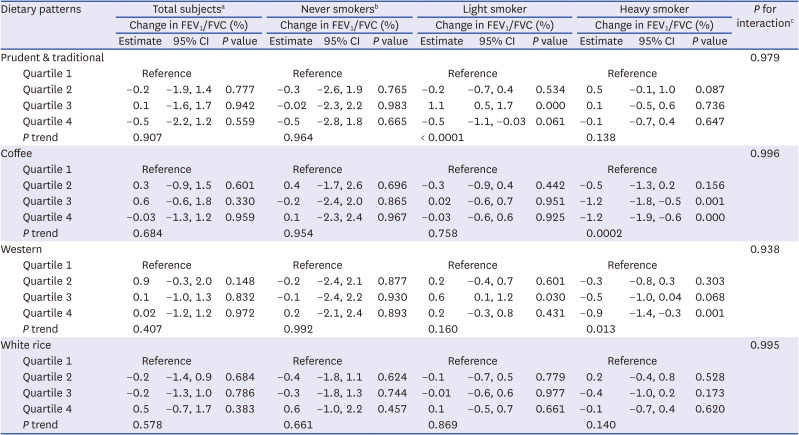
FEV1/FVC = forced expiratory volume in 1 second/forced vital capacity, CI = confidence interval.
aAdjusted for age, sex, education level, monthly income level, body mass index, physical activity, smoking status, forced expiratory volume in 1 second, and comorbidity at baseline.
bAdjusted for age, sex, education level, monthly income level, body mass index, physical activity, forced expiratory volume in 1 second, and comorbidity at baseline.
cP values for interaction were estimated by testing product terms added to the main linear mixed models.
Associations of the consumption of black coffee, combined coffee, and instant coffee with COPD
Instant coffee consumption was associated with a higher risk of COPD with the lowest quartile as a reference for heavy smokers (HR, 1.43; 95% CI, 1.11–1.83 for > 1 serving per day of instant coffee), but not for never and light smokers (P value for interaction = 0.004). No associations were observed between the consumption levels of black or combined coffee and COPD (Table 5).
Table 5
Associations between the coffee groups and chronic obstructive pulmonary disease stratified by smoking status
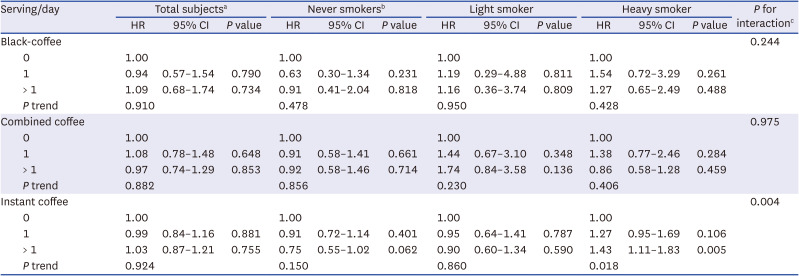
HR = hazard ratio, CI = confidence interval.
aAdjusted for age, sex, education level, monthly income level, body mass index, physical activity, smoking status, forced expiratory volume in 1 second, and comorbidity at baseline.
bAdjusted for age, sex, education level, monthly income level, body mass index, physical activity, forced expiratory volume in 1 second, and comorbidity at baseline.
cP values for interaction were estimated by testing product terms added to the main Cox regression models.
Associations of dietary patterns with COPD defined alternatively stratified by smoking status
In analyses with COPD defined as FEV1/FVC ratio < 0.7 and FEV1 < 80% of predicted value, the Q3 of the “coffee” pattern was associated with a higher risk of COPD among light smokers (HR, 7.15; 95% CI, 1.47–34.84). In addition, the Q3 of the “Western” pattern was associated with a higher risk of COPD among heavy smokers (HR, 1.96; 95% CI, 1.01–3.82) (Supplementary Table 4).
In analyses with COPD defined as FEV1/FVC ratio < 0.7 and the presence of respiratory symptoms, the Q4 of the “White rice” pattern was associated with a higher risk of COPD among total participants (HR, 1.34; 95% CI, 1.06–1.71) and never smokers (HR, 1.59; 95% CI, 1.20–2.12). In addition, the Q3 of the “Western” pattern (HR, 1.96; 95% CI, 1.23–3.11) and Q4 of the “Prudent &Traditional” pattern (HR, 1.78; 95% CI, 1.11–2.84) were associated with COPD risk among heavy smokers (Supplementary Table 5).
DISCUSSION
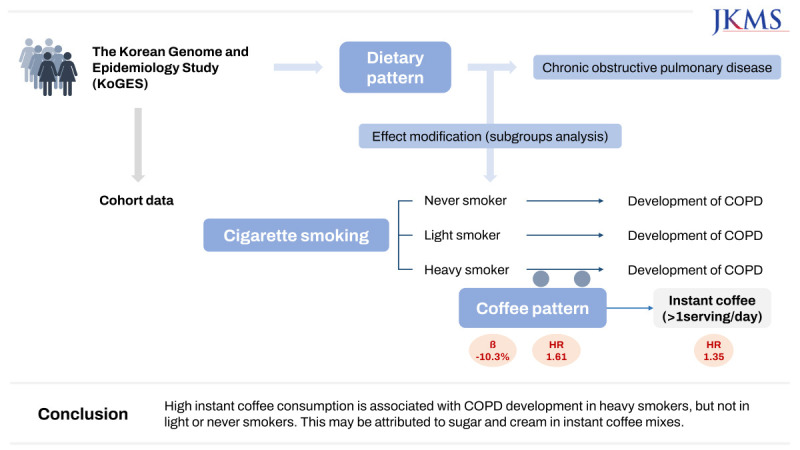
In a community-based cohort followed for 20 years, the high coffee consumption dietary pattern was associated with an increased risk of incident COPD and lower FEV1/FVC ratio in heavy smokers. When we further analyzed the associations between consumption levels of black coffee, combined coffee, and instant coffee and COPD, the association was only found for instant coffee in heavy smokers.
Previous studies have reported an association between a healthy/prudent dietary pattern and a lower risk of COPD.6282930 A prospective cohort study revealed that a dietary pattern characterized by high consumption of vegetables, fruits, water, tea, coffee, fish, and nuts was associated with good lung function.6 However, an unhealthy/Western-style dietary pattern has been associated with a higher risk of COPD in several studies.282931 A cross-sectional study indicated that high red meat, fat, coffee, and beer consumption was associated with poor lung function and a higher risk of COPD.31 However, to the best of our knowledge, no study has evaluated the interaction between dietary patterns and cigarette smoking, which is an important risk factor for COPD, and their associations with the risk of COPD.
Notably, the “coffee” pattern was characterized by a high intake of coffee, sugar, and cream. A large proportion of the coffee consumed may be made from instant coffee mix, as its use is widespread and has become increasingly popular among middle-aged Koreans.32 Meanwhile, several Korean studies have shown associations between the consumption of instant coffee mix and a higher risk of obesity, diabetes mellitus, and metabolic syndrome, which can affect lung function adversely and increase the risk of COPD.33 These associations may be explained by the high intake of sugar and cream, which are included in the instant coffee mix.32343536 Furthermore, we found that consumption of only instant coffee was associated with a higher risk of COPD in heavy smokers. Collectively, these findings suggest that instant coffee is responsible for the association between the high coffee consumption dietary pattern and an increased risk of incident COPD and lower FEV1/FVC ratio in heavy smokers.
We observed an interaction between the high coffee consumption dietary pattern and smoking status in the development of COPD, although the underlying mechanisms for this finding are unclear. However, in a previous study, soda intake and cigarette smoking were found to have synergistic effects on COPD in a Korean population, possibly owing to high intake of sugar from soda.9 High sugar consumption may cause obesity, leading to oxidative stress-related inflammatory responses in various parts of the body, including the respiratory system. These conditions cause pathological changes in the respiratory tract and impaired lung function.7373839 As cigarette smoking can also affect the respiratory tract through the deposition of various toxic substances, including nicotine and tar, and subsequent oxidative stress, the sugar and cream present in the instant coffee mix and cigarette smoking may possibly exert synergistic effects on the development of COPD by increasing oxidative stress and inflammation in the respiratory system. However, because inflammatory response can also increase the risks of other respiratory diseases, such as asthma and interstitial lung disease, more studies need to explore the possible effects of dietary factors, including instant coffee, on various respiratory diseases.
This study used data from a community-based cohort of non-institutionalized adults, most identified cases were likely of early-stage COPD because more severe COPD patients receive treatment in medical institutions. When we defined COPD with FEV1/FVC < 0.7 and the presence of respiratory symptoms to consider clinical COPD, we lost statistical significance for the results regarding the associations between “Coffee” pattern and COPD among heavy smokers, although the point estimates of the associations were still positive, and magnitudes of associations were similar to those of the main analyses (Table 3 and Supplementary Table 5). Therefore, our results should be cautiously extrapolated to more severe COPD patients, such as hospitalized patients and patients receiving more aggressive treatments. Accordingly, it is suggested that instant coffee intake is considered to be an important factor that plays a role in prevention of early-stage COPD.
Our study had several limitations. First, the interpretation of dietary patterns is sometimes arbitrary, and it is not always easy to derive clear public health implications (e.g., nutrition education programs) from studies using dietary patterns. The possibility that coffee-related foods and ingredients other than sugar or cream may have influenced the results should be cautiously investigated in future studies. Second, although the prevalence of cigarette smoking has decreased from 27.5% in 2010 to 20.6% in 2020 among Korean adults,40 we did not consider the impact of this reduced prevalence of smoking (e.g., decreased effects of instant coffee consumption on COPD). Third, although we defined COPD according to the 2018 Global Initiative for Chronic Obstructive Lung Disease guidelines (18), information bias regarding the outcome may exist. Further studies facilitating clinical diagnosis or more accurate diagnostic tools are warranted to address this concern.
Nevertheless, to the best of our knowledge, this is the first study to explicitly explore the interactions between dietary patterns and smoking status in the development of COPD. Moreover, longitudinal associations were investigated using data from a large-scale community-based cohort followed for 20 years. Finally, we used high-quality information on diet, cigarette smoking, and lung function obtained from a validated FFQ, a well-designed questionnaire, and spirometry.
The high coffee consumption dietary pattern was found to be associated with a higher risk of COPD development and lower FEV1/FVC ratio in heavy smokers. However, the association between coffee consumption and COPD was only observed for instant coffee; this may be attributable to the sugar and cream included in the instant coffee mix that is popular among middle-aged Koreans. Given the aging global population and increasing prevalence of COPD, these findings have important public health implications and can be used to develop better dietary guidelines to prevent COPD.
 XML Download