

 PDF
PDF Citation
 Print
Print


INTRODUCTION
Occupational injuries and diseases are a major public health concern in South Korea.12 According to the burden of disease study, annual occupation-attributable deaths are estimated to be approximately 1.5 million globally.3 In addition, occupational injuries or diseases impose a great economic burden on countries.4 Even without causing fatal outcomes, some physical hazards in the workplace can result in diseases that lead to permanent disability.5
Recent research has focused not only on preventing occupational injuries and diseases but also on managing the quality of life of victims.678 Occupational injuries and diseases have serious psychological consequences for workers. For example, victims of occupational injuries exhibit a high prevalence of psychiatric disorders such as major depression or post-traumatic stress disorder (PTSD).910 Furthermore, previous studies have shown that injured workers are likely to experience a decrease in their physical and occupational functions, which contributes to lowering their quality of life after occupational accidents.811
Self-esteem refers to one’s evaluation of their worth, and high self-esteem plays a key role in protecting psychological health in response to negative life events.12 Moreover, high self-esteem is an important motivating factor affecting an individual’s social and occupational engagement.13 Thus, high self-esteem has found to be associated with better mental health and subjective health.1415 Previous studies have shown that major injuries and diseases can negatively affect self-esteem. Those severely injured experience drastic changes in their appearance and physical and social functioning, which has a profound impact on their identity, self-esteem, and self-concept.16 In the occupational context, little is known about the self-esteem of victims of occupational injuries and diseases. In the existing literature, severe occupational injuries have been found to cause a loss of self-worth and identity.17 However, no study has examined longitudinal self-esteem trajectories after occupational injuries or diseases.
It is noteworthy that individuals’ self-esteem can follow different trajectories depending on their demographic features and socioeconomic environment.18 Particularly, a previous study revealed that individual differences are observed in the impact of life events on subsequent changes in self-esteem trajectories.19 Therefore, it can be hypothesized that self-esteem trajectories after occupational injury or disease vary according to the worker’s circumstances. If so, investigating which characteristics or environments are related to the increasing (or decreasing) self-esteem trajectory will provide new insight into workers’ quality of life after occupational injuries or diseases.
To the best of our knowledge, the present study is the first to explore the self-esteem trajectories of workers who have experienced occupational injury or disease. Based on a nationally representative cohort consisting of Korean workers who had experienced occupational injury or disease, this study aims to 1) identify and classify subgroups of the longitudinal self-esteem trajectory, 2) explore how individual features and socioeconomic environments (e.g., gender, age, and income) are related to trajectory membership, and 3) confirm the difference in subjective health conditions among trajectory subgroups. Consequently, our findings will provide policymakers with useful information to implement appropriate policies to improve the quality of life and psychological health of victims of occupational injury or disease.
METHODS
Data source
We obtained the study sample from the cohort of the Panel Study of Workers’ Compensation Insurance (PSWCI), which was followed up from 2013 (Wave 1) to 2017 (Wave 5) by the Korea Workers’ Compensation and Welfare Service (KCOMWEL). KCOMWEL is the national organization in charge of compensation for occupational injuries and diseases in Korea and has information on all workers recognized as having occupational injuries and diseases in Korea. In 2013, KCOMWEL sampled workers who had experienced occupational injuries or diseases and annually followed up on their health and socioeconomic status until 2017. The target population of the PSWCI cohort was 82,493 workers who completed workers’ compensation medical care in 2012 after experiencing occupational injury or disease. 2000 survey participants were selected via systemic sampling, in which sex, age, region, and disability rating were stratifying variables and were followed from 2013 (Wave 1) to 2017 (Wave 5). Annual surveys were conducted via one-on-one face-to-face interviews with trained interviewers. The response rates during the 5 years were: 100.0% in 2013; 90.2% in 2014; 85.2% in 2015; 83.2% in 2016; 80.8% in 2017. Finally, our study sample included 2000 participants with 8783 total observations.
Measures
Self-esteem
Self-esteem was assessed by the Rosenberg Self-Esteem Scale (RSES).20 The RSES consists of 10 questions and the response to each question is based on a 4-point Likert scale. The reliability and validity of the Korean version of the RSES were reported in a previous study.21 Answers to the negative questions were coded in reverse so that higher scores indicated higher self-esteem. In this study, Cronbach’s alpha for each year ranged from 0.77 to 0.79. The summed scores for the ten questions were used.
Covariates
The baseline characteristics of the survey participants were obtained during the first survey year (2013; Wave 1). Demographic features (age and sex) were also included as covariates. Age was classified into “< 40,” “40–49,” “50–59,” or “≥ 60.” Educational level was classified as having completed “middle school or below” or “high school or above.” The total household income was divided by the median value (low and high). Marital status was classified as unmarried/others and married. Certification was defined as having one or more professional certifications. The accident type was classified into “occupational injury” or “occupational disease.” The disability rating, which was assessed according to the Industrial Accident Compensation Insurance Act in Korea, consisted of 14 grades. The KCOMWEL assesses disability ratings for each case based on the opinions of specialized physicians to determine the amount of compensation. We classified the disability rating into “moderate-to-severe (grade 1–10),” “mild (grade 11–14),” and “no grade.” Questions on difficulties in daily living activities consisted of questions regarding 1) learning, remembering, and concentrating; 2) domestic activities such as dressing and bathing; 3) out-of-home activities such as shopping; 4) occupational activities. Responses to each question were assessed based on a 5-point Likert scale, in which a higher score indicates greater difficulty in daily living activities. The total score, which ranged from 4 to 20, was treated as a continuous variable. Finally, workers’ return-to-work (RTW) status was classified into “non-RTW” (unemployed), “re-employed,” and “returned to original work.” Accident type and disability rating were obtained from the administrative data of the KCOMWEL, and other variables were self-reported by the survey participants.
Subjective health
Subjective health was assessed using the following question: “How do you feel about your current health?” The responses were measured on a 4-point Likert scale: 1) “very bad,” 2) “fairly bad,” 3) “fairly good,” 4) “very good.” Either “very bad” or “fairly bad” was defined as poor subjective health.
Statistical analyses
As a descriptive analysis, aggregate trends of mean RSES of overall participants and subgroups stratified by age group and sex were presented.
Next, we employed the growth mixture model (GMM) to classify the subgroup (latent class) in the longitudinal trajectories of self-esteem. GMM, which is an extension of the latent growth model (LGM), derives latent patterns of trajectories of a variable of interest and allocates the latent class to each individual.22
The GMM analysis involved the following three-step procedure: First, we checked whether there were latent classes in the pattern of self-esteem trajectories based on the LGM, which included only one group. We constructed a linear LGM that included latent growth factors, representing the intercept and slope. If the variances in the latent growth factor (intercept or slope) are significant, it can be assumed that there is heterogeneity in the patterns of self-esteem trajectories.23 Second, GMMs with different numbers of latent classes are fitted to determine the optimal number of latent classes. The following model fit indices were calculated to select the number of latent classes: Akaike information criterion, Bayesian information criterion (BIC), sample size adjusted BIC (SABIC), Lo-Mendell-Rubin adjusted likelihood ratio test (LMR-LRT), parametric bootstrapped likelihood ratio test (BLRT), and entropy. Third, after selecting the GMM, we explored how individual characteristics measured in the baseline year were associated with trajectory membership. The R3STEP procedure in Mplus,24 which involves multinomial logistic regression, was conducted to estimate the odds ratios (ORs) and 95% confidence intervals (CIs). Fourth, the association of self-esteem trajectories and risk of poor subjective health in 2013 (Wave 1) and 2017 (Wave 5) was estimated using logistic regressions that adjusted for covariates measured in the same year (time-varying covariates). Descriptive analyses and visualization were conducted using R (version 4.2.2; R Foundation for Statistical Computing, Vienna, Austria). The GMM analysis was conducted using Mplus (version 8.8; Muthén & Muthén, Los Angeles, CA, USA).
Missing values
No missing values were observed for the covariates or self-esteem measured at baseline (Wave 1). Therefore, all participants (N = 2,000) were included in the analysis. However, sample attrition and non-response occurred because of the longitudinal nature of the study. In this study, the full information maximum likelihood method was applied to GMM to fully use cases with missing values.
Sensitivity analysis
Information on the covariates was obtained in all survey years and not only in the baseline year. To fully use our dataset, the generalized estimation equation (GEE) was used to investigate the association between covariates and self-esteem measured in the same year during Waves 1 to 5. The fully adjusted GEE model was fitted.
Data availability
The raw PSWCI data are available at https://www.comwel.or.kr/Researchinstitute/index.do.
RESULTS
Descriptive analysis
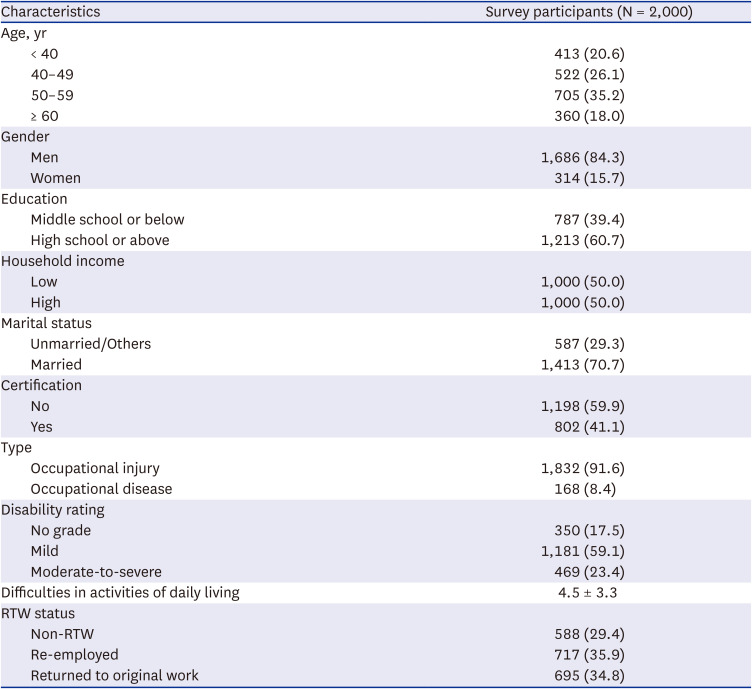
Table 1 shows the baseline characteristics of the study participants. The study participants consisted of 1686 men (84.3%) and 314 women (15.7%). In addition, there were 1,832 injury cases (91.6%) and 168 disease cases (8.4%).
Table 1
Baseline characteristics of the cohort samples
Supplementary Fig. 1 depicts the aggregate trend of the mean RSES during the study period, stratified by age and sex. An overall increasing trend was observed among study participants. The mean RSESs were higher among young participants.
Preliminary analysis
Supplementary Table 1 presents the results of LGM which included only one group. Variances in the latent growth factors (intercept and slope) were significant (P value < 0.001). This indicated that there were heterogeneous patterns of self-esteem trajectories both for the initial values and change rates; therefore, GMM analysis with latent classes was followed.
Supplementary Table 2 presents the model fit statistics and allocated percentages of study participants in each subgroup. GMMs with different numbers of latent classes were fitted. The supplementary details present the estimated means and spaghetti plots of self-esteem for each GMM (Supplementary Data 1). All GMMs showed a medium level of classification quality (entropy > 0.6).25 The four- and five-class GMM had a greater BIC value than the three-class GMM. For class four- and five-class GMM, the number of the smallest subgroup was less than 1% of the total number of samples which could reduce generalizability and statistical power.26 Additionally, although the LMR LRT of the three-class GMM is marginally insignificant, previous studies have suggested that BLRT is a better indicator of the number of classes.2627 Thus, considering the model fit statistics and the interpretability of the classification, the three-class GMM was selected as the final model.
Main analysis
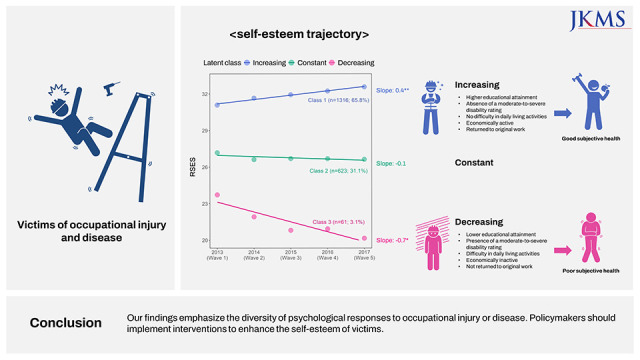
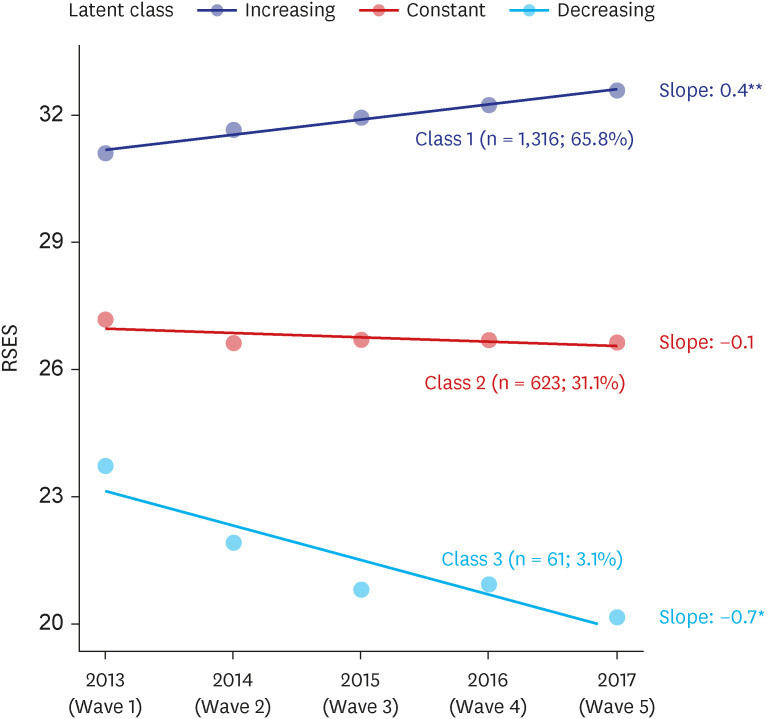
Fig. 1 presents the observed mean RSES and estimated values for the slopes of each latent class. Three distinct self-esteem trajectories were identified: the “Increasing” group (n = 1,316; 65.8%); the “Constant” group (n = 623, 31.1%); the “Decreasing” group (n = 61, 3.1%). Significant change rates (slope > 0 or slope < 0) were observed for the “Increasing” and “Decreasing” trajectories.
Fig. 1
Observed mean of RSES and estimated values for slopes from three-class growth mixture model.
RSES = Rosenberg self-esteem scale.
*P = 0.011; **P < 0.001.
The baseline characteristics of the participants following three different trajectories are presented in Table 2, and the association between trajectory membership and covariates is presented in Fig. 2. Those following an increasing self-esteem trajectory, compared to those with a constant self-esteem trajectory, were more likely to have high educational attainment (OR, 1.86; 95% CI, 1.20–2.88), a high household income (OR, 1.75; 95% CI, 1.14–2.68), be married (OR, 1.94; 95% CI, 1.19–3.15), have a professional certificate (OR, 1.92; 95% CI, 1.24–2.99), without moderate-to-severe disability rating (OR, 0.49; 95% CI, 0.25–0.96), not having difficulty in daily living activities (OR, 0.81; 95% CI, 0.75–0.88), and be economically active (re-employed: OR, 2.46; 95% CI, 1.52–3.98; returned to original work: OR, 4.46; 95% CI, 2.65–7.50). Conversely, compared to those with an increasing self-esteem trajectory, those with a decreasing self-esteem trajectory were less likely to have a high household income (OR, 0.27; 95% CI, 0.09–0.77), a professional certificate (OR, 0.22; 95% CI, 0.05–0.90), absence of difficulty in daily living activities (OR, 1.62; 95% CI, 1.34–1.94), and be re-employed (OR, 0.10; 95% CI, 0.02–0.54).
Table 2
Comparison of baseline characteristics according to latent class membership
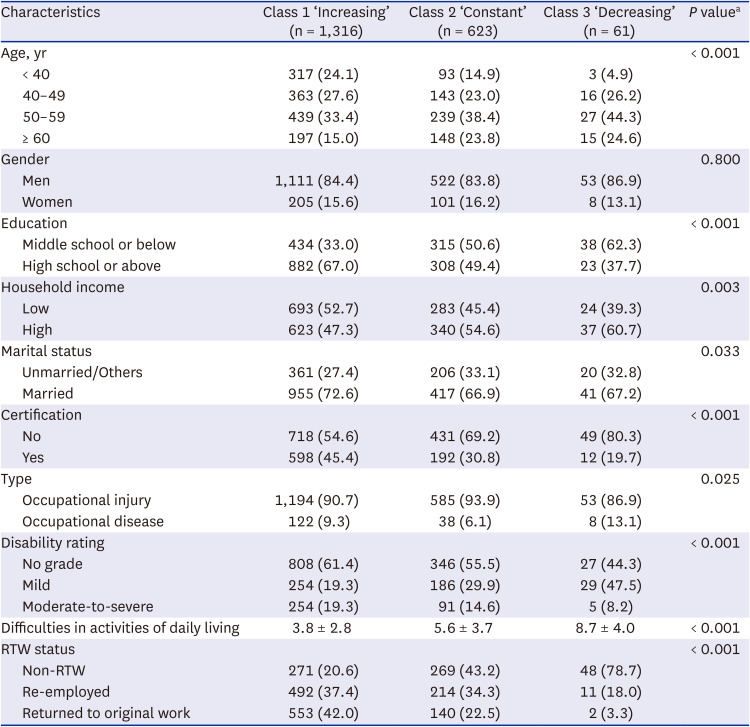
Fig. 2
Associations between baseline characteristics and trajectory membership based on multinomial logistic regression.
RTW = return-to-work.
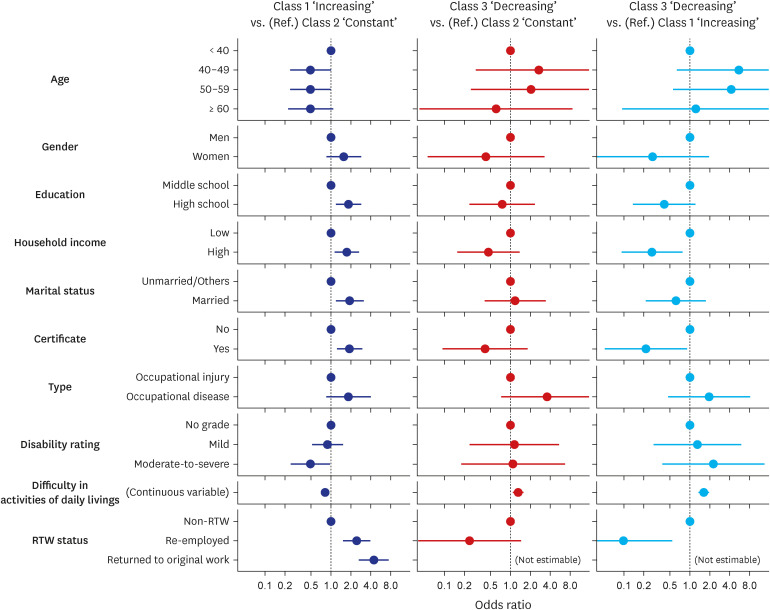
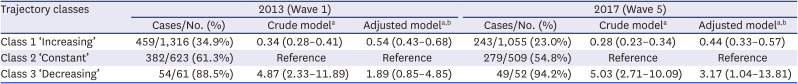
Table 3 shows the association of self-esteem trajectories and poor subjective health. The risk of poor subjective health increased in those with decreasing self-esteem trajectory (OR, 1.89; 95% CI, 0.85–4.85 in Wave 1 to OR, 3.17; 95% CI, 1.04–13.81 in Wave 5). On the other hand, the risk of poor subjective health decreased in those with increasing self-esteem trajectory (OR, 0.54; 95% CI, 0.43–0.68 in Wave 1 to OR, 0.44; 95% CI, 0.33–0.57 in Wave 5).
Table 3
Association of self-esteem trajectories and risk of poor subjective health
Sensitivity analysis
A GEE analysis was conducted to explore the concurrent association between covariates and self-esteem (Supplementary Table 3). Young age, female sex, high income, being married, having a certification, having no disability grade, and being economically active were related to higher self-esteem.
DISCUSSION
Our study identified and classified self-esteem trajectories using a nationally representative cohort of South Koreans who had experienced occupational injuries or diseases. Although an overall increasing trend was observed, three distinctive trajectory subgroups emerged. Approximately two-thirds of the sample followed an increasing trajectory; however, the rest of the sample followed a constant or decreasing trajectory. Thus, our findings highlight the heterogeneity of psychological responses to occupational injuries and diseases. Furthermore, trajectory membership was not equally distributed among the workers. We found that socioeconomic environment, personal resources, and return to work act as determinants of the self-esteem trajectory after occupational injury and disease. Finally, we confirmed that the trajectory of increasing self-esteem was related to the improvement of subjective health, while the trajectory of decreasing self-esteem was related to the deterioration of subjective health.
Previous studies have reported the psychological response of workers to occupational injuries or diseases. Those who experienced occupational injury or disease exhibited an elevated prevalence of depression and PTSD and frequently reported a loss of self-worth and identity.1728 In addition, occupational injury or disease often causes permanent damage to one’s appearance and physical and occupational function, leading to the deterioration of self-esteem.10 Overall, the existing literature has focused only on the negative effects of occupational injury or disease, neglecting how workers’ psychological health can recover from an accident and adjust to their post-injury life.
The term “post-traumatic growth (PTG)” refers to an experience of positive change that occurs after struggling with challenging life crises.29 Contrary to conventional wisdom, our results suggest that a substantial proportion of victims experienced PTG in self-esteem after an accident. Our findings are consistent with those of an earlier study that longitudinally followed the psychological well-being of patients who experienced occupational hand injuries.30 According to this previous study, the prevalence of psychological stress, such as anxiety and depression, steadily decreased over 18 months after the accident.30 Similarly, a previous study that analyzed post-injury mental health trajectories revealed that about three-quarters of patients who experienced a severe physical injury gradually recovered from the negative psychological impact of an accident.31
It should be noted that workers’ self-esteem can follow different trajectories depending on individual characteristics. Our results are consistent with previous findings that revealed heterogeneity in patients’ response to an injury or disease event. Studies examining psychological symptoms after physical injury suggest that patients could be categorized into those whose symptoms are improving, invariant, or deteriorating.3132 In addition, our findings reinforce the evidence that an individual’s self-esteem trajectory varies with the way they respond to life events depending on personal and social circumstances.19 Therefore, vulnerable workers who experience stagnant or decreased self-esteem after occupational injury or disease should not be masked by the aggregate trend of improvement in self-esteem of the total sample.
Our study is meaningful as we not only identified trajectory subgroups but also found how demographic, socioeconomic, and occupational factors are related to the increasing or deteriorating trajectory of self-esteem. Previous studies have described how different patients undergo psychological adjustment to accidents, including traumatic injury, spinal cord injury, and burns.31323334 As a moderating factor, rich socio-economic resources, such as high educational and income levels, can mitigate the negative impact of critical events and facilitate PTG and psychological adjustment to post-injury life.34 In this study, disability rating (severity of disease) and difficulties in activities of living were also related to worse self-esteem trajectories, which is in line with the findings of a previous study that disease severity is associated with psychological adjustment.35
We found that self-esteem trajectories after occupational injuries and diseases were related to subsequent changes in the risk of poor subjective health. Our findings are consistent with those of previous studies that self-esteem is closely related to subjective health and mental health conditions.1415 High self-esteem has been found to encourage individuals to adopt more desirable health-related behaviors. Also, high self-esteem helps individuals actively cope with psychological risks such as stress, increasing their capacity of resilience.36
Our study has some practical implications in that certain modifiable factors were found to be related to trajectory membership after occupational injury or disease. Specifically, those who had a certification and were re-employed or returned to their original work were significantly more likely to follow an increasing trajectory and less likely to follow a constant or decreasing trajectory. Our results are in accordance with several studies that suggested that work serves as a means of preserving self-esteem, self-concept, and identity in patients who were injured or diagnosed with cancer.3738 Additionally, a previous review found that multidomain interventions assisting RTW were effective in reducing the duration away from work in patients with musculoskeletal and mental health problems.39 Therefore, interventions such as vocational retraining and encouraging re-employment may help injured workers follow an increasing self-esteem trajectory. Therefore, active policies are warranted to help the recovery of self-esteem and psychological status of workers, with low socioeconomic status, having higher odds of following worse self-esteem trajectories. Additionally, our results suggest that the level of self-esteem can serve as a meaningful performance indicator for mental health programs targeting victims of occupational injuries or diseases.
This study had some limitations. First, some variables, including injury/disease site and mechanism of injury/disease, are not available due to a lack of information. Considering that our sample encompasses heterogeneous types of occupational injuries and diseases, a more detailed interpretation is possible if a subgroup analysis is performed in the following studies that target a single injury or disease. Second, lack of information on the self-esteem of workers before occupational injury or disease limits the interpretation of temporal changes in self-esteem. If the information on self-esteem before an occupational injury or disease is available, it will provide an important clue for uncovering the overall trajectory of how self-esteem decreases and recovers before and after an event. Finally, considering that the self-esteem of the disabled can be influenced by social perception and stigma toward the disability,40 it is necessary to verify whether similar self-esteem trajectories are observed in other cultural and social contexts.
Nevertheless, the present study has some notable strength. Our analysis was based on a nationally representative occupational cohort. Therefore, our study has several strengths in terms of generalizability. Also, validated measurements were used to identify self-esteem trajectories. Finally, this is the first study to explore longitudinal self-esteem trajectories and their relation to subjective health in workers who have experienced occupational injury or disease.
This study explored longitudinal self-esteem trajectories among workers who had experienced occupational injury or disease. Although the increasing trajectory of self-esteem was the most common pattern, heterogeneous trajectories, in which workers experienced stagnant or decreased self-esteem were also observed. High socioeconomic status and return to original work were related to self-esteem recovery. Also, we found that self-esteem trajectories of victims of occupational injuries and diseases were closely related to subsequent changes in subjective health. Therefore, policymakers should consider individual circumstances when implementing interventions aimed at facilitating the self-esteem recovery of workers after occupational injury or disease.
 XML Download