

 PDF
PDF Citation
 Print
Print


INTRODUCTION
Metabolic syndrome is a cluster of metabolic abnormalities, which together raise the risk of an individual developing diabetes, cardiovascular disease, and cerebrovascular disease [1]. A diagnosis of metabolic syndrome is made when three or more of the following abnormalities are present: abdominal obesity, hypertension, elevated fasting blood glucose (FBG) levels, high serum triglycerides (TG), or low levels of serum high-density lipoprotein (HDL)-cholesterol [2]. According to the 2014 Korea National Health and Nutrition Examination Survey (KNHANES), the prevalence of obesity, hypertension, diabetes, and hypercholesterolemia was 32.9%, 25.4%, 10.1%, and 14.6%, respectively in adults over the age of 30 [3]. In the 2018 survey, the prevalence of obesity, hypertension, diabetes, and hypercholesterolemia was 36.9%, 28.3%, 10.4%, and 21.4%, respectively, suggesting that the prevalence rates of metabolic abnormalities associated with the syndrome are increasing [4].
Metabolic syndrome is caused by the interaction of genetic and various lifestyle factors. Physical activity, smoking, drinking, and eating habits are among the key lifestyle-related factors that play a role in the development of the syndrome [5678]. A shift in the diet from healthy home cooked meals to a higher intake of a western style diet [9], processed and instant food products, and pre-packaged take-out and delivery foods are thought to be directly to the increase in the prevalence of the metabolic syndrome [10].
The food systems across the world have undergone a significant change over the past few decades due to advances in food processing and technology. There has been an increase in the production and accessibility of processed foods, in both high- and middle-income countries [11].
There are various food classification systems according to the nature, extent, and purposes of the industrial processes they undergo. Poti et al. [11] presented the now widely used NOVA classification system. The NOVA system classifies foods into 4 groups based on the industrial processes used and considers the physical, biological, and chemical techniques and additives involved in their production [12]. The NOVA system is classified from 1 to 4, where 1 includes unprocessed or minimally processed food, to NOVA 4 which includes ultra-processed food, industrially manufactured, and ready-to-eat [13]. However, ultra-processed food is nutritionally unbalanced and has relatively much higher calories with higher sugar, fat, and saturated fat levels and much lower dietary fiber and micronutrient levels than natural food products [14].
An earlier study has shown that a higher intake of ultra-processed food was associated with increased obesity in Korean women [14]. In a study based on National Health and Nutrition Examination Survey (NHANES) data the higher the proportion of ultra-processed food intake to the total food intake, the higher the prevalence of metabolic syndrome [15]. Similarly, a study on Brazilian adolescents reported the relationship between ultra-processed foods and metabolic syndrome [16]. However, in the case of Korea, where dietary patterns are rapidly becoming westernized, studies that analyze ultra-processed foods and the risk of metabolic syndrome have not yet been conducted. Therefore, this study aimed to analyze the relationship of metabolic syndrome with the consumption of ultra-processed foods in Korean adults using the representative data from the KNHANES.
SUBJECTS AND METHODS
Selection of research subjects
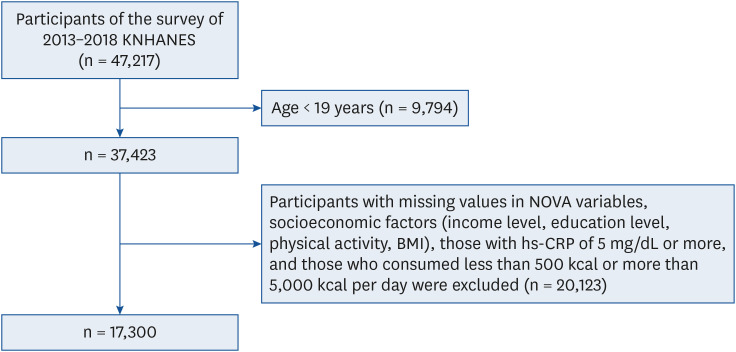
This study analyzed the raw data of the 6th and 7th KNHANES (2013-2018) provided by the Korea Disease Control and Prevention Agency (KDCA; formerly Korea Centers for Disease Control and Prevention). A total of 47,217 participants were included in the KNHANES. Among them, 37,423 adults aged 19 years or older were included in the initial sample. Among these subjects, those with missing values in the NOVA variables, socioeconomic factors (income level, education level, physical activity, body mass index [BMI]), high-sensitivity C-reactive protein (hs-CRP) of 5 mg/dL or more, and those who consumed less than 500 kcal or more than 5,000 kcal per day were excluded. Finally, 17,300 people (7,286 men, 10,014 women) who met the above criteria were selected for inclusion in the study (Fig. 1). This study was conducted after receiving approval from the Institutional Review Board of Wonkwang University (WKIRB-2021-SB-047).
Classification of processed foods
Data on the diet of the participants were collected from KNHANES using the 24-h recall method. A total of 5,394 different types of foods consumed by the participants were analyzed using the NOVA food classification criteria proposed by Monteiro et al. as follows: NOVA 1 (unprocessed/minimally processed foods), NOVA 2 (processed culinary ingredients), NOVA 3 (processed foods), and NOVA 4 (ultra-processed foods) [121317]. Subjects were classified into quartiles according to the percentages of energy derived from the intake of ultra-processed foods. Foods corresponding to the classification of ultra-processed foods are shown in Supplementary Table 1.
Physical and biochemical parameters
The following physical and biochemical parameters were assessed and used for analysis: FBG, glycosylated hemoglobin (HbA1c), systolic blood pressure (SBP), diastolic blood pressure (DBP), total cholesterol (TC), HDL-cholesterol, low-density lipoprotein (LDL)-cholesterol, TG, and waist circumference (WC).
Diagnosis of metabolic syndrome
An individual fulfilling three or more of the following criteria was diagnosed to have the metabolic syndrome: serum TG 150 mg/dL or higher, HDL-cholesterol less than 40 mg/dL for men, and less than 50 mg/dL for women, FBG level greater than 100 mg/dL, SBP greater than 130 mmHg or DBP greater than 85 mmHg and abdominal circumference greater than 90 cm for men or greater than 85 cm for women. Those participants who had been prescribed anti-hypertensive and anti-diabetic medications were considered to have satisfied the hypertension and FBG criteria [1819].
Covariates
The covariates in this study included demographic and social, health behavior, and health status factors. The demographic characteristics included age, education level, household income, and marital status. Education level was classified into lower than elementary, middle school, high school, and higher than university. Household income was classified into 4 groups: lowest, lower middle, upper middle, and highest. Marital status was assessed as yes (married) or no (single). The health behavior and health status factors included smoking, alcohol consumption, aerobic activity, and BMI. Smoking was assessed as daily smokers (more than 100 cigarettes in the lifetime), sometimes (less than 100 cigarettes in the lifetime) or no (never smoked during lifetime) for analysis, and alcohol consumption was considered as yes (at least one drink during lifetime) or no (never drank during lifetime). Aerobic physical activity included moderate-intensity physical activity for more than 2 h and 30 min, high-intensity physical activity for 1 h and 15 min per week. Aerobic physical exercise was assessed as yes or no.
Statistical analysis
The SPSS ver. 26.0 program was used for statistical analysis (IBM Corp., Armonk, NY, USA). As recommended by the KNHANES, a complex sample analysis method was applied for the estimation of variance and weighting. General linear model analysis was conducted to express continuous variables according to the mean and standard error. Cross-analysis was performed to define categorical variables as n (%). Age, household income, education level, smoking, alcohol consumption, and aerobic activity were used as confounding variables for the index of the biochemical indicators according to the percentages of energy from the intake of ultra-processed foods. For the metabolic syndrome odds ratio (OR) was computed according to the consumption of ultra-processed foods, and logistic regression analysis was performed considering the following confounding variables: age, income level, education level, smoking, drinking, and aerobic physical activity. After dividing the ultra-processed food into quartiles, quartile 4 with the highest intake, was set as the reference group, and the metabolic syndrome OR according to ultra-processed food intake was calculated using logistic regression analysis. The quartile of ultra-processed food intake was treated as a continuous variable, and trend analysis (P-trend) was performed using logistic regression analysis. Results were considered to be statistically significant when the P-value was less than 0.05.
RESULTS
General characteristics
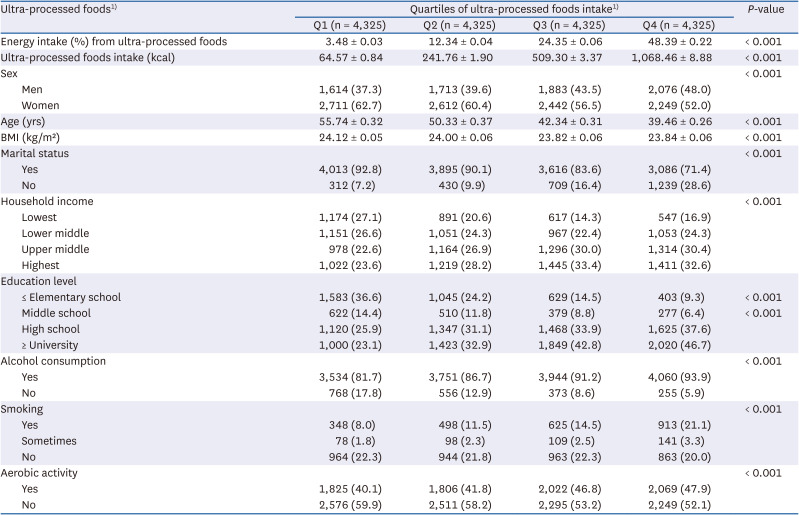
The analysis of the general characteristics of subjects according to their consumption of ultra-processed foods is represented in Table 1. The quartile group with the highest consumption of ultra-processed foods was younger (P < 0.001), had a higher education level (P < 0.001), and had a higher proportion of unmarried subjects (P < 0.001) than the other quartile groups. The consumption of ultra-processed food was found to be high in the drinking group (P < 0.001), the smoking group (P < 0.001), and the non-aerobic exercise group (P < 0.001).
Table 1
General characteristics of the study population
Nutrient intake and physical and biochemical indicators according to the consumption of ultra-processed foods
Nutrients and biochemical indicators based on the consumption of ultra-processed foods are shown in Table 2. The intake of energy (Q1: 1,701.42 ± 27.45 kcal, Q2: 1,774.97 ± 28.72 kcal, Q3: 1,800.66 ± 26.84 kcal, Q4: 1,758 ± 28.61 kcal, P < 0.001), fat intake (Q1: 33.14 ± 0.09 g, Q2: 39.40 ± 0.97 g, Q3: 45.14 ± 0.96 g, Q4: 51.21 ± 0.94 g, P < 0.001), and sodium intake (Q1: 3,403.28 ± 68.14 mg, Q2: 3,644.85 ± 67.79 mg, Q3: 3,634.98 ± 66.56 mg, Q4: 3,488.62 ± 66.14 mg, P < 0.001) were increased in the highest quartile group (Q4) compared to the lowest quartile group (Q1). On the contrary, dietary fiber, iron, and potassium intake were decreased in Q4 compared to Q1. The results of analyzing the biochemical indicators based on the intake of ultra-processed foods showed that TC (Q1: 184.75 ± 2.20 mg/dL, Q4: 188.83 ± 2.27 mg/dL, P < 0.001) and DBP (Q1: 73.01 ± 0.47 mmHg, Q4: 73.66 ± 0.44 mmHg, P = 0.002), increased as the consumption of ultra-processed foods increased. Additionally, TG and LDL-cholesterol levels were higher in Q4 than in Q1.
Table 2
Nutrients and biochemical parameters according to the consumption of ultra-processed foods
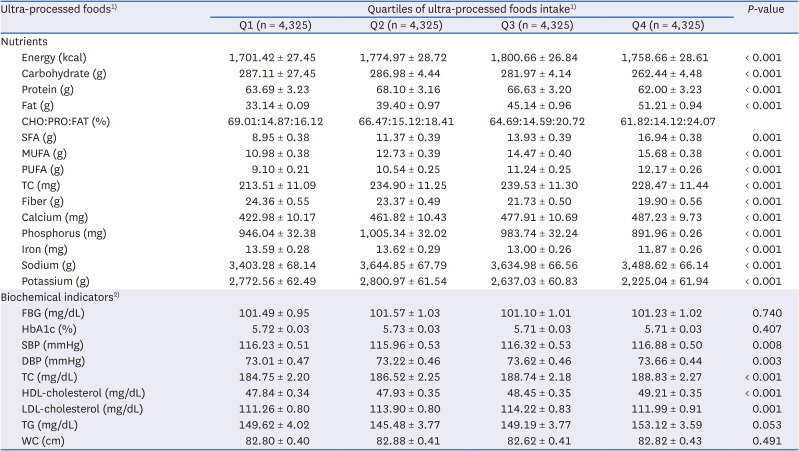
Values are presented as mean ± SE.
CHO, carbohydrate; PRO, protein; FAT, fat; SFA, saturated fatty acid; MUFA, monounsaturated fatty acid; PUFA, polyunsaturated fatty acid; TC, total cholesterol; FBG, fasting blood glucose; HbA1c, glycosylated hemoglobin; SBP, systolic blood pressure; DBP, diastolic blood pressure; HDL, high-density lipoprotein; LDL, low-density lipoprotein; TG, triglycerides; WC, waist circumference.
1)The intake levels of ultra-processed foods were determined in quartiles according to the distributions of the total intake. (Q1: < 7.58, Q2: 7.58–17.44, Q3: 17.44–32.32, Q4: ≥ 32.33% of energy).
2)Tests were adjusted for age, education level, household income, smoking, drinking, and aerobic activities.
OR for metabolic syndrome according to intake of ultra-processed foods
The ORs for the metabolic syndrome according to the percentages of energy from the intake of ultra-processed foods are shown in Table 3. In men, the increase in the percentages of energy from the intake of ultra-processed foods raised the odds of incidence of metabolic syndrome after adjustment for age, education level, household income, smoking, alcohol consumption, and aerobic exercise (Q1: OR, 0.77; 95% CI, 0.66–0.90; Q1 vs. Q4 (reference), P-trend < 0.001). In women, the consumption of ultra-processed foods was not associated with an increase in metabolic syndrome after adjustment for age, education level, household income, smoking, alcohol consumption, and aerobic exercise.
Table 3
Adjusted ORs of metabolic syndrome according to the intake of ultra-processed foods
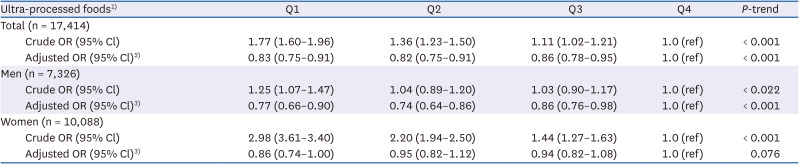
OR, odds ratio; CI, confidence interval; Q, quartile.
1)The intake levels of ultra-processed foods were determined in quartiles according to the distributions of the total intake. (Total: Q1: < 7.58, Q2: 7.58–17.44, Q3: 17.44–32.32, Q4: ≥ 32.33% of energy) (Men: Q1: < 7.58, Q2: 7.58–17.43, Q3: 17.44–32.31, Q4: ≥ 32.34% of energy) (Women: Q1: < 7.58, Q2: 7.58–17.44, Q3: 17.44–32.32, Q4: ≥ 32.33% of energy).
2)Tests were adjusted for sex, age, education level, household income, smoking, drinking, and aerobic activities.
3)Tests were adjusted for age, education level, household income, smoking, drinking, and aerobic activities.
OR for each factor in the metabolic syndrome according to the consumption of ultra-processed foods
Table 4 shows the OR for each factor of the metabolic syndrome according to the intake of ultra-processed food by the subjects. Consumption of ultra-processed foods raised the odds of hypertension (Q1: OR, 0.82; 95% CI, 0.74–0.92; Q1 vs. Q4 (reference), P-trend < 0.001) and increase in WC (Q1: OR, 0.90; 95% CI, 0.82–1.00; Q1 vs. Q4 (reference), P-trend < 0.001) after adjustment for sex, age, education level, household income, smoking, drinking alcohol and aerobic exercise. In the case of men, the increased intake of ultra-processed foods was associated with hypertension (Q1: OR, 0.72; 95% CI, 0.62-0.85; Q1 vs. Q4 (reference), P-trend < 0.001) and TG (Q1: OR, 0.83; 95% CI, 0.72–0.94; Q1 vs. Q4 (reference), P-trend < 0.001) which are both a part of the diagnostic criteria for metabolic syndrome. In the case of women, the consumption of ultra-processed food products was not associated with an increase in the metabolic syndrome after adjustment for age, education level, household income, smoking, alcohol consumption, and aerobic exercise. Additionally, an increase in the percentages of energy from the intake of ultra-processed foods showed no association with the components of the metabolic syndrome.
Table 4
ORs of metabolic syndrome according to the intake of ultra-processed foods
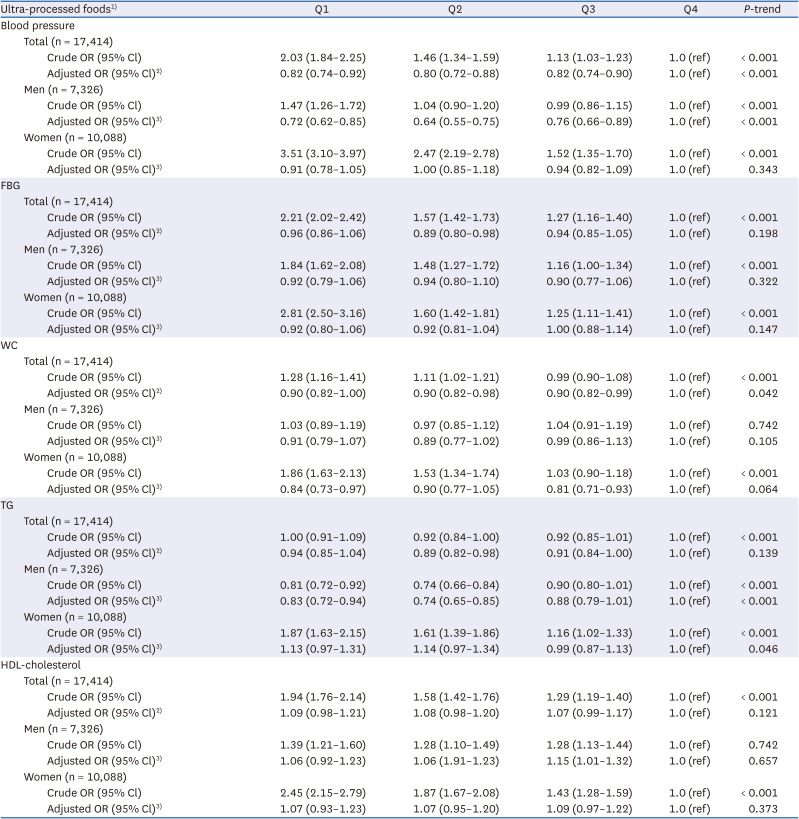
CI, confidence interval; OR, odds ratio; Q, quartile; FBG, fasting blood glucose; WC, waist circumference; TG, triglycerides; HDL, high-density lipoprotein.
1) The intake levels of ultra-processed foods were determined in quartiles according to the distributions of the total intake (Total: Q1: < 7.58, Q2: 7.58–17.44, Q3: 17.44–32.32, Q4: ≥ 32.33% of energy; Men: Q1: < 7.58, Q2: 7.58–17.43, Q3: 17.44–32.31, Q4: ≥ 32.34% of energy; and Women: Q1: < 7.58, Q2: 7.58–17.44, Q3: 17.44–32.32, Q4: ≥ 32.33% of energy).
2)Tests were adjusted for sex, age, education level, household income, smoking, drinking, and aerobic activities.
3)Tests were adjusted for age, education level, household income, smoking, drinking, and aerobic activities.
DISCUSSION
This study analyzed the relationship between metabolic syndrome and the consumption of ultra-processed foods in adults over 19 years who had participated in the 6th and 7th KNHANES (2013–2018). We observed that the OR of metabolic syndrome increased in the group with the highest percentages of energy intake from the ultra-processed foods relative to the group with the lowest intake. The positive correlation between the consumption of ultra-processed foods and the metabolic syndrome was consistent with results from smaller studies conducted in Brazil and Canada [1620].
In this study, ultra-processed food was classified using the NOVA system proposed by Monteiro et al. [14] based on the 24-h recall method used in the KNHANES. The food intake was divided into quartiles based on the percentages of energy derived from the consumption of ultra-processed foods, and these percentages were as follows: Q1: 3.48%, Q2: 12.34%, Q3: 24.35%, Q4: 48.39%. In an earlier study by Blanco Rojo et al. [21] the same NOVA classification system was used to categorize the foods. The percentages of energy from the consumption of ultra-processed foods in that study were: Q1: 8.68%, Q2: 18.60%, Q3: 27.82%, Q4: 42.83%. We inferred that the reasons for the differences between the two studies may be due to the fact that it was conducted a few years earlier (June 2008 to October 2010) and also due to the differences in eating habits by race between the 2 study populations. Recently, a significant increase in the daily percentages of energy derived from the intake of ultra-processed foods has been reported worldwide. In industrialized countries, ultra-processed foods account for 20–50% of the total calorie intake, with 24% in Spain, 36% in France, 57% in the United Kingdom, and 58% in the United States. However, in a study conducted on Italians, the consumption rate of ultra-processed foods was 12.6% due to a predominantly Mediterranean diet consisting of fresh fruits, vegetables, and fish. Thus, a shift in eating habits to a western style diet could increase the intake ratio of energy from ultra-processed foods [2122232425].
An analysis of the nutrients from ultra-processed foods in this study showed that the consumption of ultra-processed foods resulted in increased energy, fat, saturated, monounsaturated, and polyunsaturated fatty acids, TC, and sodium intake. The intake of dietary fiber, iron, potassium, and vitamin C was found to be decreased. In one study that analyzed the relationship between ultra-processed foods intake and mortality among 11,898 Americans aged 20 yrs or older, the frequency of ultra-processed foods intake was divided into quartiles and compared to the low intake group, the total energy, total fat, saturated fat, and monounsaturated fat intake was increased, and fiber and micronutrient intake was decreased in the high intake group [26]. Similar results were observed in 2 studies by Mendonça et al. [2728], and 1 study by Fiolet et al. [29]. Based on these results, it is believed that the excessive consumption of ultra-processed foods can lead to a nutritional imbalance. Therefore, there is an urgent need for guidelines for the intake of processed foods by Korean adults.
Our data showed that higher percentages of energy from the intake of ultra-processed foods were associated with significantly higher blood levels of TG and TC. A previous study analyzed the relationship between the intake of ultra-processed foods, metabolic syndrome, and non-alcoholic liver disease in 789 Israeli adults aged between 40 and 70 undergoing health checkups. Consistent with our finding, the group with a higher percentage of energy from the intake of ultra-processed foods showed higher levels of TG relative to the group with a lower percentage of energy from the intake of ultra-processed foods [30]. Also, our results demonstrate that among the components of metabolic syndrome, intake of ultra-processed foods raised the odds of increased WC and hypertension. Specifically, previous large-scale studies in the US, Brazil, and Canada have reported similar findings with respect to WC [31]. Overall, an increase in WC may be closely related to the intake of ultra-processed foods. The literature on hypertension has been somewhat contradictory. In one cross-sectional study, there was no significant association between hypertension associated with metabolic syndrome and ultra-processed foods [32]. However, Mendonça et al. [28], who conducted a 9.1 yrs follow-up study on Spanish adults, noted that the hazard ratio for hypertension increased with an increase in the percentages of energy derived from the intake of ultra-processed foods. It, therefore, seems implicit here that the impact of the long-term intake of ultra-processed foods on the metabolic syndrome is closely associated with its individual components and specific measures for alleviating them are needed.
Ultra-processed foods are thought to contribute to an increased risk of metabolic syndrome. A higher intake of ultra-processed foods leads to higher consumption of total energy, fat, saturated fat, and added sugars. On the other hand, the intake of micronutrients and dietary fiber decreases, which increases the likelihood of a loss of mitochondrial function [233334].
In our study, the odds of the incidence of metabolic syndrome in the high ultra-processed foods intake group were analyzed and compared with that of the low ultra-processed foods intake group. In men, a low intake of ultra-processed foods lowered the odds of incidence of metabolic syndrome. On the other hand, in women, the consumption of ultra-processed foods did not appear to be associated with the incidence of metabolic syndrome or its individual components. Agodi et al. [35] analyzed the dietary patterns of adults aged 25–64 and found that men favored the intake of western dietary patterns comprising ultra-processed foods such as bread, deep-fried potatoes, hamburgers, and salty snacks. This was in turn associated with changes in the specific components of the metabolic syndrome, specifically elevated blood glucose and triglyceride levels, and blood pressure was seen [35]. In the study by Na et al. [36], among the dietary patterns of adult men aged 40–64, when the intake of convenience food comprising ramen, egg, and processed food was higher, the levels of TC and TG were higher. These results could be influenced by differences in dietary habits and lifestyles according to gender. Therefore, further research which performs a detailed evaluation of the differences in the intake amount and intake method of ultra-processed food between men and women is necessary.
This study analyzed the relationship between metabolic syndrome and the percentages of energy derived from the intake of ultra-processed foods in adults over the age of 19 based on the 2013–2018 KNHANES data. As this was a cross-sectional study, there were limitations to analyzing the causal relationship between metabolic syndrome and ultra-processed foods. In addition, as the study analyzed the foods consumed by subjects using the 24-h recall method, only the amount of food consumed by them during the day was reflected, and, therefore, the normal intake patterns were not reflected well. Moreover, the diet of those who had already been diagnosed and were taking medications could have been altered according to their condition. Nonetheless, the strength of this study lies in its use of large-scale Korean population data, and the NOVA classification system used to classify foods. Indeed, the present study’s findings will assist the general population in preventing metabolic syndrome by reducing their intake of ultra-processed foods, choosing healthier foods, and eating a more balanced diet.
 XML Download