

 PDF
PDF Citation
 Print
Print


INTRODUCTION
With the extension of lifespan and improving living standards, chronic metabolic diseases are increasing in prevalence in the developed world. Chronic metabolic disease is closely related to cardiovascular disease, the leading cause of death, and significant efforts have been undertaken to identify the causes of (and possible prevention measures for) the disease. Insulin resistance is one of the primary drivers of chronic metabolic diseases [12]. It is accelerated by obesity arising from imbalanced lifestyle habits such as excessive calorie intake and insufficient physical activity. In addition, the inflammation accompanying obesity accelerates the pathogenesis of chronic metabolic diseases by exacerbating insulin resistance [34].
In recent years, epigenetic regulation has been suggested as an important mechanism influencing the progression of various diseases including chronic metabolic diseases. Epigenetics refers to a phenomenon in which gene expression reversibly changes through DNA methylation, histone acetylation, and chromatin folding without changes to the DNA sequence [56]. Several studies have shown that the expression of genes related to obesity and type 2 diabetes, such as C/EBPβ, FTO, ADIPOq, GLUT4, and INS, are regulated by DNA methylation and/or histone acetylation [7891011]. In addition, epigenetic alterations in adipose tissue induced by obesity or a high-fat diet are known to upregulate inflammatory cytokine and chemokine gene expression [12]. Similarly, it has been suggested that oxidized low-density lipoprotein produced during lipid accumulation activates the inflammatory response of endothelial cells by inducing histone acetylation in the promoter regions of pro-inflammatory cytokines and chemokines, which can consequently induce atherosclerosis [13].
Epigenetic regulation is induced by diverse environmental factors such as aging, diet, inflammation, and toxic substances [56]. In addition, since it has been found that some diseases progress due to increasing DNA methylation or histone acetylation by various factors, interest in drugs and food materials that can alleviate these effects is increasing. Epigenetics remains an attractive area of study in the field of food research as it can instigate reversible changes in gene expression caused by foods and nutrients. DNA methylation is reportedly more stable and less reversible than histone acetylation due to the lack of a direct DNA demethylating enzyme [1415]. Therefore, the investigation of foods or nutrients that affect histone acetylation may be more accessible.
We sought to explore candidate substances that can prevent chronic metabolic diseases via epigenetic regulation, focusing on various nutrients known to be effective in disease prevention. Using an in vitro model, the effects of nutrients such as proteins, lipids, vitamins, and minerals on the inhibition of lipid accumulation and inflammation were investigated, while histone acetylation via histone acetyltransferase (HAT) was measured and correlations assessed.
MATERIALS AND METHODS
Materials
Histidine, isoleucine, leucine, methionine, phenylalanine, threonine, tryptophan, valine, arginine, cystine, glutamine, glycine, proline, tyrosine, alanine, asparagine, lysine, serine, arachidic acid, behenic acid, capric acid, caprylic acid, hexacosanoic acid, lauric acid, lignoceric acid, myristic acid, palmitic acid, stearic acid, arachidonic acid, conjugated (10E, 12Z)-linoleic acid solution (CLA 10E, 12Z), conjugated (9E, 11E)-linoleic acid (CLA 9E, 11E), cis-4, 7, 10, 13, 16, 19-docosahexaenoic acid (C22:6) (DHA), cis-5, 8, 11, 14, 17-eicosapentaenoic acid (C20:5) (EPA), erucic acid C22:1, linoleic acid, palmitoleic acid C16:1, sodium oleate C18:1, calcium carbonate, magnesium oxide, magnesium sulfate, potassium, chromium, copper, ferric citrate, fluoride, iodate, manganese, molybdate, selenite, zinc carbonate basic and zinc sulfate, lycopene, vitamin B1, vitamin B2, vitamin B3, vitamin B5, vitamin B6, vitamin B7, vitamin B9, vitamin B12, vitamin C, vitamin D2, 5,6-trans-vitamin D3, α-tocopherol, γ-CEHC, vitamin K1, vitamin K2 and vitamin K3 were purchased from Sigma-Aldrich (St. Louis, MO, USA). 11, 14, 17-Eicosatrienoic acid, alpha-linolenic acid C18:3, gamma-linolenic acid, all-trans retinoic acid, all-trans-retinal, 1,24-dihydroxyvitamin D3, 1, 25-dihydroxyvitamin D2, vitamin D3, vitamin D4, α-tocotrienol, α-CEHC, β-tocopherol, β-tocotrienol, γ-tocopherol, δ-CEHC, δ-tocopherol, δ-tocotrienol, and vitamin K4 were purchased from Cayman Chemical (Ann Arbor, MI, USA).
Nutrient selection and preparation of chemicals
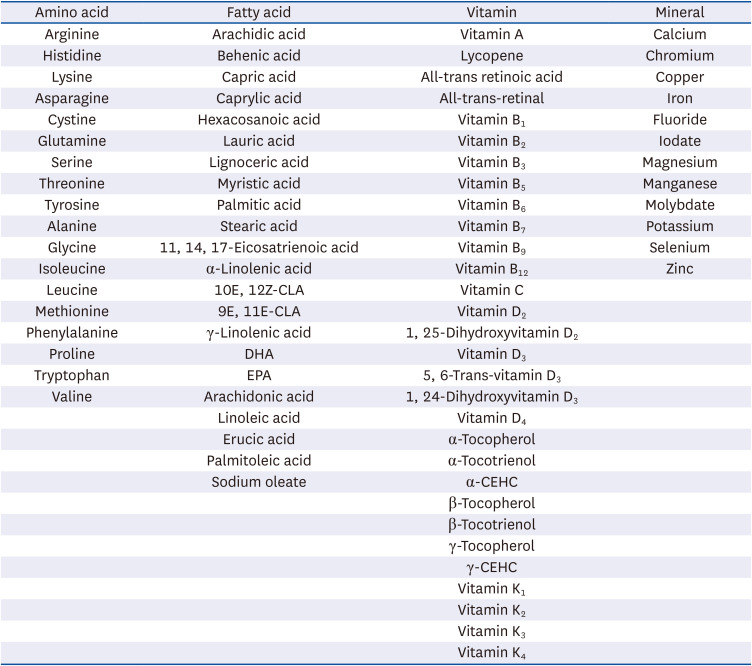
Eighty-five nutrients were selected following full review of the list of nutrients approved by the Korean Ministry of Food and Drug Safety as notified health functional foods after matching those found to potentially influence the regulation of HAT activity in various studies. Nutrients were classified into proteins (amino acids), lipids (fatty acids), vitamins, and minerals, with a total of 18, 22, 33, and 12 nutrients, respectively (listed in Table 1). All nutrient (and chemical) stocks were prepared by dissolving in ethanol, water, dimethyl sulfoxide (DMSO), chloroform, methanol, hydrochloric acid or bovine serum albumin (BSA) according to their solubility descriptions listed in the Material Safety Data Sheet.
Table 1
List of nutrients used in the present study
Mouse macrophage Raw264.7 cell culture and 3-(4,5-dimethyl-2-thiazolyl)-2,5-diphenyl-2H-tetrazolium bromide (MTT) assay
Mouse macrophage Raw264.7 cells and mouse hepatocyte AML-12 cells were obtained from the American Type Culture Collection (Manassas, VA, USA). Raw264.7 cells were cultured in Dulbecco’s modified Eagle’s medium (DMEM; WelGene Biopharmaceuticals, Daegu, Korea) at 37°C in a 5% CO2 atmosphere.
After confluence (up to 70–80%) was reached, Raw264.7 cells were seeded into 96-well plates (2.5 × 10⁵ cells/mL) and incubated with DMEM media for 24 h. Following washing with DPBS twice, the media was changed to fresh DMEM and treated simultaneously with lipopolysaccharide (LPS) (100 ng/mL) and selected nutrients (chemicals) at 50 μM and incubated for 24 h at 37°C in a 5% CO2 atmosphere. Then, MTT (Sigma-Aldrich) solution was added to the cells followed by an additional 2 h-incubation. Formazan was dissolved in 100 μL of DMSO, and absorbance was measured at 570 nm using a microspectrometer (Molecular Devices, Sunnyvale, CA, USA).
Mouse hepatocyte AML-12 cell culture and MTT assay
AML-12 cells were cultured in DMEM with 10% fetal bovine serum (FBS, WelGene Biopharmaceuticals), 1% Penicillin-Streptomycin (WelGene Biopharmaceuticals), 40 ng/mL dexamethasone (Sigma-Aldrich), and Insulin-Transferrin-Selenium-Sodium Pyruvate solution (Gibco, Waltham, MA, USA) at 37°C in a 5% CO2 atmosphere. AML-12 cells were incubated with 1 mg/mL MTT solution with 50 μM nutrients at 37°C in a 5% CO2 atmosphere. To evaluate cell viability, formazan was dissolved in 100 μL of DMSO, and absorbance was measured at 570 nm using a microspectrometer (Molecular Devices).
Lipid accumulation
To examine the inhibitory effect of nutrients on fatty acid-induced lipid accumulation, mouse hepatocyte AML-12 cells were treated with DMEM containing fatty acid free-BSA-conjugated oleic acid and palmitic acid, before 50 μM of nutrients were added for 16 h. After incubation, the cells were washed with phosphate-buffered saline and fixed with 3.7% paraformaldehyde for 30 min. The cells were washed with distilled water (DW) and stained with 0.1% oil red O solution (Sigma-Aldrich) at room temperature for 30 min, and washed again with DW. For lipid quantification, isopropanol was added to dissolve the dye stained in the lipid for 5 min before absorbance was measured at 506 nm using a microspectrometer (Molecular Devices).
Nitric oxide (NO) production
To assess the anti-inflammatory effect of the nutrients, mouse macrophage Raw264.7 cells were simultaneously treated with 50 μM nutrients and 100 ng/mL of LPS. After 24 h incubation, the medium was collected and NO production was measured using the Griess method (Promega Corporation, Madison, MI, USA). Acute treatment of LPS increases the production of NO via inducible NO synthesis activation thereby resulting inflammation [16]. Absorbance was measured at 540 nm using a microspectrometer (Molecular Devices).
In vitro HAT activity
HAT activity was evaluated using an assay kit (Biovision Biotechnology, Milpitas, CA, USA) with HeLa cell nuclear extracts (NEs; Biovision Biotechnology), according to the manufacturer’s protocol. To prepare the sample, 20 μg of NE was added to a 96-well plate, chemicals were added to a final concentration of 50 μM, and DW was added to adjust to a final volume of 40 μL. The assay mixture including substrate histone H3 tail (5 μL), cofactor acetyl-CoA (5 μL), NADH generating enzyme (8 μL) and 2×HAT assay buffer (50 μL) included in the assay kit, was added to each sample. The 96-well plate was then incubated at 37°C for 75 min, before the OD value was measured at a wavelength of 440 nm using a microplate reader (Molecular Devices).
Statistical analysis
Statistical analyses were performed using SPSS software, Version 20 (SPSS Inc., Chicago, IL, USA). Data are presented as mean ± SE. Mean difference values for the variables were evaluated by independent t-test or one-way analysis of variance with Bonferroni post hoc test. Correlations between lipid accumulation, NO production, and HAT activity were evaluated by Pearson’s correlation coefficients. A P-value of < 0.05 was considered statistically significant.
RESULTS
Effect of nutrients on cell viability
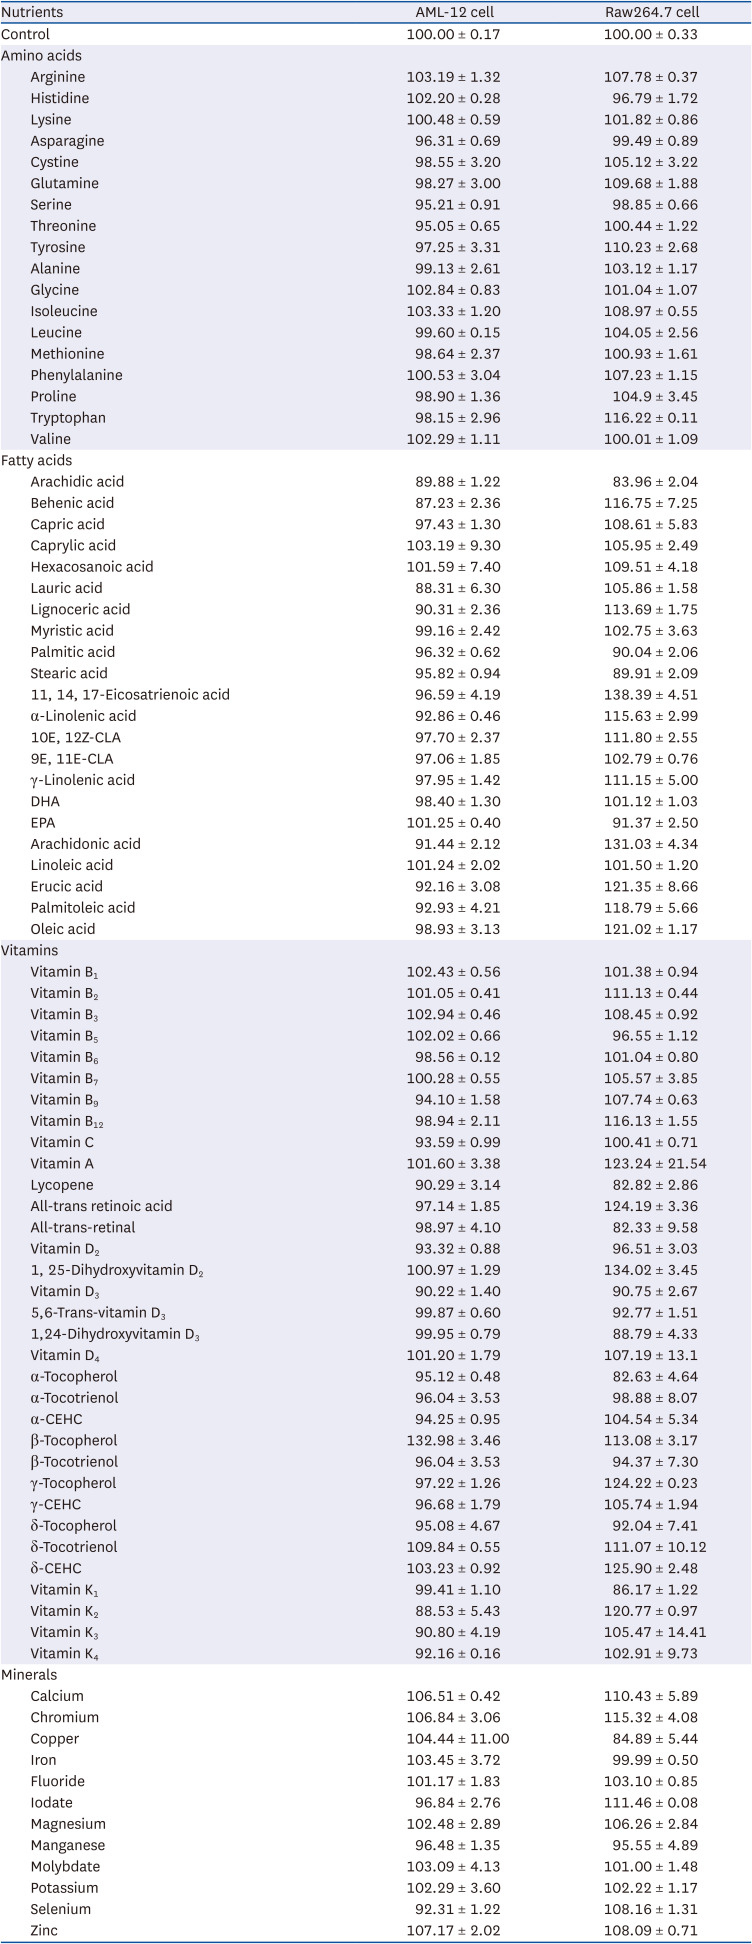
MTT assays were performed to evaluate the viability of cell lines including AML-12 and Raw264.7 in the presence of various nutrients. All nutrients (amino acids, fatty acids, vitamins and minerals) had no significant effect on the viability of the cell lines at 50 μM treatment (Table 2).
Table 2
Viability of the cells regulated by nutrients
Phenotypic and HAT activity regulation by nutrients
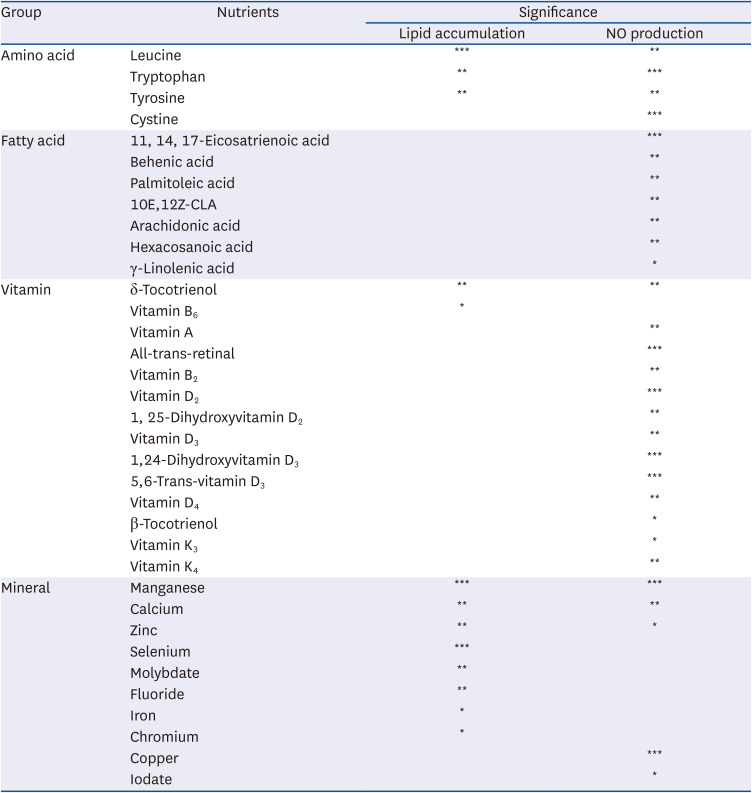
We first aimed to examine the influence of nutrients on epigenetic regulation during the development of nutrient and chemical-induced chronic diseases, including steatosis and inflammation. We examined whether each nutrient regulates oleic-palmitic acid (OPA)-induced lipid accumulation or LPS-mediated NO production in AML-12 and Raw264.7 cells, respectively. The inhibitory effects of the selected nutrients on HAT activity were also examined. OPA significantly increased lipid accumulation (P < 0.001; Fig. 1A), which was in turn significantly reduced in the presence of nutrients, amino acids and minerals (P < 0.001; Fig. 1A). OPA-mediated lipid accumulation was significantly increased by the fatty acids group (P < 0.001). Vitamins did not affect OPA-mediated lipid accumulation (Fig. 1A). Meanwhile, LPS (100 ng/mL) treatment increased NO production by 2-fold (P < 0.001; Fig. 1B). LPS-mediated NO overproduction was significantly decreased by amino acids (P < 0.05), vitamins (P < 0.001), and minerals (P < 0.05) while the fatty acids group did not exhibit any significant reduction in Raw264.7 cells (Fig. 1B). Individual nutrients mitigating lipid accumulation and NO production are listed in Table 3 with statistical significance. In addition, all nutrients including amino acids (P < 0.01), fatty acids (P < 0.001), vitamins (P < 0.001) and minerals (P < 0.01) significantly inhibited HAT activity. Of particular note, the minerals tested inhibited HAT activity almost completely (Fig. 1C).
Fig. 1
Effect of nutrients on lipid accumulation (A), NO production (B), and HAT activity (C), visualized by heatmap (D). (A) Lipid accumulation was measured by ORO staining and quantification in OPA-treated AML-12 cells. ‘(B) NO production was measured using Griess reagent in LPS-treated Raw264.7 macrophage cells. (C) In vitro HAT activity was measured using a commercially-available kit.
NO, nitric oxide; HAT, histone acetyltransferase; ORO, oil red O; NC, normal control; OPA, oleic-palmitic acid; LPS, lipopolysaccharide; PC, positive control; NE, nuclear extract.
***P < 0.001: significant difference between (A) NC and OPA, (B) NC and LPS. ##P < 0.01, ###P < 0.001: significant difference between (A) OPA and OPA with nutrients treatment, (B) LPS and LPS with nutrients treatment, (C) NE and NE with nutrients treatment.
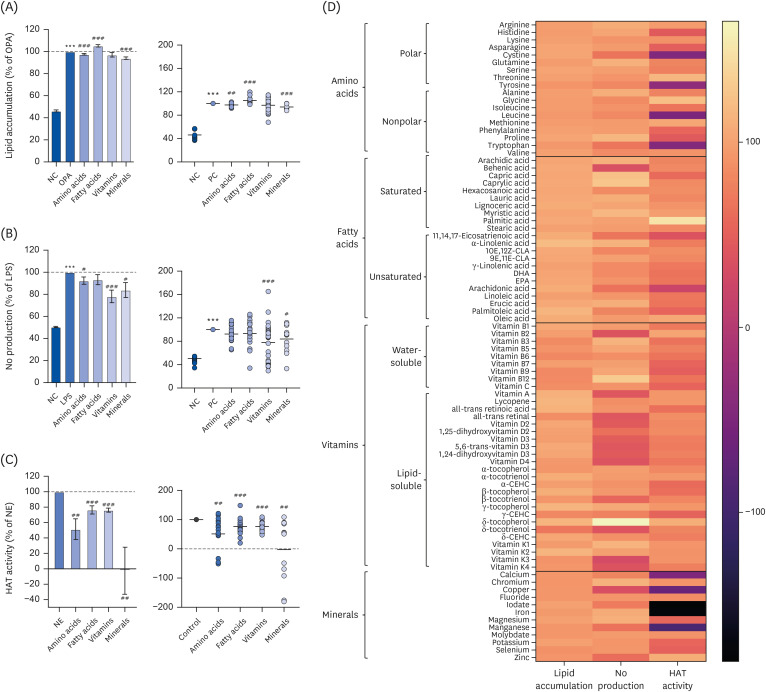
Table 3
List of nutrients effective in inhibiting lipid accumulation and NO production
The regulatory effects of individual nutrients against lipid accumulation, NO production, and HAT activity were visualized with a heatmap (Fig. 1D). Nutrients, amino acids, fatty acids, and vitamins were categorized into 2 groups. Amino acids were categorized as polar or nonpolar. Fatty acids were categorized as saturated or unsaturated. Vitamins were categorized as water-soluble or lipid-soluble. There was no remarkable pattern or relationship between the polar or nonpolar amino acids and each experimental marker (lipid accumulation, NO production, or HAT activity). Interestingly, NO production and HAT activity mediated by saturated and unsaturated fatty acids exhibited significant differences (Fig. 1D). In addition, it appears that NO production and lipid accumulation/HAT regulatory patterns were regulated inversely by water-soluble vitamins and lipid-soluble vitamins (Fig. 1D). It was observed that each mineral regulated lipid accumulation, NO production, and HAT activity independently (Fig. 1D).
Amino acid-mediated phenotype changes and correlations
We next aimed to further examine phenotype regulation and correlations with each nutrient type and their subgroups. Subgroup analysis was performed to verify the difference in inhibitory effects in relation to amino acid polarity. OPA-induced lipid accumulation was significantly reduced by total and nonpolar amino acids including alanine, glycine, isoleucine, leucine, methionine, phenylalanine, proline, tryptophan, and valine (P < 0.01), but not by the polar amino acids (Fig. 2A). This indicates that amino acid-mediated reductions in lipid accumulation were likely attributable to nonpolar amino acids in the OPA-treated AML-12 cells (Fig. 2A). While LPS-mediated increases in NO production were significantly reduced by total amino acids only in the Raw264.7 cells (P < 0.05), NE-mediated increased HAT activity was significantly reduced by total amino acids (P < 0.01), which was likely attributable to both polar and nonpolar amino acids (P < 0.05; Fig. 2A).
Fig. 2
Lipid accumulation, NO production, and HAT activity (A) were evaluated and compared in terms of total, polar, and non-polar amino acid groups. All experiments were performed in triplicate and correlation analysis was performed (B-D). Correlation between lipid accumulation and NO production (B), lipid accumulation and HAT activity (C), and NO production and HAT activity (D) regulated by total amino acids.
NO, nitric oxide; HAT, histone acetyltransferase; NC, normal control; OPA, oleic-palmitic acid; LPS, lipopolysaccharide; PC, positive control.
***P < 0.001: significant difference between the NC and PC (either OPA or LPS treatment). #
P < 0.05, ##
P < 0.01: significant difference between PC and amino acid treatment.
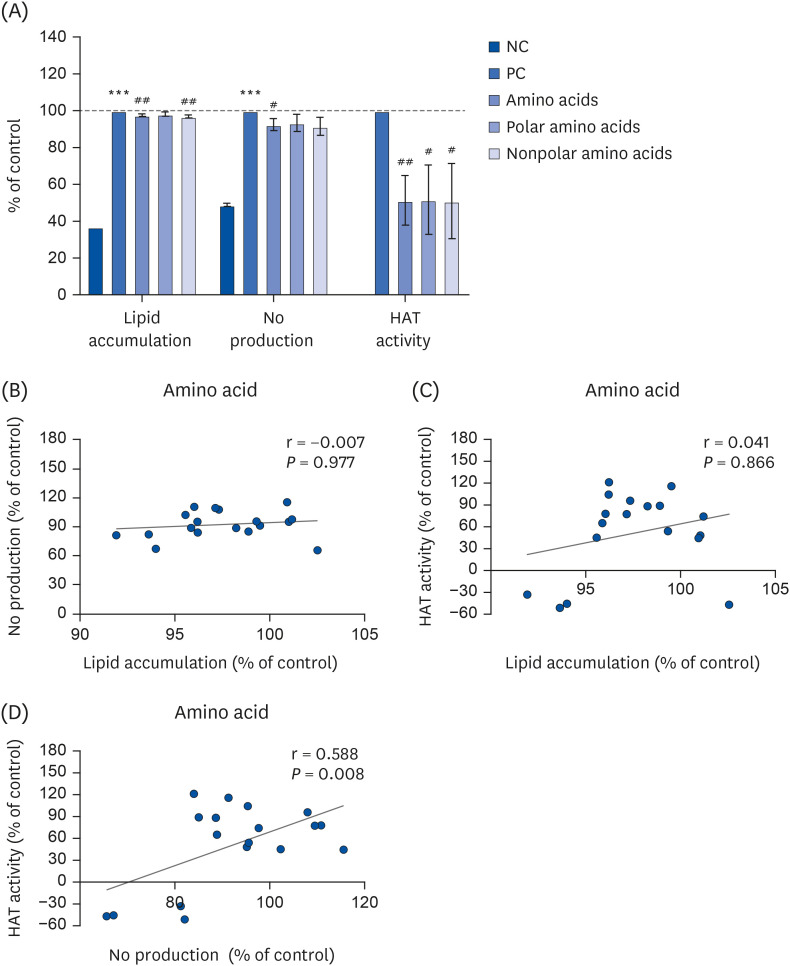
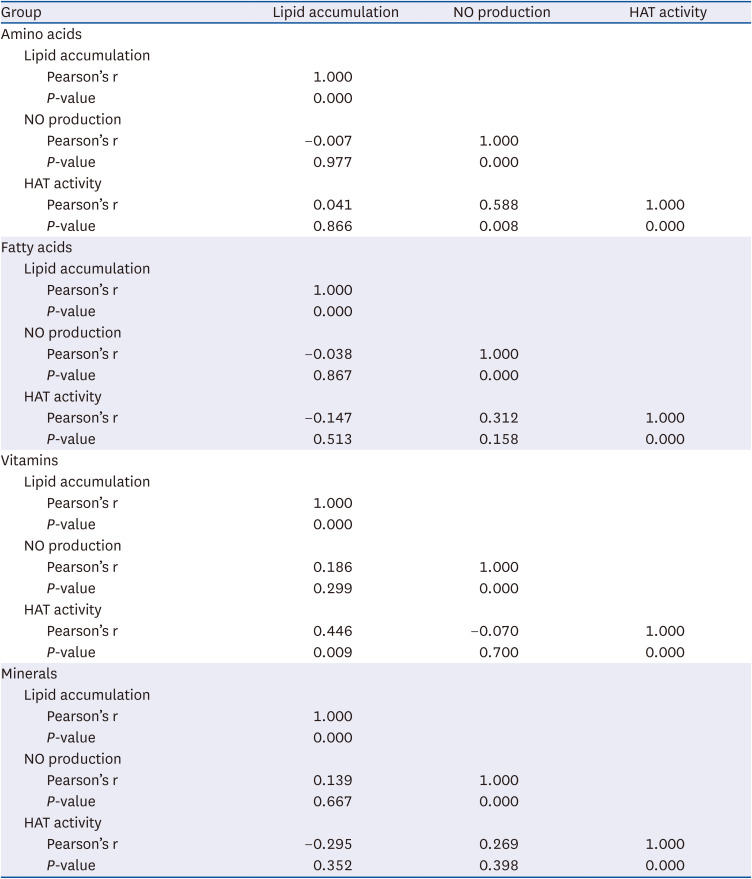
Further, we examined the correlation between lipid accumulation and HAT, NO production and HAT activity, and lipid accumulation and NO production regulated by total amino acids. Correlative evidence was not observed between lipid accumulation and NO production or HAT activity (Fig. 2B and C). A positive correlation between NO production and HAT activity in the presence of total amino acids further suggests that NO-mediated inflammatory responses are possibly attributable to increased HAT activity, which can be regulated by the amino acids group (P < 0.01; Fig. 2D, Table 4).
Table 4
Pearson correlation matrix for evaluation markers
Fatty acid-mediated phenotype changes and correlations
Fatty acid subgroup analysis was also performed in the presence or absence of those featuring double bonds. Total, saturated, and unsaturated fatty acids increased OPA-mediated lipid accumulation in AML-12 cells (Fig. 3A). As a result, all of total, saturated, and unsaturated fatty acids all increased OPA-mediated lipid accumulation significantly (P < 0.001, P < 0.001, P < 0.01). Meanwhile, LPS-mediated NO production was significantly reduced by total fatty acids (P < 0.05), which was likely attributable to the unsaturated fatty acids (Fig. 3A). HAT activity was also significantly reduced by total, saturated, and unsaturated fatty acids (P < 0.01, P < 0.05, P < 0.05, respectively; Fig. 3A).
Fig. 3
Lipid accumulation, NO production, and HAT activity (A) were evaluated and compared in terms of total, saturated, and unsaturated fatty acid groups. All experiments were performed in triplicate. Correlation analysis was performed (B-E). Correlation between lipid accumulation and NO production (B), lipid accumulation and HAT activity (C), and NO production and HAT activity (D) regulated by total fatty acids. Correlation between NO production and HAT activity regulated by unsaturated fatty acids (E).
NO, nitric oxide; HAT, histone acetyltransferase; NC, normal control; OPA, oleic-palmitic acid; LPS, lipopolysaccharide; PC, positive control.
***P < 0.001: significant difference between NC and PC (either OPA or LPS treatment). #P < 0.05, ##P < 0.01: significant difference between PC and fatty acid treatment.
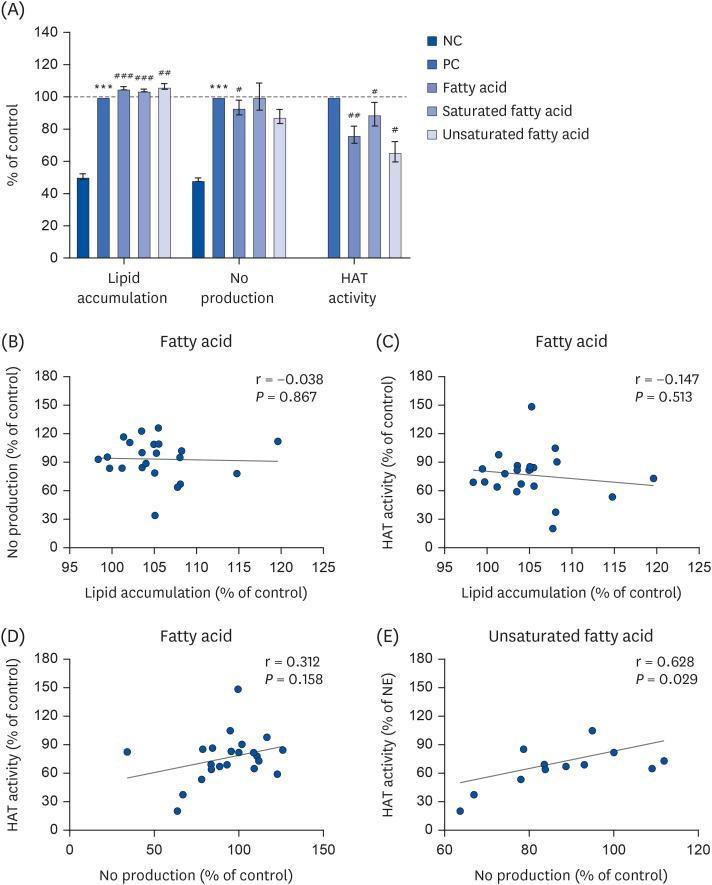
Correlation analysis indicated that there were no fatty acid-mediated significant correlations between lipid accumulation and NO production or HAT activity (Fig. 3B and C, Table 4). Although total fatty acid-mediated NO production was not significantly correlated with HAT activity (Fig. 3D), unsaturated fatty acid-mediated NO production was positively associated with HAT activity, suggesting that unsaturated fatty acid-induced increased NO production could be mediated by HAT inhibition (P < 0.05; Fig. 3).
Phenotype changes and correlations regulated by vitamins
Vitamins were categorized into the water-soluble vitamins including the B groups and C, as well as lipid-soluble vitamins including the vitamin A, D, E, and K groups. Total vitamins significantly attenuated OPA-induced lipid accumulation and LPS-mediated NO production in cell models, as well as in vitro HAT activity (P < 0.01, P < 0.001, P < 0.001, respectively; Fig. 4A). Vitamin-mediated reductions in NO production were attributable to the lipid-soluble vitamins (Fig. 4A, middle panel), and vitamin-mediated HAT inhibition was attributable to both water- and lipid-soluble vitamins (Fig. 4A, right panel).
Fig. 4
Lipid accumulation, NO production, and HAT activity (A) were evaluated and compared in terms of total, water soluble and lipid soluble vitamins. All experiments were performed in triplicate. Correlation analysis was performed (B-D). Correlation between lipid accumulation and HAT activity (B), NO production and HAT activity (C), and lipid accumulation and NO production (D) regulated by total vitamins.
NO, nitric oxide; HAT, histone acetyltransferase; NC, normal control; OPA, oleic-palmitic acid; LPS, lipopolysaccharide; PC, positive control.
***P < 0.001: significant difference between the NC and PC (either OPA or LPS treatment). #P < 0.05, ##P < 0.01: significant difference between PC and vitamin treatment.
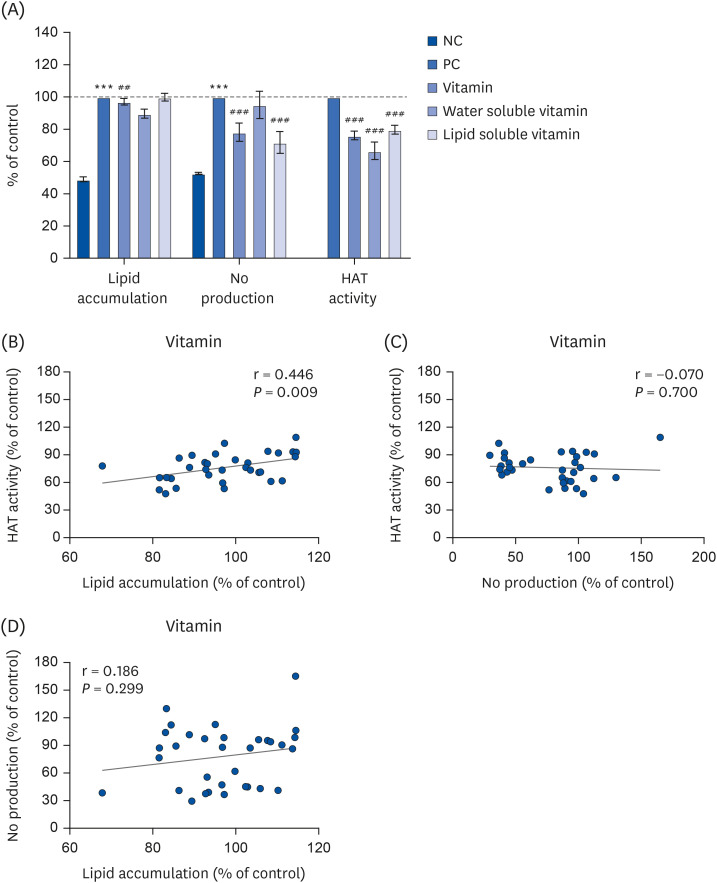
A positive correlation was observed between lipid accumulation and HAT activity regulated by total vitamins (P < 0.01; Fig. 4B, Table 4). This correlative evidence suggests that HAT inhibition possibly contributed to the reduction of lipid accumulation in the presence of vitamins. We further observed that NO production and HAT activity and lipid accumulation and NO production were not significantly influenced by either total or subgroup vitamins (Fig. 4C and D).
Phenotype changes and correlations regulated by minerals
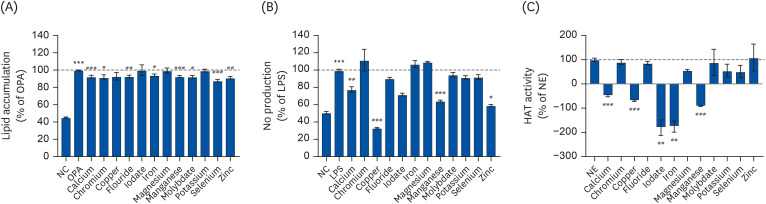
Phenotype differences and correlations influenced by individual minerals were analyzed. Calcium, chromium, fluoride, iron, magnesium, molybdate, selenium, and zinc treatments (50 μM) significantly attenuated OPA-mediated lipid accumulation in AML-12 cells (P < 0.05; Fig. 5A, Table 3). Treatment (50 μM) with calcium, copper, manganese, and zinc resulted in LPS-induced NO production inhibition, suggesting the possibility of anti-inflammatory activity of these nutrients (Fig. 5B, Table 3). In addition, calcium, copper, iodate, iron, and manganese acted as HAT inhibitors (P < 0.05; Fig. 5C). Calcium and manganese were the only minerals observed to alleviate lipid accumulation, inflammation, and HAT activity (Fig. 5).
Fig. 5
Lipid accumulation (A), NO production (B), and HAT activity (C) regulated by individual minerals. (A) Lipid accumulation was measured by ORO staining and quantification in OPA-treated AML-12 cells. (B) NO production was measured using Griess reagent in LPS-treated Raw264.7 macrophage cells. (C) In vitro HAT activity was measured using a commercially-available kit. All experiments were performed in triplicate.
NO, nitric oxide; HAT, histone acetyltransferase; ORO, oil red O; NC, normal control; OPA, oleic-palmitic acid; LPS, lipopolysaccharide; PC, positive control; NE, nuclear extract.
***P < 0.001: significant difference between (A) NC and OPA, (B) NC and LPS. #P < 0.05, ##P < 0.01, ###P < 0.001: significant difference between (A) OPA and OPA with minerals treatment, (B) LPS and LPS with minerals treatment, (C) NE and NE with individual mineral treatment.
Correlation analysis indicated that there were no minerals-mediated significant correlations between lipid accumulation and NO production or HAT activity (Table 4).
DISCUSSION
In the present study, we sought to examine physiological and epigenetic regulation by various nutrients and analyzed correlations between them. Correlative evidence indicates that NO production is associated with HAT activity, which can be regulated by amino acids. This suggests that amino acids possibly contribute to the attenuation of NO production via inhibition of HAT activity, for which further investigation is needed. Among the fatty acid family, unsaturated fatty acids did not attenuate lipid accumulation, but tended to reduce the inflammatory response via inhibition of NO production, which was likely attributable to HAT activity inhibition. Although there was no significant correlation observed between lipid-soluble vitamins and phenotype regulation, compared to the water-soluble vitamins, the lipid-soluble vitamins significantly reduced NO production. Water- and lipid-soluble vitamins both exhibited significant inhibitory activities against HAT. Among the individual minerals, calcium and manganese significantly inhibited lipid accumulation, NO production, and HAT activity, suggesting possible new functionalities for these specific nutrients via epigenetic regulation. Further studies are warranted.
Several classes of nutrients have been well studied for their functionality. In the case of amino acids, the lipid accumulation inhibitory effect could not be confirmed in this study, although several studies have shown that there is an effect of reducing body fat by increasing energy expenditure via the preservation of fat free mass and stimulating the secretion of satiety hormones [171819]. In a clinical trial evaluating the effect of a high-protein diet in patients with nonalcoholic fatty liver disease, liver fat, insulin resistance, and inflammatory markers were improved [20]. The lipid-lowering and anti-inflammatory effects of polyunsaturated fatty acids (PUFAs) have been reported in numerous studies. N-3 and n-6 PUFA are effective in reducing levels of triglycerides and cholesterols [212223]. In this study, arachidonic acid, an n-6 PUFA, had a significant inhibitory effect on NO production, although arachidonic acid undergoes a metabolic process to produce eicosanoids that mediate the inflammatory response. It has been reported that n-3 PUFA attenuates the inflammatory response by reducing the production of eicosanoids and inhibiting the secretion of inflammatory cytokines such as TNF-α, IL-1, and IL-6 [2124]. Therefore, it may be beneficial to consume a balanced diet containing both n-3 and n-6 PUFA [2526]. Vitamins and minerals are effective in preventing aging and disease progression due to their excellent antioxidative and immunomodulating effects. As shown in our study, the anti-inflammatory effects of various lipid-soluble vitamins have been investigated [27282930], and they have also been reported to facilitate the metabolism of unsaturated fatty acids by inhibiting lipid oxidation [31]. Minerals are also known to play a variety of roles in human metabolism, and the role of calcium in lipid metabolism is particularly well-established. In preclinical models, calcium increases lipase activity and improves lipid profiles via inhibition of cholesterol absorption/synthesis and fatty acid oxidation-related gene expression [3233].
Nutrients play diverse roles in the human body and influence epigenetic changes throughout life. This was evidenced in the Dutch Hunger Winter tragedy (1944–1945), with researchers finding that individuals who were prenatally exposed to starvation exhibited lower DNA methylation of the imprinted IGF2 gene compared to their healthy same-sex siblings [34], leading to obesity, diabetes, and heart disease in later life. Of the environmental factors, nutrients as well as polyphenols act as important epigenetic regulators affecting disease progression. It has been demonstrated that methyl donor nutrients, including vitamin B12, folate, choline, betaine, and methionine can influence metabolic diseases, including obesity, insulin resistance, or steatosis via DNA or histone methylation [35363738]. The fatty acids family, including EPA, DHA, and butyrate acetate propionate also affect n-6 and n-3 fatty acid metabolism, as well as inflammation via DNA methylation and histone acetylation [39404142]. In addition, vitamins such as retinol, tocopherols, and ascorbate impact the antioxidant process via histone acetylation and DNA methylation [404344]. Of particular note, minor nutrient-mediated DNA methylation is primarily modified by the folate-methionine cycle. During the methionine cycle, methyl donor nutrients act as precursors for the synthesis of S-adenosyl methionine (SAM) present in the diet [4546]. The deficiency of these methyl donor nutrients cause DNA hypomethylation, and inversely, donor nutrient consumption increases DNA methylation. Increased SAM accumulation in the body can cause a number of chronic diseases including cardiovascular diseases, cancers and Alzheimer’s disease [47].
A number of animal studies have found that specific nutrient deficiency or excessive levels can cause a range of diseases via epigenetic dysregulation. For instance, calorie restriction causes increased SIRT1 expression (sirtuins are histone deacetylases (HDACs) that mediate lysine deacetylation via NAD hydrolysis) in a tissue-specific manner in mice [48]. In addition, diets with a specific nutrient profile, such as high fat or low protein diets influence multiple nutrient sensing pathways via histone modification [4950]. Deficiency in the amino acid glutamine, which is needed to support cancer cell survival and proliferation [51] in tumor core regions, causes histone hypermethylation thereby leading to de-differentiation and drug resistance [52]. Methionine deficiency has also been shown to influence steatosis and nonalcoholic steatohepatitis (NASH) [53545556]. Pogribny et al. [57], demonstrated that a lipogenic methyl deficiency diet causes NASH, evidenced by profoundly reduced DNMT1 expression and loss of histone H3K27 and H4K20 trimethylation in 2 different mouse strains. Gut microbiota produced short-chain fatty acids, including acetate, propionate, and butyrate. Butyrate is a known inhibitor of HDAC, leading to the inhibition of cancer growth [58]. The present study found that unsaturated fatty acids more strongly inhibited HAT activity compared to the saturated fatty acids, and a significant correlation was observed between NO production and HAT activity that was mediated by unsaturated fatty acids.
To the best of our knowledge, the current study is the first to examine and compare epigenetic as well as physiologic regulation by various nutrients with a correlation analysis of subgroups of the nutrient families. Our findings suggest possible health benefits for amino acids, and lipid-soluble vitamins (vitamin A, D, E & their metabolites, K) considering models of inflammation-related diseases via HAT regulation. The present study was aimed to find relationship between HAT and NO, HAT and lipid accumulation regulated by various nutrient components. Several nutrients that effectively regulate HAT-NO or HAT-lipid accumulation were selected for this study. Further studies are therefore warranted to investigate the epigenetic regulation and related mechanisms of metabolic processes elicited by vitamins and specific minerals, including calcium and manganese.
 XML Download