Abstract
Background
Development of an accessible method to routinely evaluate the clonality of strains is needed in microbiology laboratories. We compared the discriminatory power of the Fourier-transform infrared (FTIR) spectroscopy–based IR Biotyper (Bruker Daltonics GmbH, Bremen, Germany) to matrix-assisted laser desorption/ionization time-of-flight mass spectrometry (MALDI-TOF MS), using whole-genome sequencing (WGS) as the reference method.
Methods
Eighty-three extended-spectrum β-lactamase–producing Escherichia coli isolates were tested using WGS, MALDI-TOF MS, and IR Biotyper. Simpson’s diversity index (SDI), a statistical analysis for testing the homogeneity of a dendrogram, and the adjusted Rand index (aRI) were used to compare the discriminatory ability between typing tests.
Results
The SDI (95% confidence interval) was 0.969 (0.952–0.985) for WGS, 0.865 (0.807–0.924) for MALDI-TOF MS, and 0.974 (0.965–0.983) for IR Biotyper. Compared with WGS, IR Biotyper showed compatible diversity, whereas MALDI-TOF MS did not. The concordance and aRI improved from 66.3% to 84.3% and from 0.173 to 0.538, respectively, for IR Biotyper versus MALDI-TOF MS with WGS as the reference method. IR Biotyper showed substantially improved performance in strain typing compared with MALDI-TOF MS.
Conclusions
IR Biotyper is useful for diversity analysis with improved discriminatory power over MALDI-TOF MS in comparison with WGS as a reference method. IR Biotyper is an accessible method to evaluate the clonality of strains and could be applied in epidemiological analysis during an outbreak of a health care facility, as well as for research on the transmission of resistant bacteria in community settings.
Strain typing can be used to evaluate the relatedness of clinical isolates. Pulsed-field gel electrophoresis (PFGE), multi-locus sequence typing (MLST), and whole-genome sequencing (WGS) are well-established typing methods in microbiology laboratories [1, 2], but have important limitations. PFGE is generally labor-intensive, time-consuming, and lacks reproducibility. Although MLST has excellent reproducibility, it is expensive and limited to applicable strains [1]. WGS is also limited for routine use because of its high cost and requirement of skilled researchers [2]. Matrix-assisted laser desorption/ionization time-of-flight mass spectrometry (MALDI-TOF MS) is a routine method for species identification; however, a dendrogram based on main spectrum projection has also been suggested as a possible strain-typing method [3-5]. Recently, IR Biotyper (Bruker Daltonics GmbH, Bremen, Germany) was introduced to distinguish strains by quantifying the absorption of infrared light by lipids, nucleic acids, proteins, carbohydrates, and lipopolysaccharides from bacterial cell walls [6]. IR Biotyper uses protein fingerprints to supplement MALDI-TOF MS [7].
A simple and easy detection method is needed in the assessment of an outbreak in a healthcare facility or in investigating the source of antibiotic resistance genes. MALDI-TOF MS or IR Biotyper are good candidates for routine use in microbiology laboratories. To recommend a routine method for evaluating the clonality of strains, we compared the discriminatory power of IR Biotyper or MALDI-TOF MS with that of WGS as the reference method. To our knowledge, there are limited studies assessing strain typing methods using the etiologic agents of healthcare-associated infections. This is the first study to evaluate the discriminatory ability of IR Biotyper using community-origin strains.
Eighty-three extended-spectrum β-lactamase–producing Escherichia coli (ESBL-EC) isolates were included in this study. They were isolated from poultry (N=37), the poultry farm environment (N=6), slaughtered chicken meat (N=17), a slaughterhouse worker (N=1), the slaughterhouse environment (N=7), chicken meat on sale (N=14), and the retail shop environment (N=1) from January to August 2019 during a project conducted in collaboration with the Korean Centers for Disease Control and Prevention [8]. Informed consent was obtained from the slaughterhouse worker for sample collection and analysis. This study was exempted from approval review according to the Institutional Review Board of the National Health Insurance Service Ilsan Hospital, Goyang, Korea (NHIMC 2022-04-020).
DNA from freshly subcultured isolates was extracted using GenElute Bacterial Genomic DNA Kit (Sigma-Aldrich, St. Louis, MO, USA), and 8 μg of input genomic DNA was used for WGS. The entire genomes of the ESBL-EC isolates were sequenced using a NextSeq 550 instrument (Illumina, San Diego, CA, USA). Sequences were assembled using Spades (version 3.11.1) [9] and annotated using Prokka (version 1.13.7) [10]. Core-genome MLST (cgMLST) was performed using the online tool of the Center for Genomic Epidemiology [11]. A dendrogram using cgMLST was obtained from WGS data with a single linkage, and the Euclidean similarity index was calculated in PAST (version 4.03) [12].
Isolates freshly cultured at 37°C for 18–24 hours in MacConkey agar were used after ethanol-formic acid extraction. MALDI-TOF MS covered the region of 2,165–18,869 m/z. FlexControl 3.3 software was used for analysis [13]. Spectra were obtained using the Biotyper Main Spectrum (MSP) identification standard method (2,000–20,000 Da, linear positive method) and edited using Flex Analysis 3.4 software (Bruker Daltonics). The mass spectra were edited using MALDI Biotyper 2.0 software (Bruker Daltonics), including MATLAB 7.1. Principal component analysis (PCA) and hierarchical cluster analysis were performed, and a PCA dendrogram was created. The dendrogram reflects the inter-relational proximity of organisms at any distance. The distance measure was calculated based on the average Euclidean distance and linkage algorithm. Only strains with a distance of more than 2.0 in the dendrogram were included for further analysis.
Isolates were cultured on Muller–Hinton medium (Thermo Fisher Scientific, Hampshire, UK) at 37°C for 18 hours because the IR Biotyper method requires that the samples are grown under identical conditions as much as possible. The culture isolates were tested three times. Colonies were selected and 1 μL of the colony was mixed well in a suspension vial containing 70% ethanol (50 μL), followed by the addition of 50 μL distilled water and mixing for 10 minutes. Three spots (15 μL each) were loaded onto a microtiter plate. The completely dried plate was mounted on the IR Biotyper system and inspected. A dendrogram was created with the raw data to cluster the separation spectrum. The cut-off value (COV) on the dendrogram was automatically calculated using OPUS 7.5 software [14]. The distance matrix based on the average Euclidean distance and linkage algorithm reflects the separation distances of all strains.
Simpson’s diversity index (SDI) and the adjusted Rand index (aRI) were used for comparison of the analytical performance of MALDI-TOF, IR Biotyper, and WGS. These indices were calculated using the online Comparing Partitions tool (www.comparingpartitions.info) [15]. The SDI represents the probability of two randomly extracted strains from a population belonging to two types [16]; the values ranges from 0 (no diversity) to 1 (infinite diversity). The SDI was calculated separately for the results obtained from MALDI-TOF, IR Biotyper, and WGS.
The Rand index (RI) quantitatively evaluates the overall consistency between two divisions [17]. There is a high possibility that good values will emerge even when random clustering is performed. To solve this problem, the aRI was developed to subtract the expected value of the RI from the original value and readjust the expected value and variance. In the case of random clustering, the aRI has a high probability of zero. Concordance and aRI of MALDI-TOF or IR Biotyper were calculated and compared with those of WGS.
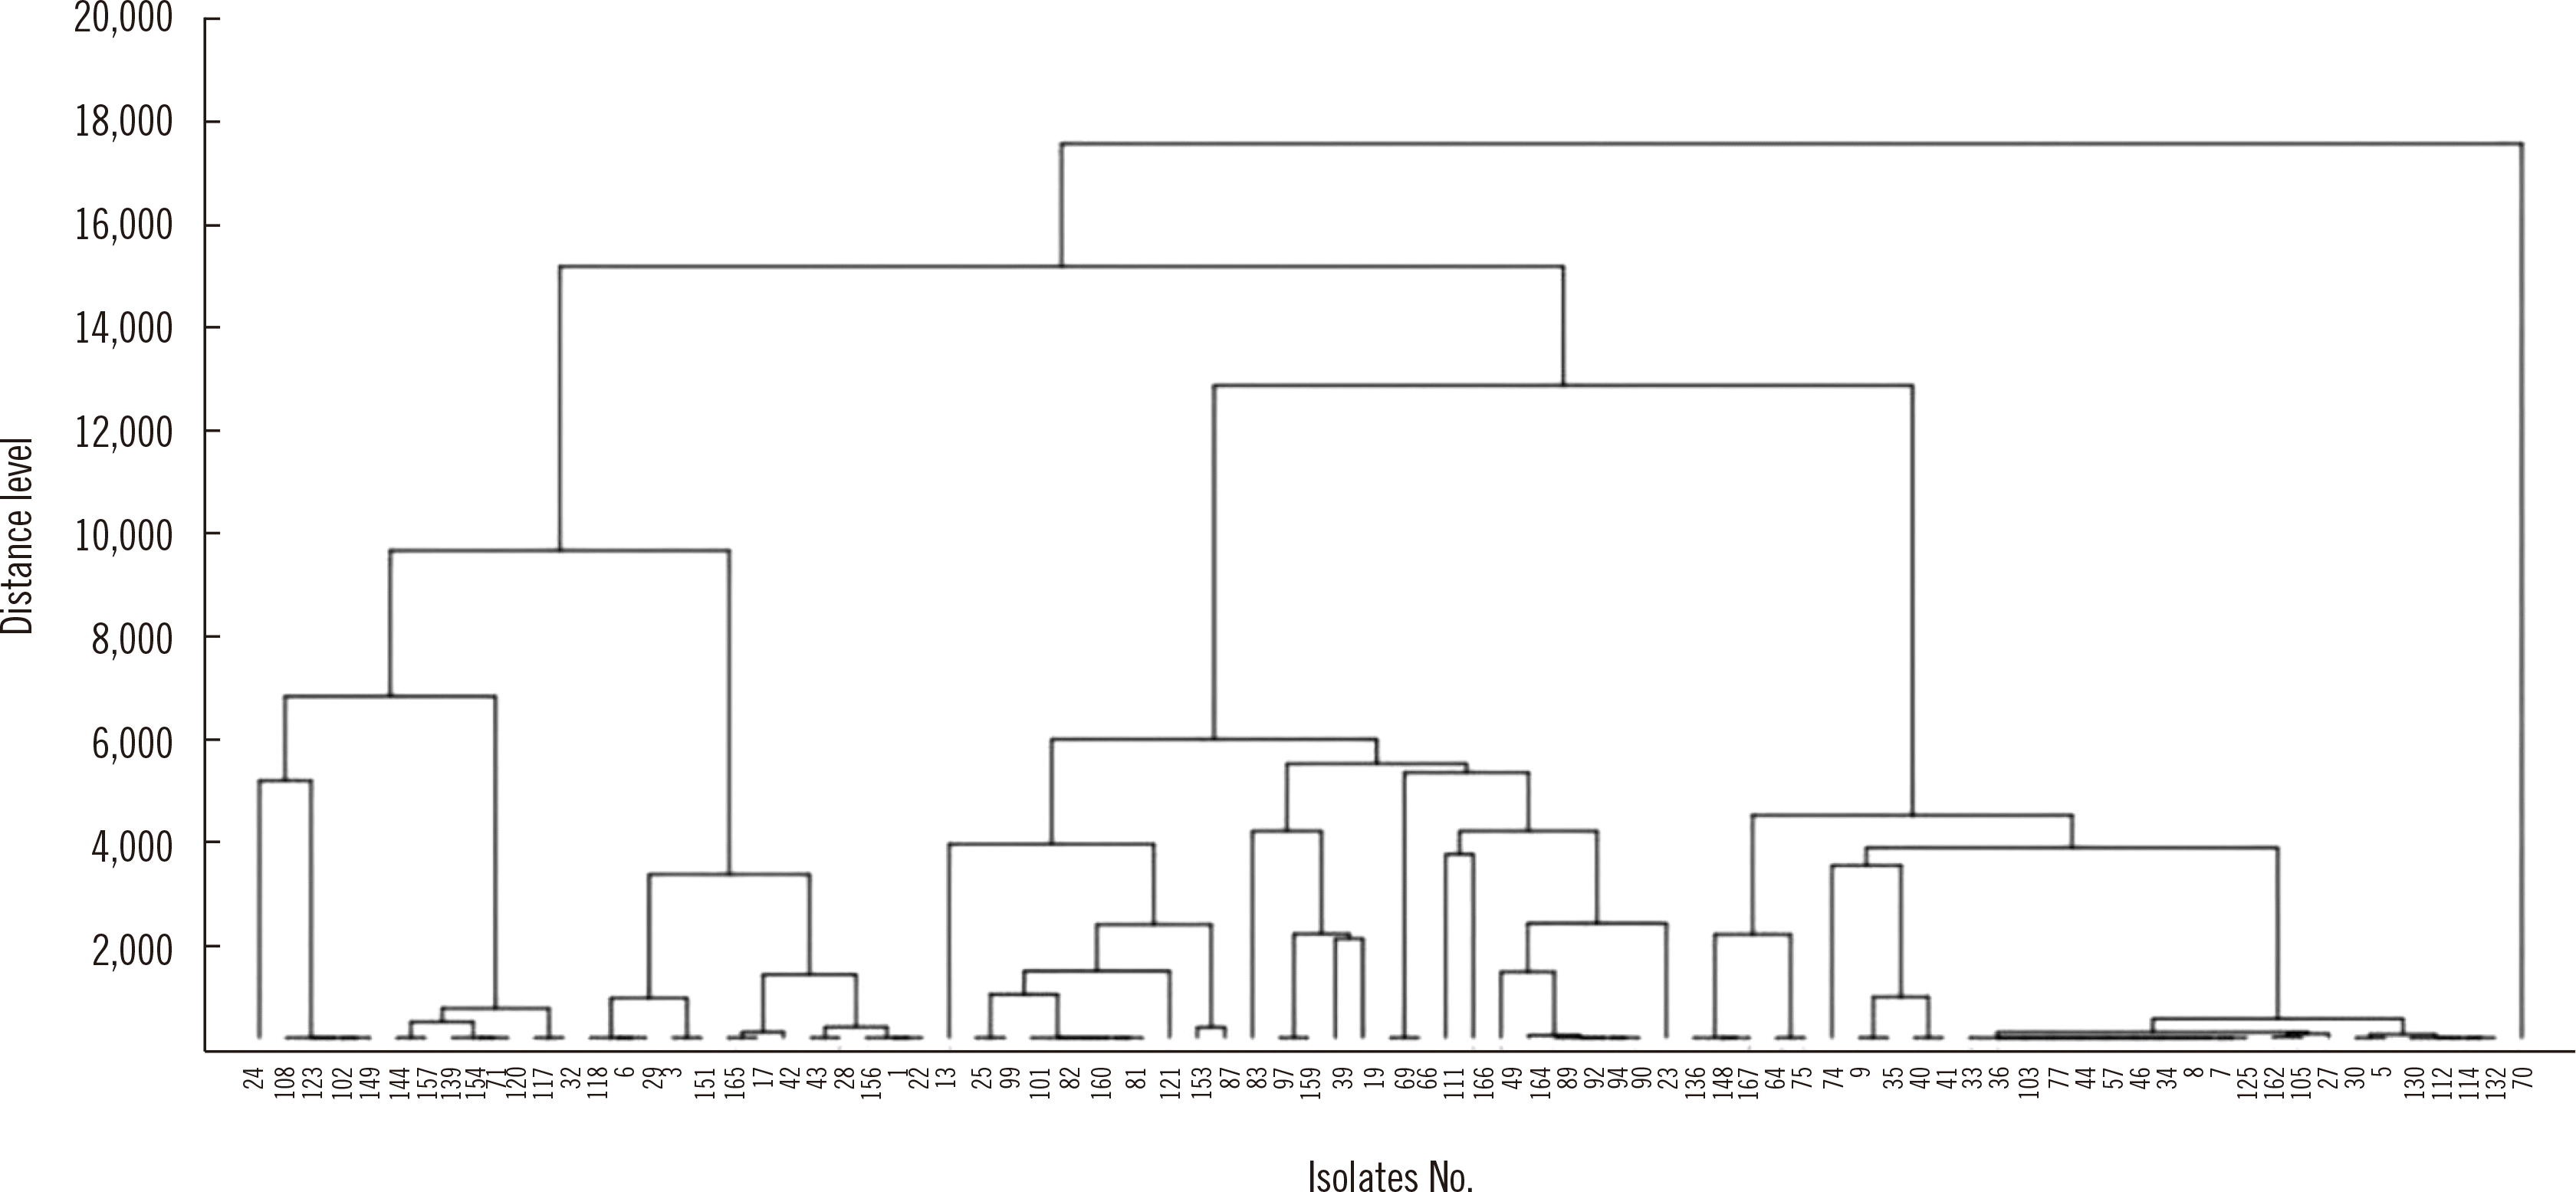
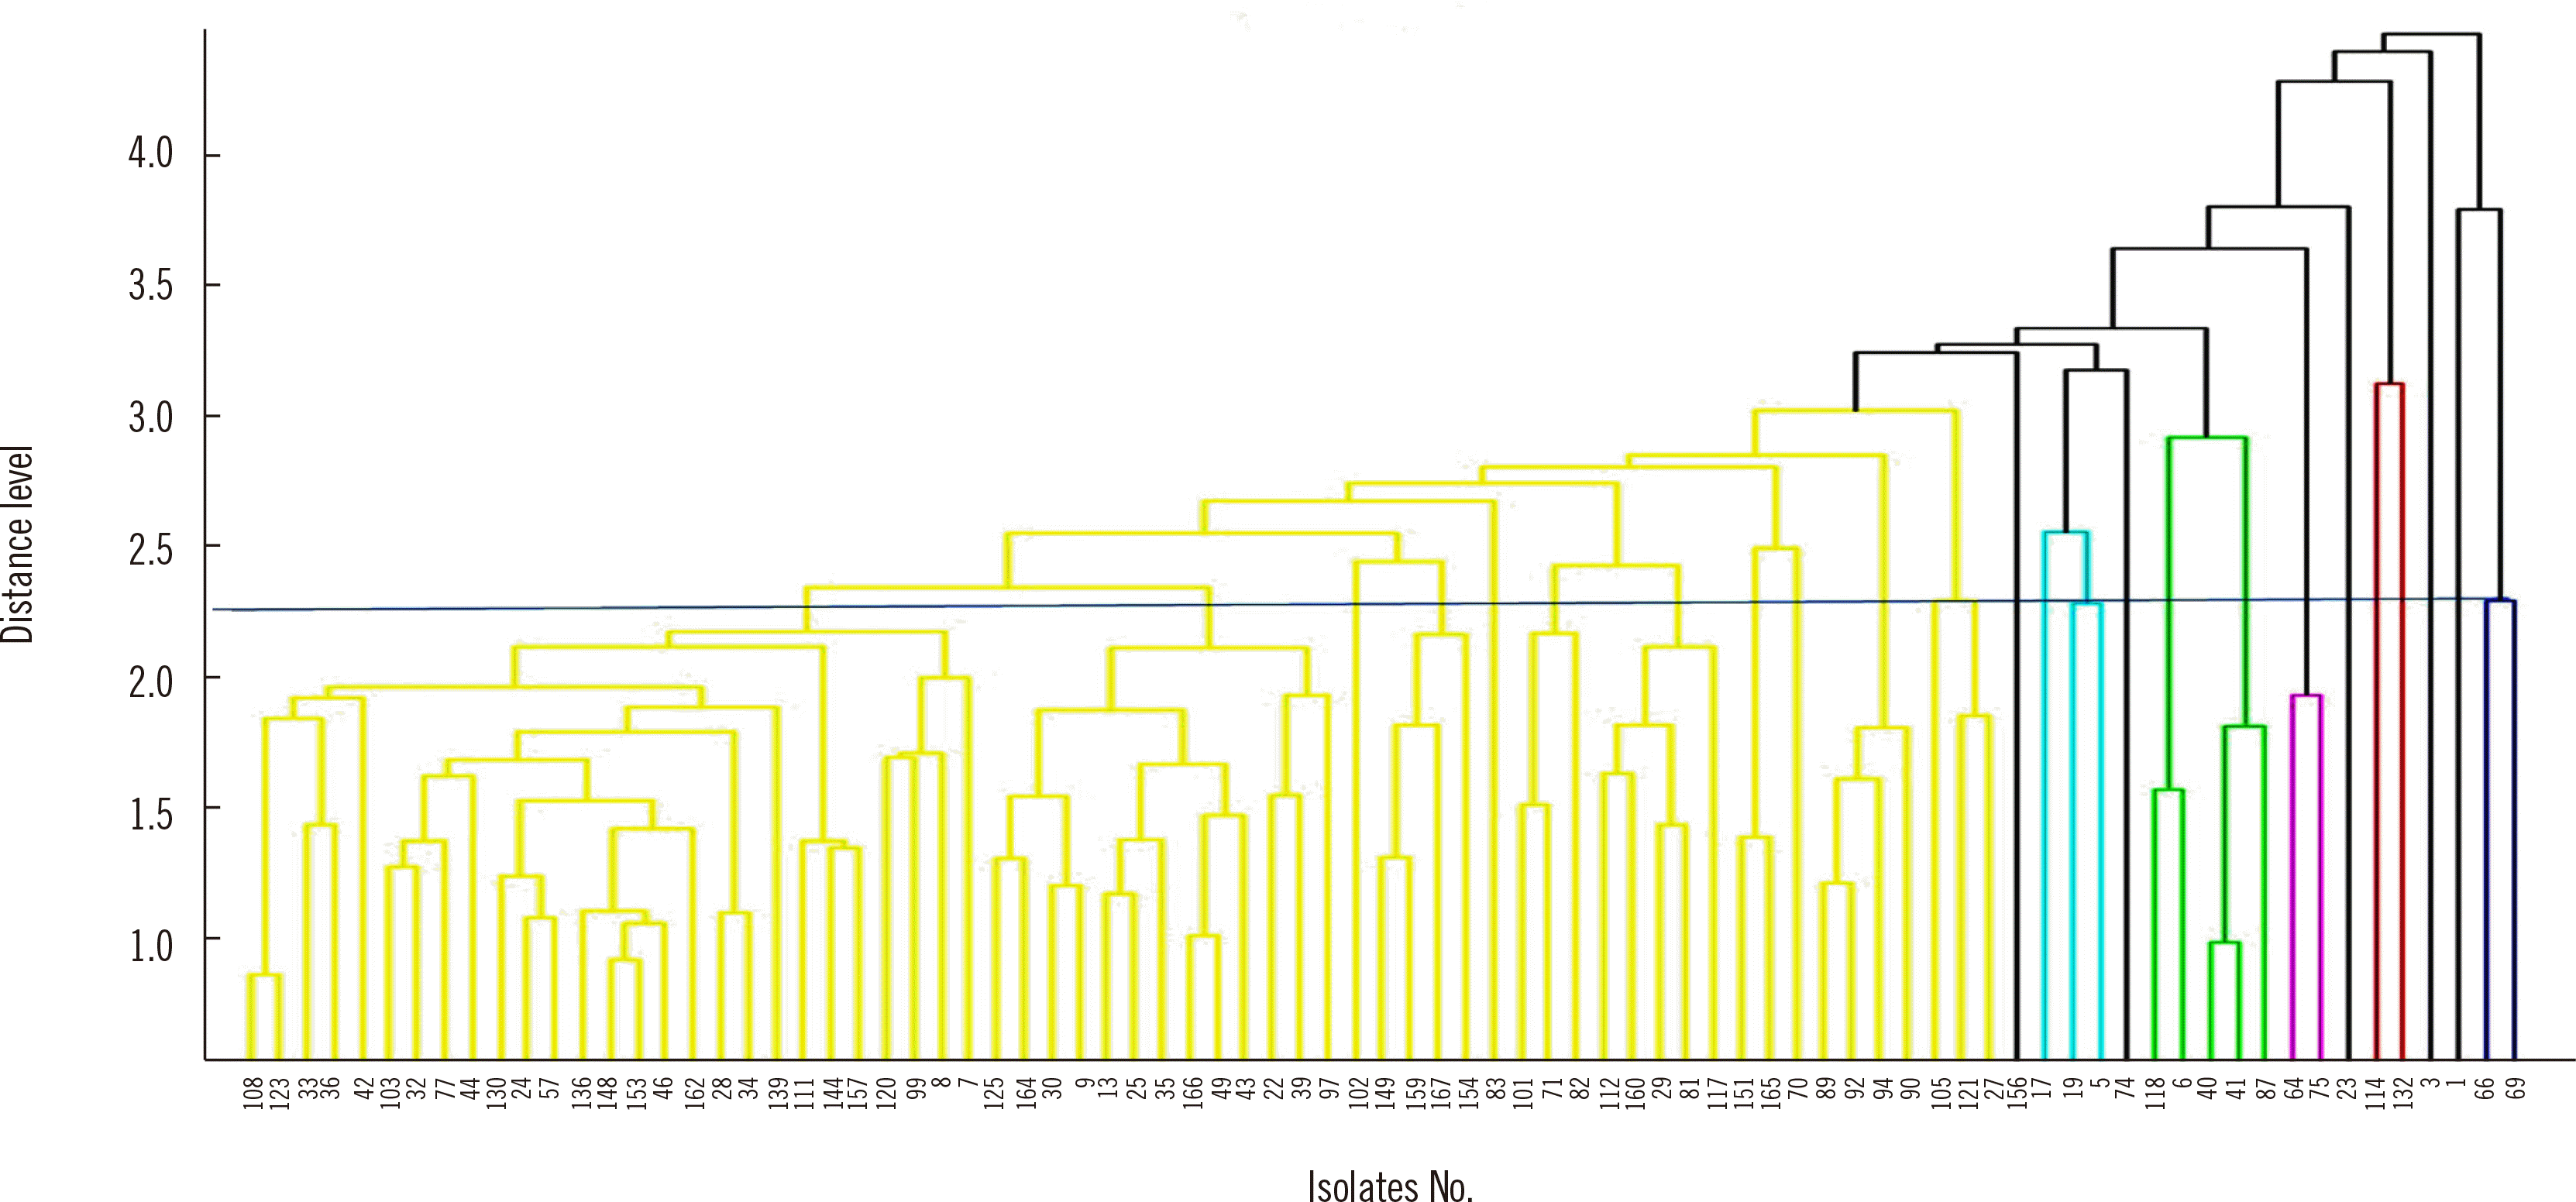
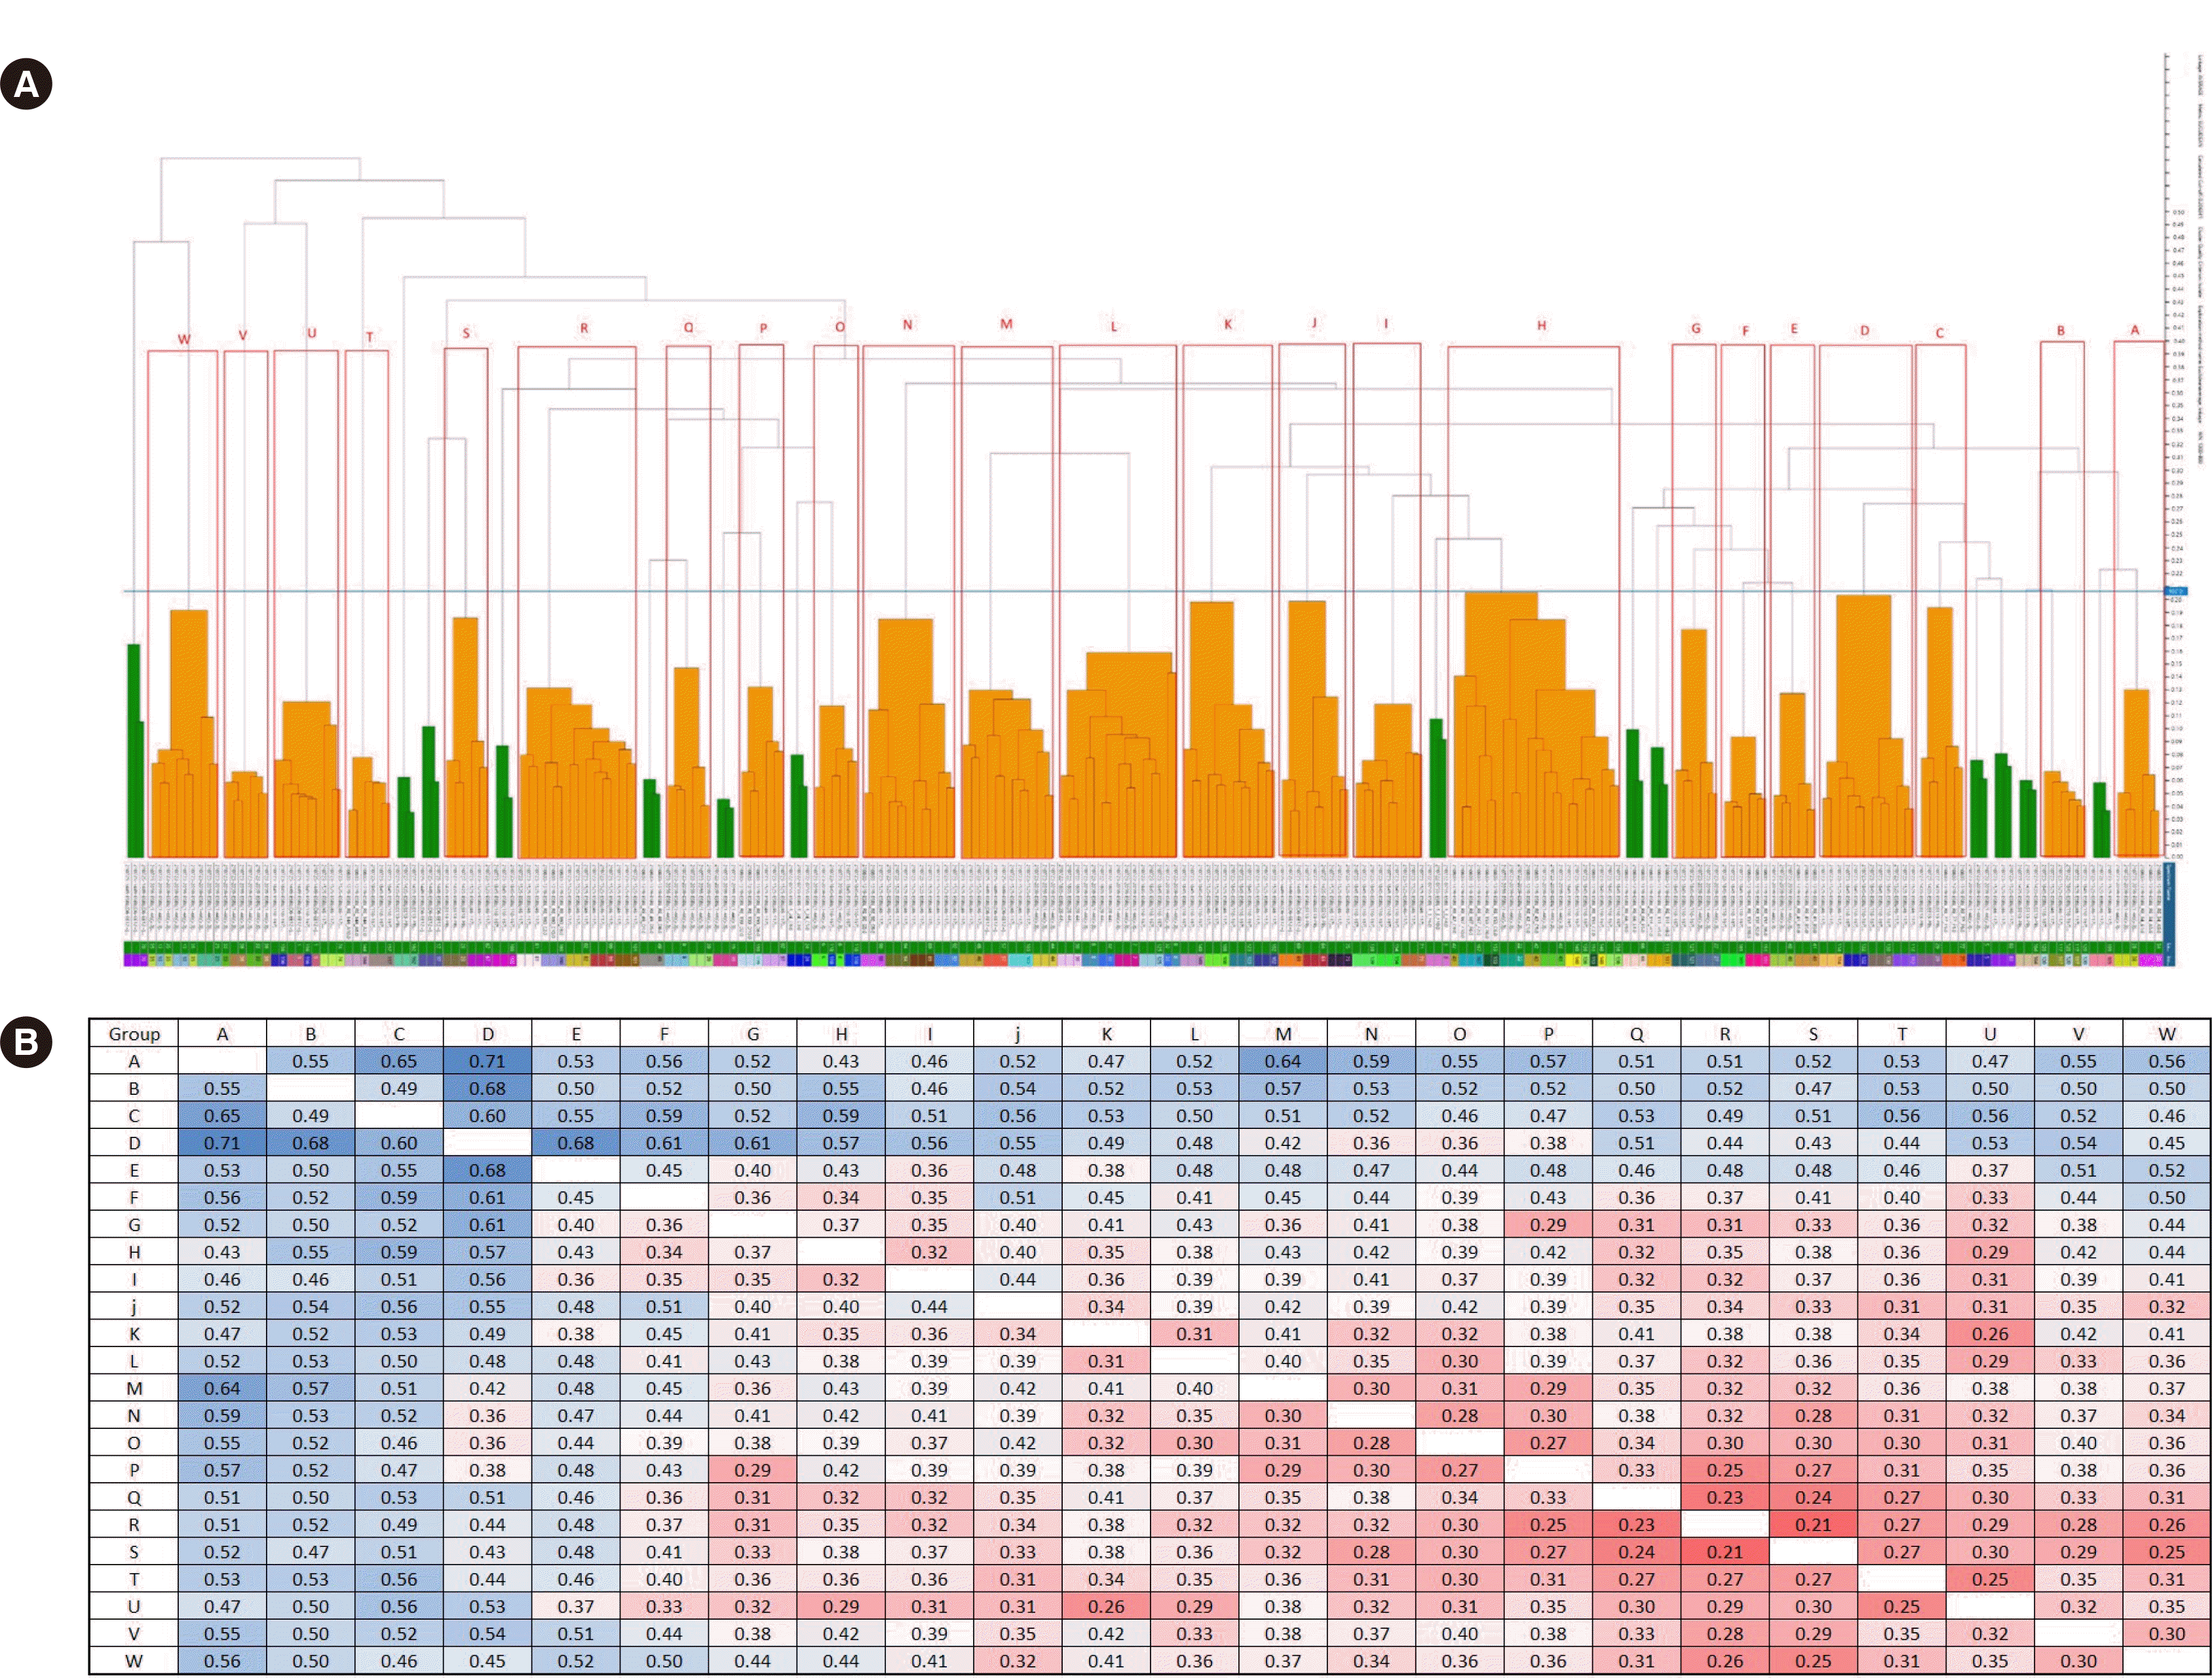
cgMLST divided the 83 ESBL-EC isolates into three groups in the WGS dendrogram (Fig. 1). The number of clusters was 28 using MALDI-TOF MS with a distance in the range of 2.0–2.5 (Fig. 2). These 83 strains were classified into 23 groups with IR Biotyper (Fig. 3A). The average distance value of the integrated 23 groups showed a COV of 0.206; groups S and R were the most similar (COV=0.21), whereas groups A and D were the least similar as independent groups (COV=0.71) (Fig. 3B).
The SDI (95% confidence interval) was 0.969 (0.952–0.985) for WGS, 0.865 (0.807–0.924) for MALDI-TOF MS, and 0.974 (0.965–0.983) for IR Biotyper (Table 1). Compared with WGS as a reference, IR Biotyper showed compatible diversity, whereas MALDI-TOF MS did not.
The concordance was 66.3%, and the aRI was 0.173 when MALDI-TOF MS was compared with WGS. The concordance was 84.3%, and the aRI was 0.538 when IR Biotyper was compared with WGS (Table 1).
MALDI-TOF MS is a quick, simple, and inexpensive species identification method for diagnosing bacterial infections. However, the performance of MALDI-TOF MS as a first-line epidemiological tool is hindered owing to its limited robustness and exportability [3]. Polymorphism discrimination using MALDI-TOF MS is poor compared with that obtained using amplified fragment length polymorphism for strain typing of ESBL-EC [4]. Although MALDI-TOF MS could be used to detect sequence types of 131 E. coli with a peak at 9,713 m/z, which is useful for sequence type (ST) screening [5], it showed insufficient discriminatory power to determine the clonality of multidrug-resistant Acinetobacter baumannii isolated from patients admitted to intensive care units [18].
IR Biotyper was developed as an easy and fast method, including an enhanced Fourier-transform infrared (FTIR) spectrometer. FT-IR spectroscopy, first introduced in 1950, measures the absorption of energy corresponding to vibration and rotation in the binding of molecules when infrared rays are irradiated onto a sample [19]. Structural information can be obtained based on the presence or absence of a specific covalent bond because only the infrared frequency matches the intrinsic vibration frequency of a specific covalent bond of a molecule [19]. A specific infrared spectrum of all chemical components can be generated to identify microorganisms at the subspecies level, and the results are expressed in a PCA plot, dendrogram, or three-dimensional scattering view [19]. IR Biotyper can be used in an easy and cost-effective manner to differentiate microorganisms at the strain level, commonly referred to as strain typing. Unlike previous FTIR techniques, IR Biotyper is an integrated system that provides a turn‐key solution for microorganism typing [7]. IR Biotyper could accurately cluster Klebsiella pneumoniae strains, and typing results were almost completely concordant with those from PFGE and WGS [7]. Considering its advantages such as low cost and short turnaround time (<3 hours), IR Biotyper could be a promising tool for strain typing that could make real-time outbreak investigation a reality [7].
For diversity analysis, the SDI and aRI were used in this study. SDI is a measure of diversity that considers the number of species present as well as the relative abundance of each species. As species richness and evenness increase, diversity increases [16]. aRI is the corrected-for-chance version of the RI. This correction establishes a baseline by using the expected similarity of all pairwise comparisons between clusters specified by a random model [17]. In this study, when compared to WGS, IR Biotyper showed compatible diversity, whereas MALDI-TOF MS did not, and the overall concordance with WGS was much better with IR Biotyper than with MALDI-TOF MS. IR Biotyper substantially improved the performance of strain typing compared with MALDI-TOF MS. We speculate that the current library of MALDI-TOF MS might not be sufficient to distinguish polymorphisms within species.
A limitation of this study was that the tested ESBL-EC strains were all isolated from poultry industry-related samples. These isolates could be more diverse than those from outbreaks in healthcare facilities, which could influence the results of IR Biotyper. The transmission of antimicrobial-resistant bacteria from non-human sectors has become an important issue to control the antimicrobial resistance problem based on the “One-Health” concept [20]. Epidemiological analysis of resistant bacteria is essential not only in the situation of an outbreak in a healthcare facility but also for studying the transmission of resistant bacteria. IR Biotyper could be a useful candidate for this purpose, despite its insufficient consistency with WGS.
Notes
AUTHOR CONTRIBUTIONS
Conceptualization: Kim YA; Data curation: Son YJ; Methodology: Lee S; Validation: Lee S, Jung W, Kim H, Kim S, Kim H, Yong D, and Lee K; Writing—original draft: Son YJ; Writing—review and editing: Kim YA. All authors have read and agreed to the published version of the manuscript.
REFERENCES
1. Melles DC, van Leeuwen WB, Snijders SV, Horst-Kreft D, Peeters JK, Verbrugh HA, et al. 2007; Comparison of multilocus sequence typing (MLST), pulsed-field gel electrophoresis (PFGE), and amplified fragment length polymorphism (AFLP) for genetic typing of Staphylococcus aureus. J Microbiol Methods. 69:371–5. DOI: 10.1016/j.mimet.2007.01.013. PMID: 17346834.
2. Quainoo S, Coolen JPM, van Hijum SAFT, Huynen MA, Melchers WJG, van Schaik W, et al. 2017; Whole-genome sequencing of bacterial pathogens: the future of nosocomial outbreak analysis. Clin Microbiol Rev. 30:1015–63. DOI: 10.1128/CMR.00016-17. PMID: 28855266. PMCID: PMC5608882.

3. Sauget M, Valot B, Bertrand X, Hocquet D. 2017; Can MALDI-TOF mass spectrometry reasonably type bacteria? Trends Microbiol. 25:447–55. DOI: 10.1016/j.tim.2016.12.006. PMID: 28094091.

4. Veenemans J, Welker M, van Belkum A, Saccomani MC, Girard V, Pettersson A, et al. 2016; Comparison of MALDI-TOF MS and AFLP for strain typing of ESBL-producing Escherichia coli. Eur J Clin Microbiol Infect Dis. 35:829–38. DOI: 10.1007/s10096-016-2604-1. PMID: 26922068.

5. Kim YA, Yong D, In YH, Park HS, Lee K. 2016; Application of matrix-assisted laser desorption ionization time-of-flight mass spectrometry to screen the extended-spectrum β-lactamase-producing ST131 Escherichia coli strains. Ann Clin Microbiol. 19:65–9. DOI: 10.5145/ACM.2016.19.3.65.

6. Rakovitsky N, Frenk S, Kon H, Schwartz D, Temkin E, Solter E, et al. 2020; Fourier transform infrared spectroscopy is a new option for outbreak investigation: a retrospective analysis of an extended-spectrum-beta-lactamase-producing Klebsiella pneumoniae outbreak in a neonatal intensive care unit. J Clin Microbiol. 58:e00098–20. DOI: 10.1128/JCM.00098-20. PMID: 32161093. PMCID: PMC7180251.
7. Hu Y, Zhou H, Lu J, Sun Q, Liu C, Zeng Y, et al. 2021; Evaluation of the IR Biotyper for Klebsiella pneumoniae typing and its potentials in hospital hygiene management. Microb Biotechnol. 14:1343–52. DOI: 10.1111/1751-7915.13709. PMID: 33205912. PMCID: PMC8313285.
8. Kim H, Kim YA, Seo YH, Lee H, Lee K. 2021; Prevalence and molecular epidemiology of extended-spectrum-β-lactamase (ESBL)-producing Escherichia coli from multiple sectors of poultry industry in Korea. Antibiotics. 10:1050. DOI: 10.3390/antibiotics10091050. PMID: 34572632. PMCID: PMC8466054.

9. Prjibelski A, Antipov D, Meleshko D, Lapidus A, Korobeynikov A. 2020; Using SPAdes de novo assembler. Curr Protoc Bioinformatics. 70:e102. DOI: 10.1002/cpbi.102. PMID: 32559359.

10. Seemann T. 2014; Prokka: rapid prokaryotic genome annotation. Bioinformatics. 30:2068–9. DOI: 10.1093/bioinformatics/btu153. PMID: 24642063.

11. Center for Genomic Epidemiology. http://www.genomicepidemiology.org/. Updated on Aug 2022.
12. Hammer Ø, Harper DA, Ryan PD. 2001; PAST: paleontological statistics software package for education and data analysis. Palaeontologia Electronica. 4:9.
13. FlexControl 3.4 User Manual. https://researchservices.pitt.edu/sites/default/files/flexControl%20User%20Manual.pdf. Updated on Aug 2022.
14. Bruker. OPUS: Vibrational spectroscopy software. https://www.bruker.com/en/products-and-solutions/infrared-and-raman/opus-spectroscopy-software.html. Updated on Aug 2022.
15. Comparing partitions. Online tool for quantitative assessment of classification agreement. http://www.comparingpartitions.info. Updated on Mar 2022.
16. Grundmann H, Hori S, Tanner G. 2001; Determining confidence intervals when measuring genetic diversity and the discriminatory abilities of typing methods for microorganisms. J Clin Microbiol. 39:4190–2. DOI: 10.1128/JCM.39.11.4190-4192.2001. PMID: 11682558. PMCID: PMC88515.

17. Pinto FR, Carriço JA, Ramirez M, Almeida JS. 2007; Ranked adjusted Rand: integrating distance and partition information in a measure of clustering agreement. BMC Bioinformatics. 8:44. DOI: 10.1186/1471-2105-8-44. PMID: 17286861. PMCID: PMC1802093.

18. Rim JH, Lee Y, Hong SK, Park Y, Kim M, D'Souza R, et al. 2015; Insufficient discriminatory power of matrix-assisted laser desorption ionization time-of-flight mass spectrometry dendrograms to determine the clonality of multi-drug-resistant Acinetobacter baumannii isolates from an intensive care unit. BioMed Res Int. 2015:535027. DOI: 10.1155/2015/535027. PMID: 26101775. PMCID: PMC4458526.
19. Wenning M, Scherer S. 2013; Identification of microorganisms by FTIR spectroscopy: perspectives and limitations of the method. Appl Microbiol Biotechnol. 97:7111–20. DOI: 10.1007/s00253-013-5087-3. PMID: 23860713.

20. Hernando-Amado S, Coque TM, Baquero F, Martínez JL. 2019; Defining and combating antibiotic resistance from one health and global health perspectives. Nat Microbiol. 4:1432–42. DOI: 10.1038/s41564-019-0503-9. PMID: 31439928.

Fig. 1
Dendrogram from whole-genome sequencing data created using core-genome multi-locus sequence typing. A total of 83 extended-spectrum-β-lactamase–producing Escherichia coli isolates were determined to have 40 core genome sequence types. The dendrogram was divided largely into three groups.

Fig. 2
Dendrogram based on matrix-assisted laser desorption/ionization time-of-flight mass spectrometry. Eighty-three extended-spectrum β-lactamase–producing Escherichia coli isolates were divided into 28 clusters with a distance in the range of 2.0–2.5. Different colors represent separate strains.

Fig. 3
Dendrogram and distance matrix obtained by IR Biotyper. (A) Eighty-three strains were classified into 23 groups (A–W); groups S and R were the most similar with a cut-off value (COV) of 0.21 (blue line), whereas groups A and D were the least similar as independent groups with a COV of 0.71. Green indicates a good-quality cluster and orange indicates a poor-quality cluster based on triplicate analyses of each isolate. (B) Distance matrix obtained by IR Biotyper. If the similarity between the two groups was less than 0.39, it was indicated in red, and if it was more than 0.39, it was indicated in blue.

Table 1
Comparison of three strain typing methods
| Method | N of clusters | SDI (95% Cl) | Concordance with WGS (%) | aRI with WGS (95% Cl) |
|---|---|---|---|---|
| MALDI-TOF MS | 28 | 0.865 (0.807–0.924) | 66.3 | 0.173 (0.027–0.325) |
| IR Biotyper* | 37 | 0.974 (0.965–0.983) | 84.3 | 0.538 (0.317–0.748) |
| WGS | 40 | 0.969 (0.952–0.985) | - | - |


 PDF
PDF Citation
 Print
Print


 XML Download