

 PDF
PDF ePub
ePub Citation
 Print
Print


INTRODUCTION
Excessive consumption of dietary sugars is known to raise the risk for development of non-communicable diseases [123456]. The World Health Organization (WHO) has recommended a reduced intake of free sugar to less than 10% of total energy (TE) intake [7]. Government and health organizations worldwide have set up their own guidelines for sugar intake [8], and have been pursuing various public health policies for reducing dietary sugar consumption, such as formulating a sugar-sweetened beverage (SSB) excise tax [910], developing an environment for reducing sugar consumption [1112], and introducing programs to change dietary behavior [131415].
According to a recent nationwide study [16], the average sugar intake of Koreans is lower than that of other countries [1718] and remains under the recommended level of the Korean Nutrition Society (KNS, 10 to 20% TE) [19], and by the Ministry of Food and Drug Safety (MFDS, less than 10% TE from processed foods) [20]. However, even in Korea, a public concern about dietary sugar has increased on account of the following reasons: youth sugar consumption has already exceeded the recommended level, processed products consumption has been steadily on the rise, and an increased dietary sugar consumption trend has been found in all age groups [1621]. In 2016, the Korea government announced the first preventive management action plan for sugar reduction [20], Meanwhile, academia and government have made efforts to improve public awareness and dietary habits, create a social environment for reducing sugar consumption, and developed a database on the content of sugar in food and conducted research for investigating the relationship of dietary sugar on diseases.
Public health promotion programs need human and material resources, but available resources are limited. Thus, in order to allocate limited resources for the total population, a consortium of government, business, and academia have estimated the socioeconomic burden of various health problems. The population attributable fraction (PAF) is the fraction of diseases attributable to risk factor exposure, that is, the proportion of diseases that could be prevented by eliminating unhealthy risk factors. This information helps policy makers prioritize among numerous health problems. However, no studies exist that estimate the potential influence and socioeconomic burden of dietary sugar consumption of the Korean population on disease incidence and health.
This study aimed to evaluate the PAF as related to dietary sugar consumption on the incidence of disease and death in Korea, and estimate the socioeconomic effects of dietary sugar reduction, providing scientific evidence for health professionals and policy makers.
MATERIALS AND METHODS
SSB consumption
Dietary sugar consumption was assessed using one day 24-hr recall data of the Korean National Health and Nutrition Examination Survey 2015 and the database for the total sugar content of foods from the MFDS [21]. Sugar consumption from beverages was calculated by summing all amount of sugar consumed from all beverages (e.g. soft drinks, tea, coffee, chocolate milk, yogurt, etc.) except white milk. The reason we excluded white milk was as follows. The dietary sugars we consume generally come from natural sugars present in foods and sugars that are added to foods and beverages during processing or cooking. Harmful effects of dietary sugars were only found when added sugars (or products rich in added sugars) were excessively consumed [7]. Thus, dietary advice on sugars mainly focuses on the added (or free) sugars. Among dairy foods, although it passes through some food manufacturing processes, white milk only contains natural sugars (lactose and galactose), whereas other milk beverages, such as flavored milk and yoghurt drinks, contain a considerable amount of added sugars. Thus, we tried to assess the dietary sugar consumption from all beverages except for white milk.
In this study, we defined consuming ≥ 20 g of sugar from beverages as SSB overconsumption (≥ one serving of sugary drinks). This amount is similar to the content in one serving (200 mL) of sugary drinks [21].
Relative risks of SSB overconsumption and population attributable fractions to SSB overconsumption
Diseases influenced by excessive sugar intake and disease-specific relative risks of SSB consumption were obtained from previous studies [23456222324252627]. Systematic review articles were preferred, however, narrative and individual original articles were also referenced if meta-analysis studies were not available.
The PAFs for each disease were calculated using the prevalence of SSB overconsumption and disease-specific relative risks, according to Levin's formula [28], which means the fraction of diseases attributable to SSB overconsumption. When the SSB overconsumption was prevented, morbidity and mortality related to sugar consumption were expected to be avoided.
The numbers of patients with SSB overconsumption-caused disease were estimated using the disease-specific PAF and the total number of patients with each disease from the 2015 National Health Insurance Statistics 2015 [29]. The PAF of death and the number of diminished deaths for adults aged 20 years or older were estimated using the PAF of sex-, age-(20–44 years, 45–64 years, and ≥ 65 years), and cause-specific deaths reported by the Global Burden of Diseases Nutrition and Chronic Diseases Expert Group [1] and the total number of sex-, age group-, and cause-specific deaths reported by Statistics Korea in 2015 [30]. The causes of death were limited to specific diseases associated with sugar consumption, including type 2 diabetes mellitus, cardiovascular diseases, and specific-site cancers (esophagus, gallbladder, pancreas, colon, uterus, breast, or kidney).
Socioeconomic burden due to SSB overconsumption
If the magnitude of diseases in the population decreases along with preventing SSB overconsumption, costs associated with the treatment of the diseases are saved. Socioeconomic costs also could be saved in accordance with a decrease of SSB consumption-affected deaths. This burden was evaluated by cost savings when excessive SSB consumption was assumed to be prevented. This approach are applied in investigating the cost-benefits of the risk factor (e.g. smoking, excessive dietary sodium intake) prevention policy [3132]. The costs consist of direct medical care costs and non-medical care costs (e.g. transportation, caregiver expenses), and indirect costs due to labor loss. All costs were estimated in 2015 prices.
Cost savings due to reduced patients
Medical care cost varies by the type of treatment, thus the cost savings were evaluated at the outpatient and inpatient levels, respectively. In outpatient treatment settings, medical cost savings were estimated by multiplying the number of reduced outpatients by the average annual outpatient medical expense per patient. The average annual outpatient medical expenses per patient were applied after calculating the amount using the annual aggregate outpatient medical expenses and the total number of outpatients reported by the National Health Insurance Service [29]. While the total medical fee consists of a co-payment (paid by the patient), the insurance benefit (paid by NHIS), and a non-insured co-payment (paid by the patient), the medical expenses in the statistical yearbook [29] refers only to the sum of the co-payment paid by the patient and the insurance benefits. In order to assume the medical expense, including the non-insured co-payment paid by the patient, the rate of the non-benefit co-payment paid by the patient [33] was applied to estimate the amount of medical care cost savings.
Among outpatients, savings in the transportation costs were estimated by multiplying the number of reduced outpatients and the number of medical institution visits per outpatient by transportation costs per visit for outpatient treatment. Among inpatients, savings were calculated by multiplying the number of reduced inpatients by the annual transportation costs for hospitalization treatments per inpatient. The transportation costs in 2015 were assumed by reflecting the consumer price index as the costs presented in the KNHANES 2005 report [34]. Reduction in the number of patients can lead to savings in caregiver costs. The savings in caregiver costs were estimated using the number of reduced inpatients, the number of hospitalized days per inpatient, and an average daily wage of the caregiver. The number of hospitalized days was calculated using the total number of inpatients and the annual aggregate number of hospitalized days in 2015 [29]. The consumer price index was reflected in the calculation of the daily wage of the caregiver in 2015 from the wage reported in 2005 [34].
Besides the aforementioned direct cost savings, reduced numbers of patients would also bring about reduced labor losses along with decreased medical institution visits. Indirect cost savings from reduced labor losses were estimated using the number of reduced patients, the number of medical institution visits per patient [29], sex- and age-specific average daily wages, and employment rates [3536]. In the case of inpatient treatment, the number of hospitalized days was treated the same as the number of medical institution visits, although one visit for outpatient treatment was considered as a labor loss for half a day.
Cost savings due to reduced deaths
If patients die prior to average life expectancy, future expected income for the rest of their life would be lost. Cost savings from reduced deaths were estimated using the number of sex-, age-, and cause-specific deaths as well as sex- and age-specific future expected income. The future expected income was calculated by summing sex and age-specific annual expected income from the age at death to their average life expectancy, and each annual expected income was calculated using sex and age-specific annual employee income and sex and age-specific employment rates [3536]. For patients between 70–79 years of age, the employment rates and annual employee income were treated as half of that of individuals aged ≥ 65 years. Patients aged 80 years or older were considered unemployed and unwaged.
Ethics
In Korea, national studies, such as the KNHANES, which national organizations carry out to improve public welfare, are allowed to be conducted without the approval of the Institutional Review Board (IRB) on the basis of the Bioethics and Safety Act [37]. Thus, the protocol of KNHANES 2015 was exempted from the IRB approval requirement. Written informed consent was provided by all participants.
RESULTS
Prevalence of SSB consumption
Average daily intake of total dietary sugars was 76.9 g (15.1% TE) and 45.9 g of sugars (8.7% TE) were consumed from processed food except for white milk (data not shown).
Although the average consumption was under the recommended level by the MFDS [38] and the KNS [19], one in three Koreans (33.2%) consumed more than 10% TE of sugars from processed food except for white milk. A total of 32.1% of Koreans consumed more than 20 g of dietary sugars per day from beverages (data not shown).
Relative risks of SSB overconsumption and population attributable fractions to SSB overconsumption
Obesity, diabetes, cardiovascular diseases including hypertension, ischemic heart disease, and stroke, and dental caries were selected as diseases influenced by excessive sugars consumption (Table 1). In previous studies [23456222324252627], the impact of excessive dietary sugars was mainly evaluated in terms of consumption of beverages, a major source of sugar. Disease-specific relative risks for consumption of ≥ 1 serving a day of SSB were presented in Table 1.
Disease-specific PAF to overconsumption of dietary sugars from beverages (≥ 20 g of sugars from beverages) ranged from 3.11% for stroke to 9.05% for obesity and dental caries, respectively. For example, among a total of diabetic outpatients (n = 2,500,933) and inpatients (n = 91,384) in 2015, 5.46% (136,550 outpatients and 4,989 inpatients) were attributable to excessive SSB consumption. This would be preventable when the prevalence of overconsumption (32.1%) among the population decreased to 0 %. Among the outpatients, more than half were from dental caries, and two-thirds of inpatient results were from ischemic heart disease and diabetes.
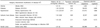
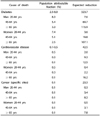
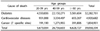
Among a total of 273,265 deaths among adults aged ≥ 20 years [30], 66,674 (24.4%) died from diabetes, cardiovascular diseases, or specific-site cancers such as those in the esophagus, gallbladder, pancreas, colon, uterus, breast, and kidney (data not shown). The PAFs for cause-specific deaths were briefly presented in Table 2. A total of 389 deaths (229 in men, 160 in women) were estimated to be caused by SSB overconsumption. A considerable fraction of this reduction was from diabetes-specific deaths. Nearly 70% of the reduction in deaths were from a population aged 65 years or older, and the rest from an economically active population aged 20 to 64 years.
Socioeconomic burden due to SSB overconsumption
Cost savings due to reduced patients
The amounts of savings in direct and indirect costs were presented in Table 3. Among the outpatients, savings in medical care costs were 311 billion won and non-medical (transportation) cost savings were 39 billion won. Among inpatients, an estimated 105 billion won was saved in medical care costs and 40 billion won, a sum of 0.5 billion won (transportation costs) and 39.6 billion won (caregiver costs), were predicted to be saved in non-medical costs (data not shown). Thus, a total of 495 billion won of direct costs were estimated to be saved by preventing SSB overconsumption. Of direct cost savings, 80% was from a reduction in outpatients and the rest (20%) from the costs associated with inpatients treatment. Among diseases, the reduction in diabetes or cardiovascular disease contributed substantially to cost savings by reducing dietary sugar intake.
Savings in indirect costs due to productivity loss were a total of 99 billion won, which consisted of 80 billion won from outpatient treatments and 19 billion won from inpatient treatments. A sum of 594 billion won was estimated to be saved by patients reducing sugary beverage overconsumption.
Cost savings due to reduced deaths
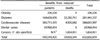
Cost savings derived from a reduction in deaths was estimated up to 39 billion won (Table 4). Most of the savings (83.0%) came from reduction of death at under 60 years of age.
Total cost savings from preventing SSB overconsumption in Korea
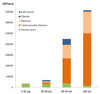
A total of 633 billion won was estimated as avoidable costs through preventing SSB overconsumption (Table 5). Fig. 1 shows the estimates of cost savings by age group. Socioeconomic burden caused by SSB overconsumption were considerably heavier in older age groups. Over half of the total amount was expected to be saved in those aged 60 years or older. In those under the age of 20 years, costs associated with the treatment of dental caries accounted for a substantial portion (95.6% of 17 billion won, −16 billion won), and dental caries caused by SSB consumption was still a significant burden to those under 60 years of age, 48.1% of 34 billion won (−16 billion won) in 20–39 years and 8.4% of 224 billion won (−19 billion won) in 40–59 years, respectively. In the older group, the socioeconomic burden was considerably heavier, especially associated with the treatment of diabetes and cardiovascular diseases.
DISCUSSION
Among Koreans aged 1 year or older, 32.1% consumed more than 20 g of dietary sugar from beverages per day, which is equivalent to the amount of more than 1 serving of SSB. This amount of SSB consumption contributed to the development of multiple diseases, ranging from 3.11% for stroke to 9.05% for obesity and dental caries. The socioeconomic burden due to SSB overconsumption in Korea was estimated to be nearly 633 billion won.
In this study, dietary sugars overconsumption was considered as consuming more than 1 serving of SSB a day, which was defined as the intake of more than 20 g of sugar from beverages. The PAFs and the cost savings were estimated on the assumption that such a dietary problem was eliminated. Unlike most nutrients, dietary guidelines for sugars vary considerably across different countries in terms of the recommended amount and the types of sugar specified [8]. The WHO recommends reducing the intake of free sugar to less than to 10% TE, which is defined as mono- and disaccharides added to foods and beverages by the manufacturer, cook, or consumer, and sugars naturally present in honey, syrups, fruit juices, and fruit juice concentrates [39]. The European Food Safety Authority recommends reducing the daily intake of less than 10% TE from added sugar, only referring to those added during processing [40]. In the UK, the Scientific Advisory Committee of Nutrition recommends the intake of less than 10% TE from non-milk extrinsic sugars (NMES). The Institute of Medicine of the US suggests a relatively less strict level, with the intake of 25% TE from added sugar [41]. In Korea, the KNS recommends the intake of 10–20% TE from total sugar [19] and the MFDS suggests less than 10% TE of sugar from processed foods [38], respectively. Despite these differences, the intake of added sugars into raw food appears to be a common international issue. However, it is hard to divide sugar actually present in food into natural sugar and artificially-added categories because there is no chemical difference between these types, and thus few studies have reported the intake of added or free sugar in the population. For the same reason, a number of studies showing harmful effects of sugar overconsumption have usually focused on SSB consumption, rather than total or added sugar [124623254243]. Therefore, we dealt with the problem of excessive sugar intake related to the overconsumption of sugar-containing beverages.
The socioeconomic burden magnitude of SSB consumption amounts to around 30% of the 2015 healthcare budget (2,280 billion won) for the Ministry of Health and Welfare [44] and corresponds roughly to 1.6 times of the budget (395 billion won) of the MFDS in the same year [45]. However, the estimate of the burden is considerably lower compared to that from excessive dietary sodium intake [31] as well as from smoking or alcohol intake [32], and even relatively lower compared to other countries [1]. There are some reasons for this difference. First, the prevalence of SSB overconsumption of Koreans is not as high as that of other health-related behaviors and other countries including Australia, Netherlands, and the United Kingdom, among others [173946]. For instance, excessive sodium intake is a chronic public health problem in Korea, in which average intake is more than twice the recommended level and excessive consumption has been found in almost all individuals [46]. However, the average intake of dietary sugars is still within the recommended level and overconsumption of dietary sugar, as well as SSB, is relatively less prevalent in Korea [117], even though sugar intake is increasing continuously. Second, other health-related behaviors such as smoking, drinking, and excessive sodium intake have been considered major risk factors and their wide range of impact on health have long been investigated. However, evidence on the influence of sugar overconsumption has been growing and some results remain controversial [434748]. In this study, the socioeconomic burden of SSB consumption was rigorously estimated on the basis of evidence which has been widely known and has few disputes. The estimate did not include the burden derived from some diseases under study. Thus, the actual benefits caused by reducing SSB consumption might be higher than the estimates in this study. In addition, sugar reduction could lead to priceless benefits such as improvement of health status and of quality of life, and even decrease health inequality.
This study has several strengths and limitations: This is the first study that estimates the PAFs to SSB overconsumption for diseases and deaths and its socioeconomic burden for Koreans. This result provides information that helps health professionals and policy makers to prioritize and allocate their resources, and also to implement programs for healthier dietary habits. However, the cost savings in this study may be underestimated for the several reasons. First, the cost savings did not include any reduction in informal care expenses. Second, if SSB overconsumption is prevented, reducing the severity of disease, it may result in some benefits such as improvement of the quality of life for patients. However, we could not consider any benefits due to a reduction in the severity of diseases. Third, estimates of cost savings included only socioeconomic benefits from some diseases and specific-cause deaths considered in this study, aside from other diseases under study. Finally, we estimated the PAF of SSB overconsumption using the relative risks of SSB consumption for morbidity and mortality, much information was merely available from foreign studies. If it is possible to apply the RR of Korean, more accurate estimation can be done.
In conclusion, sugar overconsumption causes a considerable public burden, although the cost estimates do not include any informal expenditures. Information on this socioeconomic burden helps health professionals and policy makers to create and to implement programs for reducing sugar consumption.
 XML Download