Journal List > J Korean Med Sci > v.39(9) > 1516086367

Oh and Song: Opioid Prescription and Long-Term Survival Outcomes in Adults: A Nationwide Cohort Study in Korea

Abstract

Background

We aimed to investigate the association between short- and long-term opioid use and long-term mortality in Korea.

Methods

In this population-based retrospective cohort study, data were obtained from the National Health Insurance Service of South Korea. The study included all adult individuals who were prescribed opioids in 2016. The control group comprised adults not prescribed opioids in 2016 selected using a 1:1 stratified random sampling technique. Participants were categorized into three groups: non-user, opioid 1–89 days user (short-term), and opioid ≥ 90 days user (long-term) groups. The primary endpoint in this study was 5-year all-cause mortality, evaluated from January 1, 2017 to December 31, 2021.

Results

In total, 4,556,606 adults were included in this study. Of these, 2,070,039 were prescribed opioids at least once. Specifically, 1,592,883 adult individuals were prescribed opioids for 1–89 days, while 477,156 adults were prescribed opioid for ≥ 90 days. In the multivariable Cox regression modelling, the opioid user group had a 28% (hazard ratio [HR], 1.28; 95% confidence interval [95% CI], 1.26–1.29; P < 0.001) higher risk of 5-year all-cause mortality than had the non-user group. Moreover, the opioid 1–89 days and opioid ≥ 90 days user groups had 15% (HR, 1.15; 95% CI, 1.14–1.17; P < 0.001) and 49% (HR, 1.49; 95% CI, 1.47–1.51; P < 0.001) higher risks of 5-year all-cause mortality than had the non-user group, respectively.

Conclusion

Both short and long-term opioid prescriptions were associated with increased long-term mortality among the Korean adult population.

Graphical Abstract

jkms-39-e82-abf001.jpg

INTRODUCTION

Opioids are among the most common analgesics prescribed as they are potent pain relievers.1 However, their prescription has been associated with the risk of dependence and addiction,2 contributing to the current global opioid epidemic.3 A recent study reported that the risk of opioid abuse and dependence was the highest in six countries, namely Australia, Canada, France, Germany, United Kingdom, and United States,4 suggesting that the opioid epidemic is currently one of the most important public health issues.
Opioid administration can cause a range of side effects, including sedation, dizziness, nausea, vomiting, constipation, and respiratory depression.5 Moreover, opioid therapy is known to have an immunosuppressive effect,6 which may lead to various adverse health outcomes.7 Population-based cohort studies have consistently reported that opioid use is associated with increased mortality,8910 with similar results reported in South Korea.1112 However, these studies have primarily focused on the effect of long-term or chronic opioid use on long-term prognosis using relatively small sample sizes.89101112 While both short- and long-term opioid use can affect long-term mortality in the general adult population; the exact nature of this association remains controversial.
Therefore, this study aimed to investigate the association between both short- and long-term opioid use and long-term mortality using a national registration database in South Korea.

METHODS

Study design and ethical statement

This population-based cohort study followed the requirements of the Strengthening the Reporting of Observational Studies in Epidemiology.13

Data source

As South Korea’s sole public health insurance system, the NHIS record data on drug prescriptions, medical procedures, and disease diagnosis, all of which are classified using the International Classification of Diseases, 10th Revision (ICD-10) numbers. The NHIS is an obligatory government health-care system in Korea that covers citizens as well as foreigners who have been in the nation for more than six months. Furthermore, the NHIS supplies information on socioeconomic characteristics and fatalities for all individuals in the NHIS database.14

Study population

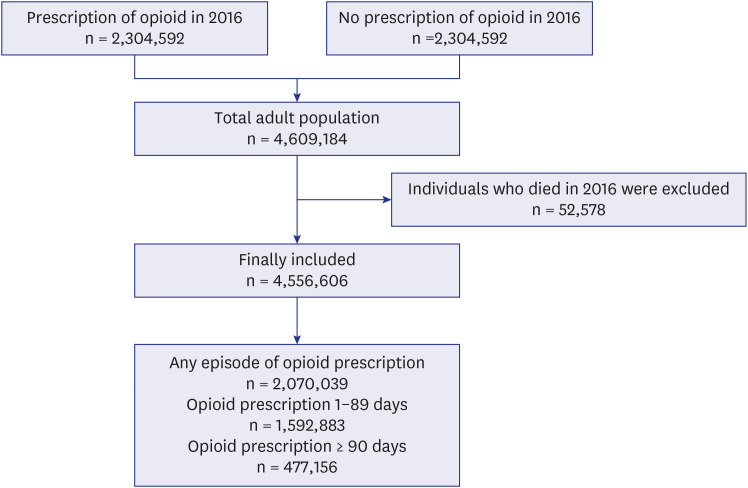
We initially requested the extraction of the data of all adult individuals (≥ 20 years old) who received any opioid prescription from medical institutions in 2016. Data were collected for only one day of opioid prescription for each individual. Thus, 2,304,592 adults receiving a prescription of opioids in 2016 were included. Thereafter, using a 1:1 stratified random sampling technique, considering the age and sex, we requested the extraction of data for 2,304,592 adult individuals in the non-user group who did not receive any opioid prescription between January 1, 2016 and December 31, 2016. Therefore, 4,609,184 adults were screened. After excluding 52,578 individuals who died in 2016, 4,556,606 were included in the analysis. Among them, 2,070,039 were prescribed opioids in 2016. Specifically, 1,592,883 individuals were prescribed opioids for 1–89 days while 477,156 individuals were prescribed opioids for ≥ 90 days. The participants were classified into three groups: non-user, opioid 1–89 days user, and opioid ≥ 90 days user groups according to the criteria of classification of short-term and long-term opioid prescription period.15 To evaluate chronic opioid prescriptions (lasting more than 3 months), data on opioid prescriptions from October 2015 to March 2017 was analysed. This approach was taken to minimize the misclassification of individuals who actually received long-term prescriptions as short-term users due to the relatively brief study period of one year. For instance, patients receiving opioid prescriptions from November 2016 to February 2017 might be inaccurately categorized as short-term users. The selection process for the study population is illustrated in Fig. 1.
Fig. 1

Flow chart depicting the study participants’ selection process.

jkms-39-e82-g001

Study endpoint

The primary endpoint in this study was 5-year all-cause mortality, which was evaluated from January 1, 2017 to December 31, 2021.

Collected covariates

All information regarding the covariates used in the analyses were collected in 2016. Demographic data included age and sex. Socioeconomic status-related information was assessed using household income levels and residences. Regarding household income, individuals who were too poor to pay insurance premiums were classified into the medical aid program group by the NHIS. All other patients were classified into four groups using quartile ratios (Q1 [lowest], Q2, Q3, and Q4 [highest]). Residences were classified into urban (Seoul or other metropolitan cities) and rural (all other areas). Information regarding underlying disabilities was collected as all disabilities must be registered in the NHIS database to be eligible for receiving various benefits from the social welfare systems in South Korea. All disabilities should be determined legally by a specialist doctor based on the criteria of difficulty in maintaining daily life activities due to disability. Underlying disability was categorized according to severity, distinguishing between mild-to-moderate and severe disability. To reflect the comorbid status of patients, 31 underlying diseases in the Elixhauser Comorbidity index were collected.16 Prescription data for other analgesics such as paracetamol, nonsteroidal anti-inflammatory drugs, gabapentin, and pregabalin were collected. Underlying musculoskeletal diseases such as osteoarthritis, low back pain, neck pain, gout, and other musculoskeletal diseases were collected as covariates because they necessitated opioid prescriptions. The ICD-10 codes of the underlying musculoskeletal diseases are displayed in Supplementary Data 1.

Statistical analysis

Percentages and interquartile ranges were used to represent categorical and continuous variables, respectively. Continuous variables were found to have a non-normal distribution, as indicated by the Kolmogorov-Smirnov test. The Mann-Whitney U Test and χ2 test were employed to test for the between-group comparisons of continuous and categorical variables, respectively.
We employed a multivariable Cox regression model to examine whether the opioid user group showed higher long-term mortality than the non-user group. All covariates were included in the adjusted model. Moreover, we fitted another multivariable Cox regression model for 5-year all-cause mortality after classifying the opioid user group into two subgroups–the 1–89 days opioid user and ≥ 90 days opioid user groups–to investigate whether the prescription period affects results. All results were presented as hazard ratios (HRs) with 95% confidence intervals (CIs), and log-log plots were used to confirm that the central assumptions of the Cox proportional hazard models were satisfied. There was no multicollinearity between the variables in the multivariate model, with variance inflation factors below 2.0. All statistical analyses were performed using IBM SPSS for Windows (version 25.0; IBM Corp., Armonk, NY, USA), and a P value < 0.05 was deemed statistically significant.

Ethics statement

Because this investigation used publicly available data, the Institutional Review Board (IRB) waived protocol deliberation (IRB number: X-2307-840-903). The National Health Insurance Service (NHIS) authorized the study protocol (NHIS approval number: NHIS-2023-1-115) and permitted data access. The IRB waived the necessity for informed consent because the study used retrospectively collected anonymised data.

RESULTS

Study population

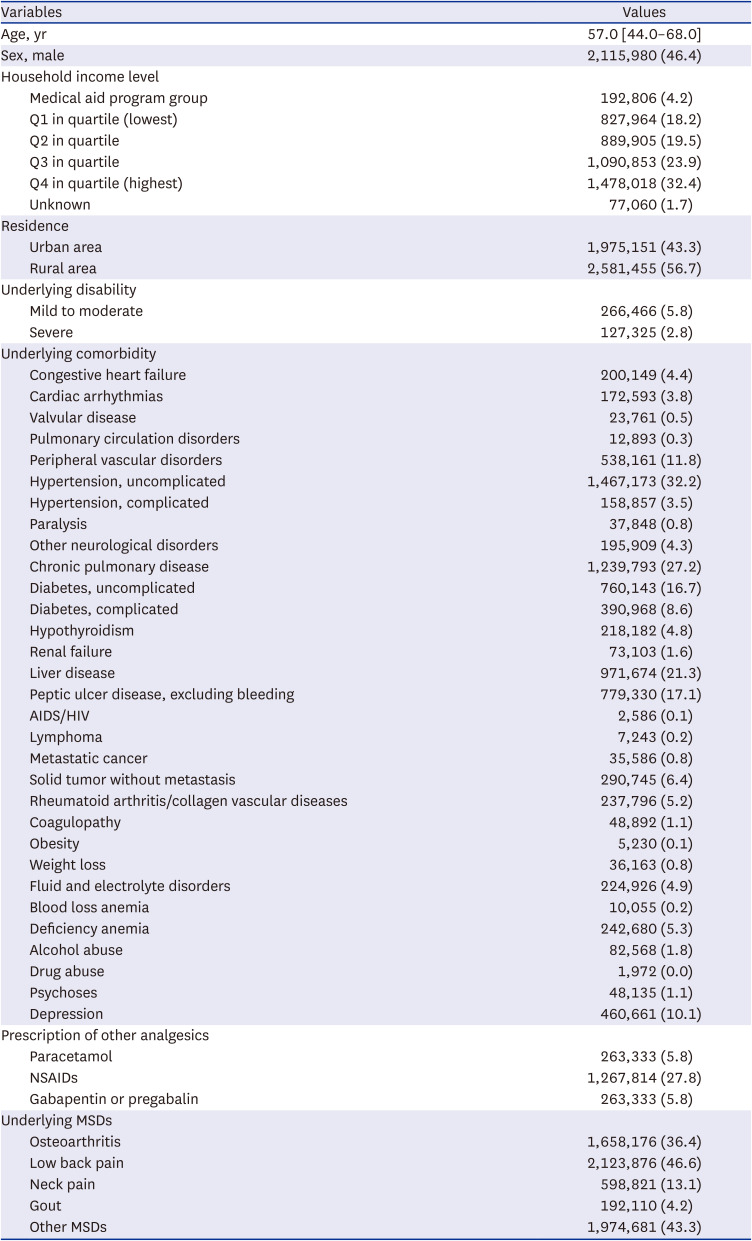
Fig. 1 shows a flowchart depicting the participant selection process in this study. The NHIS initially screened 2,304,592 adult individuals who were prescribed opioids in 2016 and extracted 2,304,592 controlled individuals as the non-user group. Thus, a total of 4,609,184 adult individuals were screened in 2016. After excluding 52,578 individuals who died in 2016, 4,556,606 adults were included in the study. Of these, 2,070,039 patients were prescribed opioids at least once. Specifically, 1,592,883 adult individuals were prescribed opioid for 1 day to 89 days, while 477,156 adults were prescribed opioids for 90 days or more. Table 1 shows the clinicopathological characteristics of the study population.
Table 1

Clinicopathological characteristics of the study population (N = 4,556,606)

jkms-39-e82-i001
Variables Values
Age, yr 57.0 [44.0–68.0]
Sex, male 2,115,980 (46.4)
Household income level
Medical aid program group 192,806 (4.2)
Q1 in quartile (lowest) 827,964 (18.2)
Q2 in quartile 889,905 (19.5)
Q3 in quartile 1,090,853 (23.9)
Q4 in quartile (highest) 1,478,018 (32.4)
Unknown 77,060 (1.7)
Residence
Urban area 1,975,151 (43.3)
Rural area 2,581,455 (56.7)
Underlying disability
Mild to moderate 266,466 (5.8)
Severe 127,325 (2.8)
Underlying comorbidity
Congestive heart failure 200,149 (4.4)
Cardiac arrhythmias 172,593 (3.8)
Valvular disease 23,761 (0.5)
Pulmonary circulation disorders 12,893 (0.3)
Peripheral vascular disorders 538,161 (11.8)
Hypertension, uncomplicated 1,467,173 (32.2)
Hypertension, complicated 158,857 (3.5)
Paralysis 37,848 (0.8)
Other neurological disorders 195,909 (4.3)
Chronic pulmonary disease 1,239,793 (27.2)
Diabetes, uncomplicated 760,143 (16.7)
Diabetes, complicated 390,968 (8.6)
Hypothyroidism 218,182 (4.8)
Renal failure 73,103 (1.6)
Liver disease 971,674 (21.3)
Peptic ulcer disease, excluding bleeding 779,330 (17.1)
AIDS/HIV 2,586 (0.1)
Lymphoma 7,243 (0.2)
Metastatic cancer 35,586 (0.8)
Solid tumor without metastasis 290,745 (6.4)
Rheumatoid arthritis/collagen vascular diseases 237,796 (5.2)
Coagulopathy 48,892 (1.1)
Obesity 5,230 (0.1)
Weight loss 36,163 (0.8)
Fluid and electrolyte disorders 224,926 (4.9)
Blood loss anemia 10,055 (0.2)
Deficiency anemia 242,680 (5.3)
Alcohol abuse 82,568 (1.8)
Drug abuse 1,972 (0.0)
Psychoses 48,135 (1.1)
Depression 460,661 (10.1)
Prescription of other analgesics
Paracetamol 263,333 (5.8)
NSAIDs 1,267,814 (27.8)
Gabapentin or pregabalin 263,333 (5.8)
Underlying MSDs
Osteoarthritis 1,658,176 (36.4)
Low back pain 2,123,876 (46.6)
Neck pain 598,821 (13.1)
Gout 192,110 (4.2)
Other MSDs 1,974,681 (43.3)
Values are presented as median [interquartile range] or number (%).
AIDS = acquired immunodeficiency syndrome, HIV = human immunodeficiency virus, NSAID = nonsteroidal anti-inflammatory drug, MSD = musculoskeletal disease.

Opioid use and mortality

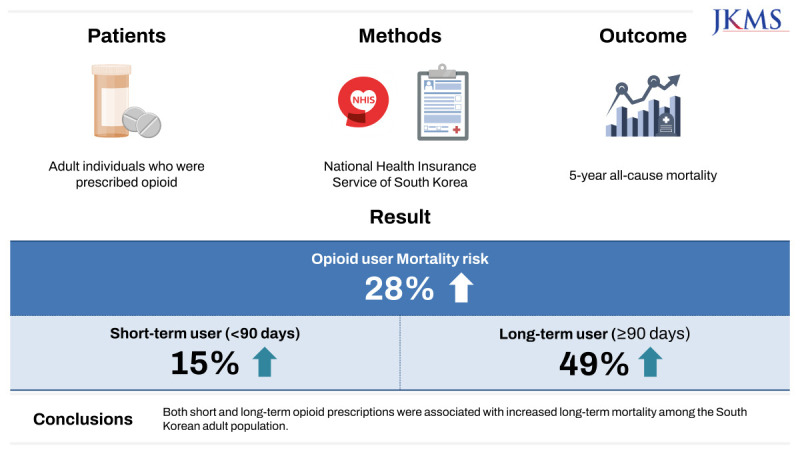
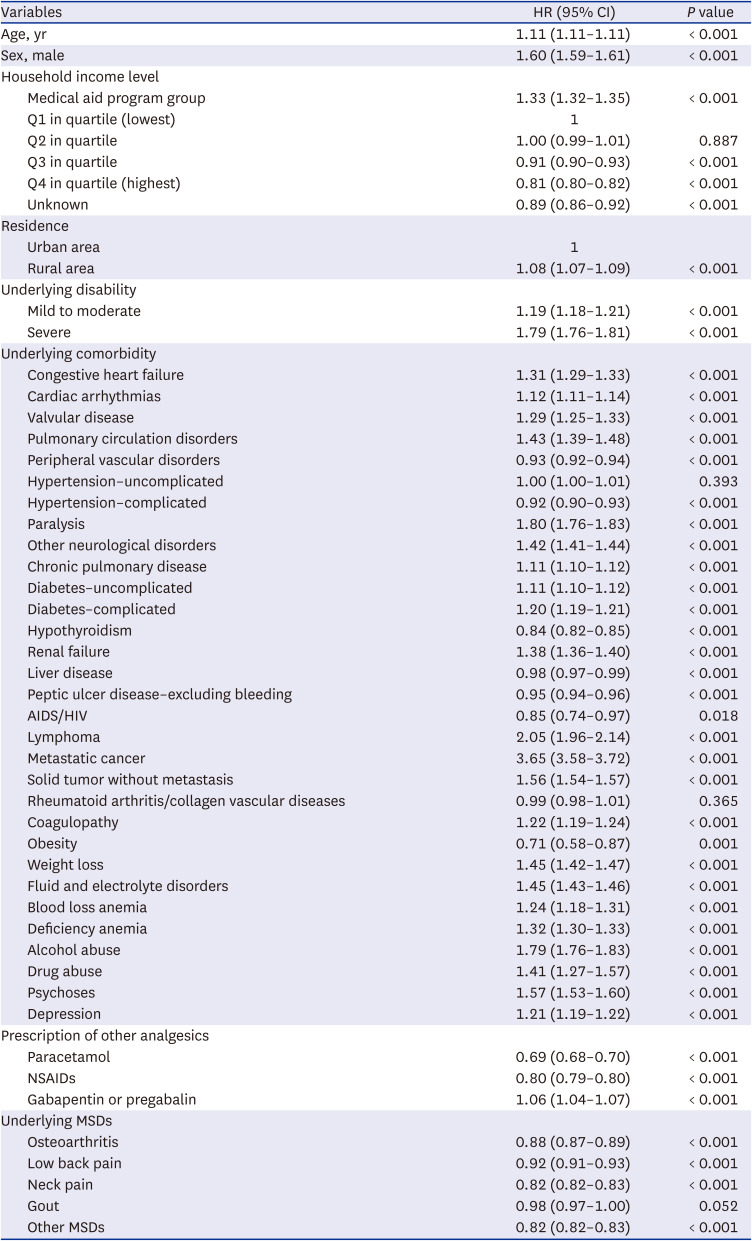
Table 2 shows the comparison of clinicopathological characteristics between opioid users and non-users. The 5-year all-cause mortality rate was higher in the non-user group (6.1%; 151,130/2,486,567) than in the opioid user group (5.6%; 115,216/2,070,039). However, as depicted in Table 3, after covariate adjustment, multivariable Cox regression model 1 showed that the opioid user group was associated with a 28% (HR, 1.28; 95% CI, 1.26–1.29; P < 0.001) higher risk of 5-year all-cause mortality than the non-user group. Moreover, the multivariable Cox regression model 2 showed that the opioid 1–89 days user group and opioid ≥ 90 days user group were associated with 15% (HR, 1.15; 95% CI, 1.14–1.17; P < 0.001) and 49% (HR, 1.49; 95% CI, 1.47–1.51; P < 0.001) higher risk of 5-year all-cause mortality, respectively, compared with the non-user group. All HRs with 95% CIs of the other covariates included in multivariable Model 1 are presented in Table 4. Old age (HR, 1.11; 95% CI, 1.11–1.11; P < 0.001), male sex (vs. female sex HR, 1.60; 95% CI, 1.59–1.61; P < 0.001), living in rural area (vs. urban area; HR, 1.08; 95% CI, 1.07–1.09; P < 0.001), mild to moderate disability (HR, 1.19; 95% CI, 1.18–1.21; P < 0.001), severe disability (HR, 1.79; 95% CI, 1.76–1.81; P < 0.001) and various underlying comorbidities were associated with an increased risk of 5-year all-cause mortality.
Table 2

Comparison of clinicopathological characteristics between opioid users and non-users
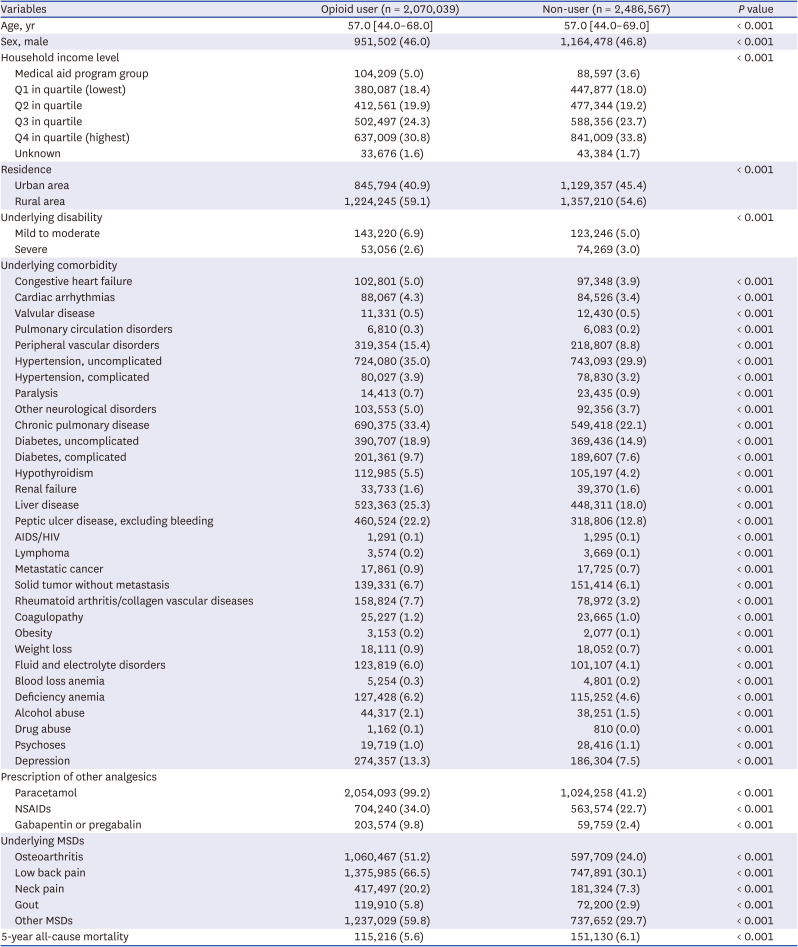
jkms-39-e82-i002
Variables Opioid user (n = 2,070,039) Non-user (n = 2,486,567) P value
Age, yr 57.0 [44.0–68.0] 57.0 [44.0–69.0] < 0.001
Sex, male 951,502 (46.0) 1,164,478 (46.8) < 0.001
Household income level < 0.001
Medical aid program group 104,209 (5.0) 88,597 (3.6)
Q1 in quartile (lowest) 380,087 (18.4) 447,877 (18.0)
Q2 in quartile 412,561 (19.9) 477,344 (19.2)
Q3 in quartile 502,497 (24.3) 588,356 (23.7)
Q4 in quartile (highest) 637,009 (30.8) 841,009 (33.8)
Unknown 33,676 (1.6) 43,384 (1.7)
Residence < 0.001
Urban area 845,794 (40.9) 1,129,357 (45.4)
Rural area 1,224,245 (59.1) 1,357,210 (54.6)
Underlying disability < 0.001
Mild to moderate 143,220 (6.9) 123,246 (5.0)
Severe 53,056 (2.6) 74,269 (3.0)
Underlying comorbidity
Congestive heart failure 102,801 (5.0) 97,348 (3.9) < 0.001
Cardiac arrhythmias 88,067 (4.3) 84,526 (3.4) < 0.001
Valvular disease 11,331 (0.5) 12,430 (0.5) < 0.001
Pulmonary circulation disorders 6,810 (0.3) 6,083 (0.2) < 0.001
Peripheral vascular disorders 319,354 (15.4) 218,807 (8.8) < 0.001
Hypertension, uncomplicated 724,080 (35.0) 743,093 (29.9) < 0.001
Hypertension, complicated 80,027 (3.9) 78,830 (3.2) < 0.001
Paralysis 14,413 (0.7) 23,435 (0.9) < 0.001
Other neurological disorders 103,553 (5.0) 92,356 (3.7) < 0.001
Chronic pulmonary disease 690,375 (33.4) 549,418 (22.1) < 0.001
Diabetes, uncomplicated 390,707 (18.9) 369,436 (14.9) < 0.001
Diabetes, complicated 201,361 (9.7) 189,607 (7.6) < 0.001
Hypothyroidism 112,985 (5.5) 105,197 (4.2) < 0.001
Renal failure 33,733 (1.6) 39,370 (1.6) < 0.001
Liver disease 523,363 (25.3) 448,311 (18.0) < 0.001
Peptic ulcer disease, excluding bleeding 460,524 (22.2) 318,806 (12.8) < 0.001
AIDS/HIV 1,291 (0.1) 1,295 (0.1) < 0.001
Lymphoma 3,574 (0.2) 3,669 (0.1) < 0.001
Metastatic cancer 17,861 (0.9) 17,725 (0.7) < 0.001
Solid tumor without metastasis 139,331 (6.7) 151,414 (6.1) < 0.001
Rheumatoid arthritis/collagen vascular diseases 158,824 (7.7) 78,972 (3.2) < 0.001
Coagulopathy 25,227 (1.2) 23,665 (1.0) < 0.001
Obesity 3,153 (0.2) 2,077 (0.1) < 0.001
Weight loss 18,111 (0.9) 18,052 (0.7) < 0.001
Fluid and electrolyte disorders 123,819 (6.0) 101,107 (4.1) < 0.001
Blood loss anemia 5,254 (0.3) 4,801 (0.2) < 0.001
Deficiency anemia 127,428 (6.2) 115,252 (4.6) < 0.001
Alcohol abuse 44,317 (2.1) 38,251 (1.5) < 0.001
Drug abuse 1,162 (0.1) 810 (0.0) < 0.001
Psychoses 19,719 (1.0) 28,416 (1.1) < 0.001
Depression 274,357 (13.3) 186,304 (7.5) < 0.001
Prescription of other analgesics
Paracetamol 2,054,093 (99.2) 1,024,258 (41.2) < 0.001
NSAIDs 704,240 (34.0) 563,574 (22.7) < 0.001
Gabapentin or pregabalin 203,574 (9.8) 59,759 (2.4) < 0.001
Underlying MSDs
Osteoarthritis 1,060,467 (51.2) 597,709 (24.0) < 0.001
Low back pain 1,375,985 (66.5) 747,891 (30.1) < 0.001
Neck pain 417,497 (20.2) 181,324 (7.3) < 0.001
Gout 119,910 (5.8) 72,200 (2.9) < 0.001
Other MSDs 1,237,029 (59.8) 737,652 (29.7) < 0.001
5-year all-cause mortality 115,216 (5.6) 151,130 (6.1) < 0.001
Values are presented as median [interquartile range] or number (%).
AIDS = acquired immunodeficiency syndrome, HIV = human immunodeficiency virus, NSAID = nonsteroidal anti-inflammatory drug, MSD = musculoskeletal disease.
Table 3

Multivariable cox regression model for 5-year all-cause mortality (event N = 266,177, 5.8%)
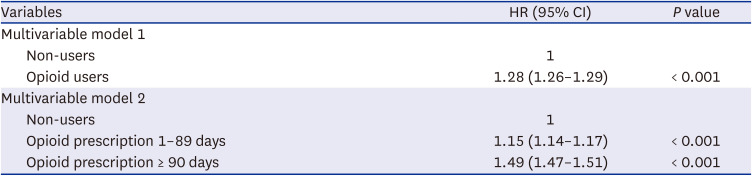
jkms-39-e82-i003
Variables HR (95% CI) P value
Multivariable model 1
Non-users 1
Opioid users 1.28 (1.26–1.29) < 0.001
Multivariable model 2
Non-users 1
Opioid prescription 1–89 days 1.15 (1.14–1.17) < 0.001
Opioid prescription ≥ 90 days 1.49 (1.47–1.51) < 0.001
HR = hazard ratio, CI = confidence interval.
Table 4

All HRs with 95% CIs of the other covariates included in multivariable model 1

jkms-39-e82-i004
Variables HR (95% CI) P value
Age, yr 1.11 (1.11–1.11) < 0.001
Sex, male 1.60 (1.59–1.61) < 0.001
Household income level
Medical aid program group 1.33 (1.32–1.35) < 0.001
Q1 in quartile (lowest) 1
Q2 in quartile 1.00 (0.99–1.01) 0.887
Q3 in quartile 0.91 (0.90–0.93) < 0.001
Q4 in quartile (highest) 0.81 (0.80–0.82) < 0.001
Unknown 0.89 (0.86–0.92) < 0.001
Residence
Urban area 1
Rural area 1.08 (1.07–1.09) < 0.001
Underlying disability
Mild to moderate 1.19 (1.18–1.21) < 0.001
Severe 1.79 (1.76–1.81) < 0.001
Underlying comorbidity
Congestive heart failure 1.31 (1.29–1.33) < 0.001
Cardiac arrhythmias 1.12 (1.11–1.14) < 0.001
Valvular disease 1.29 (1.25–1.33) < 0.001
Pulmonary circulation disorders 1.43 (1.39–1.48) < 0.001
Peripheral vascular disorders 0.93 (0.92–0.94) < 0.001
Hypertension–uncomplicated 1.00 (1.00–1.01) 0.393
Hypertension–complicated 0.92 (0.90–0.93) < 0.001
Paralysis 1.80 (1.76–1.83) < 0.001
Other neurological disorders 1.42 (1.41–1.44) < 0.001
Chronic pulmonary disease 1.11 (1.10–1.12) < 0.001
Diabetes–uncomplicated 1.11 (1.10–1.12) < 0.001
Diabetes–complicated 1.20 (1.19–1.21) < 0.001
Hypothyroidism 0.84 (0.82–0.85) < 0.001
Renal failure 1.38 (1.36–1.40) < 0.001
Liver disease 0.98 (0.97–0.99) < 0.001
Peptic ulcer disease–excluding bleeding 0.95 (0.94–0.96) < 0.001
AIDS/HIV 0.85 (0.74–0.97) 0.018
Lymphoma 2.05 (1.96–2.14) < 0.001
Metastatic cancer 3.65 (3.58–3.72) < 0.001
Solid tumor without metastasis 1.56 (1.54–1.57) < 0.001
Rheumatoid arthritis/collagen vascular diseases 0.99 (0.98–1.01) 0.365
Coagulopathy 1.22 (1.19–1.24) < 0.001
Obesity 0.71 (0.58–0.87) 0.001
Weight loss 1.45 (1.42–1.47) < 0.001
Fluid and electrolyte disorders 1.45 (1.43–1.46) < 0.001
Blood loss anemia 1.24 (1.18–1.31) < 0.001
Deficiency anemia 1.32 (1.30–1.33) < 0.001
Alcohol abuse 1.79 (1.76–1.83) < 0.001
Drug abuse 1.41 (1.27–1.57) < 0.001
Psychoses 1.57 (1.53–1.60) < 0.001
Depression 1.21 (1.19–1.22) < 0.001
Prescription of other analgesics
Paracetamol 0.69 (0.68–0.70) < 0.001
NSAIDs 0.80 (0.79–0.80) < 0.001
Gabapentin or pregabalin 1.06 (1.04–1.07) < 0.001
Underlying MSDs
Osteoarthritis 0.88 (0.87–0.89) < 0.001
Low back pain 0.92 (0.91–0.93) < 0.001
Neck pain 0.82 (0.82–0.83) < 0.001
Gout 0.98 (0.97–1.00) 0.052
Other MSDs 0.82 (0.82–0.83) < 0.001
HR = hazard ratio, CI = confidence interval, AIDS = acquired immunodeficiency syndrome, HIV = human immunodeficiency virus, NSAID = nonsteroidal anti-inflammatory drug, MSD = musculoskeletal disease.

DISCUSSION

This population-based cohort study showed that opioid prescriptions are associated with increased long-term mortality within the adult population of South Korea. Moreover, this association was significantly evident in both short- and long-term opioid prescription periods. These findings suggest that both long-term and short-term opioid use could contribute to a worsened long-term prognosis among adults.
Long-term opioid therapy poses many risks and is a major public health concern, as it can lead to dependence, addiction, misuse, and overdose.17 In the United States, death due to opioid-related overdoses have tripled, increasing from 2006 to 2016, and health care costs, criminal justice expenses, and productivity losses associated with opioid misuse were estimated to total $78.5 billion.1819 Moreover, cohort studies in Korea have reported that the number of opioid users in the general population has increased and that opioid use is associated with increased mortality,111220 suggesting that long-term opioid use is becoming a major public health concern that cannot be ignored in Korea.
As a direct effect, long-term opioid therapy can cause various medical problems,21 which could be related to increased long-term mortality. The most common cause of mortality from an opioid overdose or misuse is opioid-induced respiratory depression.22 Opioid-induced respiratory depression could be linked to obstructive sleep apnoea because opioids impair upper airway function and disrupt respiratory control, resulting in central apnoea, upper airway obstruction, and hypoxemia during sleep.23 Long-term opioid therapy may induce immune system alterations, which can be elucidated by modifications in both the innate and adaptive immune systems.24 The immunosuppression associated with opioid prescription was linked to an increased risk of infection such as pneumonia25 and cancer through carcinogenesis due to long-term opioid therapy.26 Moreover, chronic opioid therapy was related to an elevated incidence rate ratio of 2.66 (95% CI, 2.30–3.08) for myocardial infarction compared with that in the general population.27 This is because chronic opioid use was associated with alterations in the serum concentrations of triglycerides and total high-density lipoprotein and low-density lipoprotein cholesterol,28 which could elevate risk of myocardial infarction.24
The exact physical condition that warranted opioid prescription could have also affected the results of this study. It was well reported that patients with chronic pain had higher prevalence of all comorbidities than those without chronic pain.29 In patients with knee osteoarthritis, comorbid hypertension, gastrointestinal disease, and depressed mood were independently associated with opioid use.30 In this study, as shown in Table 2, the opioid user group shows a higher proportion of 26 medical illnesses with regard to the Elixhauser Comorbidity index than the non-user group. Thus, the physical conditions related to opioid prescription may increase the 5-year all-cause mortality rate in the opioid user groups in this study.
Although the adverse effects of long-term opioid therapy are well established, the effect of short-term opioid therapy on long-term mortality remains to be identified. We included patients who were prescribed opioids for 1–89 days in 2016 and analysed their impact on 5-year all-cause mortality using large sample sizes. Short-term opioid users are at risk of progressing to long-term opioid use,15 which may worsen long-term survival outcomes. However, the corresponding clinical significance could be questionable in this study as the risk among short-term opioid users was low with an HR of 1.15 (95% CI, 1.14–1.17) based on a sample size of 4,556,606 individuals. Therefore, further studies to identify the impact of both short- and long-term opioid use on long-term mortality are warranted.
Additional important findings regarding 5-year all-cause mortality were depicted among the covariates in multivariable modelling, regardless of opioid use. Poor household income (medical aid program group) was a significant risk factor for increased 5-year all-cause mortality, whereas the high household income group (Q3 and Q4) was associated with decreased 5-year all-cause mortality. Income inequality was associated with mortality in the United States,31 which was also observed in South Korea in the present study. Living in rural areas was also associated with an increased 5-year all-cause mortality compared to those living in urban areas. Indeed, it has been reported that accessibility to healthcare services could significantly affect mortality,32 and those living in rural areas have limited access to healthcare service centres compared with those living in urban areas, which may have affected the results of this study. Moreover, we included underlying disabilities in addition to the 31 underlying diseases calculated using the Elixhauser comorbidity index. Therefore, our findings were derived from a robust analysis using several covariates.
This study had several limitations. First, opioid dosage was not considered in this study. Second, some important variables such as body mass index, smoking history, and alcohol consumption were not included as covariates because of the lack of information in the NHIS database. Third, because our study used South Korean data from a nationwide registration database, generalizability to other countries may be limited. Finally, residual or unmeasured confounders may have affected the results.
In conclusion, this population-based cohort study showed that opioid prescriptions are associated with increased long-term mortality in adults. Moreover, this association was significantly evident in both short- and long-term opioid users. Future studies to confirm the mechanism between opioid prescriptions and long-term mortality, considering the duration, dosage, and potency of opioid prescriptions, are warranted.

Notes

Funding: This study was supported by Hanlim Pharmaceutical, Seoul, Korea (grant number: 06-2023-0218). The sponsor did not influence the study.

Disclosure: The authors have no potential conflicts of interest to disclose.

Author Contributions:

  • Conceptualization: Oh TK, Song IA.

  • Data curation: Oh TK.

  • Formal analysis: Oh TK.

  • Methodology: Song IA.

  • Writing - original draft: Oh TK.

  • Writing - review & editing: Song IA.

References

1. Judd D, King CR, Galke C. The opioid epidemic: a review of the contributing factors, negative consequences, and best practices. Cureus. 2023; 15(7):e41621. PMID: 37565101.
2. Ballantyne JC, LaForge SK. Opioid dependence and addiction during opioid treatment of chronic pain. Pain. 2007; 129(3):235–255. PMID: 17482363.
3. Celentano D. The worldwide opioid pandemic: epidemiologic perspectives. Epidemiol Rev. 2020; 42(1):1–3. PMID: 33355347.
4. Robert M, Jouanjus E, Khouri C, Fouilhé Sam-Laï N, Revol B. The opioid epidemic: a worldwide exploratory study using the WHO pharmacovigilance database. Addiction. 2023; 118(4):771–775. PMID: 36331523.
5. Benyamin R, Trescot AM, Datta S, Buenaventura R, Adlaka R, Sehgal N, et al. Opioid complications and side effects. Pain Physician. 2008; 11(2):Suppl. S105–S120. PMID: 18443635.
6. Rogers TJ, Roy S. Editorial: The role of opioid receptors in immune system function. Front Immunol. 2022; 12:832292. PMID: 35082800.
7. Baldini A, Von Korff M, Lin EH. A review of potential adverse effects of long-term opioid therapy: a practitioner’s guide. Prim Care Companion CNS Disord. 2012; 14(3):27252.
8. Ekholm O, Kurita GP, Hjsted J, Juel K, Sjgren P. Chronic pain, opioid prescriptions, and mortality in Denmark: a population-based cohort study. Pain. 2014; 155(12):2486–2490. PMID: 25020002.
9. Lee PF, Li CY, Liu YC, Chiu CT, Hou WH. Population-based study on the all-cause and cause-specific risks of mortality among long-term opioid analgesics users without cancer in Taiwan. Healthcare (Basel). 2021; 9(11):1402. PMID: 34828449.
10. Pearce LA, Min JE, Piske M, Zhou H, Homayra F, Slaunwhite A, et al. Opioid agonist treatment and risk of mortality during opioid overdose public health emergency: population based retrospective cohort study. BMJ. 2020; 368:m772. PMID: 32234712.
11. Oh TK, Jeon YT, Choi JW. Trends in chronic opioid use and association with five-year survival in South Korea: a population-based cohort study. Br J Anaesth. 2019; 123(5):655–663. PMID: 31558315.
12. Song IA, Choi HR, Oh TK. Long-term opioid use and mortality in patients with chronic non-cancer pain: Ten-year follow-up study in South Korea from 2010 through 2019. EClinicalMedicine. 2022; 51:101558. PMID: 35875817.
13. von Elm E, Altman DG, Egger M, Pocock SJ, Gøtzsche PC, Vandenbroucke JP, et al. The strengthening the reporting of observational studies in epidemiology (STROBE) statement: guidelines for reporting observational studies. Lancet. 2007; 370(9596):1453–1457. PMID: 18064739.
14. Lee J, Lee JS, Park SH, Shin SA, Kim K. Cohort profile: the national health insurance service–national sample cohort (NHIS-NSC), South Korea. Int J Epidemiol. 2017; 46(2):e15. PMID: 26822938.
15. Zin CS, Nazar NI, Rahman NS, Ahmad WR, Rani NS, Ng KS. Patterns of initial opioid prescription and its association with short-term and long-term use among opioid-naïve patients in Malaysia: a retrospective cohort study. BMJ Open. 2019; 9(7):e027203.
16. van Walraven C, Austin PC, Jennings A, Quan H, Forster AJ. A modification of the Elixhauser comorbidity measures into a point system for hospital death using administrative data. Med Care. 2009; 47(6):626–633. PMID: 19433995.
17. Martell BA, O’Connor PG, Kerns RD, Becker WC, Morales KH, Kosten TR, et al. Systematic review: opioid treatment for chronic back pain: prevalence, efficacy, and association with addiction. Ann Intern Med. 2007; 146(2):116–127. PMID: 17227935.
18. Chen Q, Larochelle MR, Weaver DT, Lietz AP, Mueller PP, Mercaldo S, et al. Prevention of prescription opioid misuse and projected overdose deaths in the United States. JAMA Netw Open. 2019; 2(2):e187621. PMID: 30707224.
19. Florence CS, Zhou C, Luo F, Xu L. The economic burden of prescription opioid overdose, abuse, and dependence in the United States, 2013. Med Care. 2016; 54(10):901–906. PMID: 27623005.
20. Kim J, Shin SJ, Yoon J, Kim HS, Lee JW, Kim YS, et al. Recent trends in opioid prescriptions in Korea from 2002 to 2015 based on the Korean NHIS-NSC cohort. Epidemiol Health. 2022; 44:e2022029. PMID: 35209705.
21. Von Korff M, Kolodny A, Deyo RA, Chou R. Long-term opioid therapy reconsidered. Ann Intern Med. 2011; 155(5):325–328. PMID: 21893626.
22. Bateman JT, Saunders SE, Levitt ES. Understanding and countering opioid-induced respiratory depression. Br J Pharmacol. 2023; 180(7):813–828. PMID: 34089181.
23. Freire C, Sennes LU, Polotsky VY. Opioids and obstructive sleep apnea. J Clin Sleep Med. 2022; 18(2):647–652. PMID: 34672945.
24. Diasso PD, Birke H, Nielsen SD, Main KM, Højsted J, Sjøgren P, et al. The effects of long-term opioid treatment on the immune system in chronic non-cancer pain patients: a systematic review. Eur J Pain. 2020; 24(3):481–496. PMID: 31705699.
25. Edelman EJ, Gordon KS, Crothers K, Akgün K, Bryant KJ, Becker WC, et al. Association of prescribed opioids with increased risk of community-acquired pneumonia among patients with and without HIV. JAMA Intern Med. 2019; 179(3):297–304. PMID: 30615036.
26. Kosciuczuk U, Knapp P, Lotowska-Cwiklewska AM. Opioid-induced immunosuppression and carcinogenesis promotion theories create the newest trend in acute and chronic pain pharmacotherapy. Clinics (Sao Paulo). 2020; 75:e1554. PMID: 32215455.
27. Carman WJ, Su S, Cook SF, Wurzelmann JI, McAfee A. Coronary heart disease outcomes among chronic opioid and cyclooxygenase-2 users compared with a general population cohort. Pharmacoepidemiol Drug Saf. 2011; 20(7):754–762. PMID: 21567652.
28. Solin AV, Lyashev AY, Lyashev YD. Effects of opioid peptides on changes in lipid metabolism in rats subjected to swimming stress. Bull Exp Biol Med. 2017; 162(3):313–315. PMID: 28091903.
29. Foley HE, Knight JC, Ploughman M, Asghari S, Audas R. Association of chronic pain with comorbidities and health care utilization: a retrospective cohort study using health administrative data. Pain. 2021; 162(11):2737–2749. PMID: 33902092.
30. King LK, Marshall DA, Jones CA, Woodhouse LJ, Ravi B, Faris PD, et al. Are medical comorbidities contributing to the use of opioid analgesics in patients with knee osteoarthritis? Osteoarthritis Cartilage. 2020; 28(8):1030–1037. PMID: 32387761.
31. Kaplan GA, Pamuk ER, Lynch JW, Cohen RD, Balfour JL. Inequality in income and mortality in the United States: analysis of mortality and potential pathways. BMJ. 1996; 312(7037):999–1003. PMID: 8616393.
32. GBD 2015 Healthcare Access and Quality Collaborators. Healthcare Access and Quality Index based on mortality from causes amenable to personal health care in 195 countries and territories, 1990–2015: a novel analysis from the Global Burden of Disease Study 2015. Lancet. 2017; 390(10091):231–266. PMID: 28528753.

SUPPLEMENTARY MATERIAL

Supplementary Data 1

ICD-10 codes of musculoskeletal disease
jkms-39-e82-s001.doc
TOOLS
Similar articles