

 PDF
PDF Citation
 Print
Print


INTRODUCTION
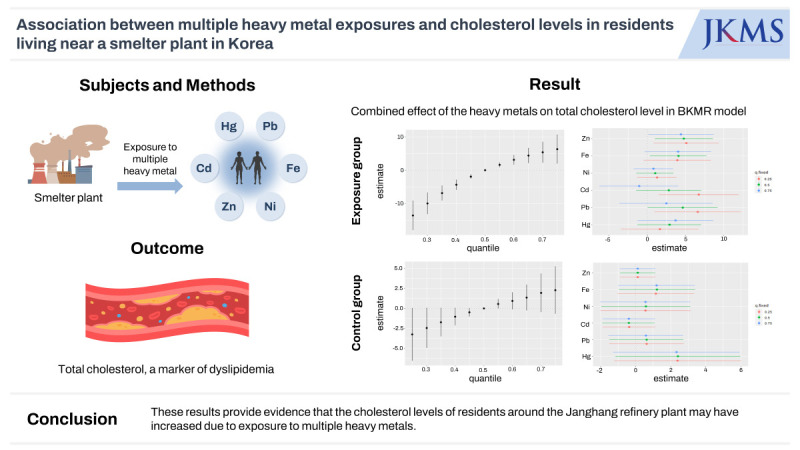
Dyslipidemia, one of the most well-known risk factors for cardiovascular diseases,1 is a serious global public health concern that requires appropriate prevention and management programs.2 Dyslipidemia occurs because of complex interactions between environmental and genetic factors.3 Heavy metals, which are major environmental pollutants, are known risk factors for dyslipidemia.4 Heavy metals easily enter the human body through water, air, and food intake and tend to accumulate in the body as they are not degraded or excreted efficiently.5 Among heavy metals, chromium, iron (Fe), zinc (Zn), arsenic, strontium (Sr), cadmium (Cd), and lead (Pb) have been reported to be associated with dyslipidemia.67 Fe and Zn are essential trace elements in humans that have been reported to promote lipid metabolism in vivo.8 Sr and Cd are known to inhibit antioxidant activity in normal cells and induce hyperlipidemia in mice.910 Exposure to Hg and Pb stimulates lipid peroxidation, increases triglyceride (TG) levels, and induces hyperlipidemia in animal models.1112 Generally, the health effects of exposure to multiple harmful chemicals are evaluated using multiple linear regression models that adjust for the effects of confounding variables and estimate the independent effects of each harmful chemical.131415 However, if multiple co-interacting heavy metals exert combined effects, multicollinearity and non-linear mixed effects are possible. In particular, when exposed to various heavy metals that interact in a complex manner, such as in residents living near refinery plants, it is necessary to evaluate the comprehensive effects by considering the interactions between heavy metals when evaluating the relationship between heavy metal exposure and its effects on health. Bayesian kernel machine regression (BKMR) is a machine learning model used to evaluate the effects of multiple simultaneous exposures on health. This method has the advantage of measuring the overall mixed effects and evaluating the effects of individual predictors and confounders in a non-linear and non-additive manner.16 In environmental epidemiology, several studies have used BKMR to evaluate the overall effects of multiple risk factors on health.171819 In this study, BKMR was used to investigate the association between dyslipidemia marker levels and the combined effect of blood Hg, Pb, Cd, Fe, Zn, and nickel (Ni) in residents living near a smelter in Korea.
METHODS
Study participants
The purpose and design of this study have been described in detail in a previous report.20 The study participants comprised individuals aged 30 years or older who resided within 4 km radius of the Janghang Copper Refinery (exposed group) and those with comparable ages and lifestyles residing in a rural area of Seocheon County situated approximately 15 km from the refinery (control group). We enrolled 985 voluntary participants between May 2008 and August 2008; 13 individuals (1.32%) with missing data were excluded. Finally, data from 972 individuals (exposed group: 567, control group: 405) were analyzed. Fasting blood samples were collected from all the participants for heavy metal measurements; samples were stored at −80°C until further analysis.
Determination of toxic metal levels in the blood
The amounts of Hg, Pb, Cd, Fe, Zn, and Ni in the blood were measured. A direct Hg analyzer (DMA 80, Milestone) and the gold amalgam method were used to evaluate blood Hg concentrations. Briefly, 100 mL of well-mixed blood was placed in the analyzer’s sample container and analyzed immediately. A polarized Zeeman atomic absorption spectrophotometer (Model Z-2700, Hitachi, Tokyo, Japan) was used to determine blood Pb levels. A flameless atomic absorption spectrophotometer (Model Z-8270, Hitachi) equipped with a Zeeman graphite furnace was used to determine Cd levels in the blood. Inductively coupled plasma mass spectrometry (ICP-MS; Perkin Elmer, Waltham, MA, USA) was used to measure the levels of plasma Zn and Ni; for the analysis, 0.1 mL of plasma was diluted to 2.0 mL with 1.0% nitric acid. We used the colorimetric method and 2-Nitroso-5-[N-n-propyl-N-(3-sulfopropyl)amino]phenol (Nitroso-PSAP; Shinyang Chemical, Busan, Korea) to quantify the Fe levels in serum; this reagent selectively chelates Fe2+ and produces a brightly colored product (absorption at 750 nm).
Serum lipid profile measurement
Whole blood samples were collected in serum-separation tubes. The samples were mixed by inverting the tubes and were subsequently left to rest for 15 minutes. They were then centrifuged at 2,000 ×g. The total cholesterol (TC), TG, and high-density lipoprotein cholesterol (HDL-C) levels were measured using an automatic analyzer (ADVIA 1800; Siemens Medical Solutions, Ann Arbor, MI, USA) at wavelengths 505/694 nm, 505/694 nm, and 596 nm, respectively.
Covariates
In this study, we selected age, body mass index, sex (male, female), household income (low income: less than 760 USD/month, high income: 760 USD/month or more), smoking status (non-smoker, former smoker, current smoker), and alcohol consumption status (non-drinker, former drinker, current drinker) as covariates due to their widely recognized correlations with lipid metabolism.1021
In this survey, we categorized the study participants based on their monthly household income: less than or equal to 1 million Korean won, 1−2 million won, 2−3 million won, 3−4 million won, and more than 4 million won. However, due to the demographic characteristics of rural areas with a significant elderly population, a majority of the respondents fell into the less than or equal to than 1 million won category. Consequently, we consolidated the respondents into two groups based on the 1 million won threshold (approximately, 760 USD).
Statistical analyses
We transformed the blood Hg, Pb, Cd, Fe, Zn, and Ni distributions into their natural logarithmic forms and used them in the regression model because they were highly skewed to the right. To control for confounding variables, we included age, sex, drinking and smoking status, and monthly household income as covariates in the regression model. Multiple linear regression models were used to assess the relationship between heavy metal levels and dyslipidemia markers. The multiple linear regression equation is as follows:
where Y is the cholesterol or TG level; Hg, Pb, Cd, Fe, Zn, and Ni are the centered log concentrations of Hg, Pb, Cd, Fe, Zn, and Ni, respectively; and Z= Z1,…, Zp are the potential confounders. We performed a BKMR analysis to estimate the combined effects of exposure to the six heavy metals and the non-linear effects of heavy metals.16 The BKMR model is as follows:
A comprehensive analysis involving 10,000 iterations was conducted using the Markov-chain Monte Carlo algorithm to access potential interactions between the exposure and response curves for all metals or for individual metals while maintaining the exposure levels of the remaining metals at the 25th, median, or 75th percentile. The impact of mixed exposure was assessed by calculating the post-estimation means and 95% confidence intervals (CIs) of dyslipidemia markers associated with changes in the levels of individual heavy metals. To evaluate the overall combined effect, the expected changes in dyslipidemia markers associated with concurrent changes in the levels of all six heavy metals were estimated and compared to the median exposure level of the heavy metal mixture. In addition, by fixing the concentrations of the remaining five heavy metals at their 25th, 50th, and 75th percentile values, we estimated the anticipated changes in dyslipidemia markers corresponding to the interquartile range (IQR) change in the concentration of each individual heavy metal. Finally, we assessed the dose-response relationship of each mixed component and potential interactions between the metals by maintaining the concentrations of the other heavy metals at the 25th, 50th, and 75th percentiles. All statistical analyses were performed using the R software (version 4.2.3; R Foundation for Statistical Computing, Vienna, Austria). A two-sided P value < 0.05 was considered statistically significant.
RESULTS
Study population characteristics
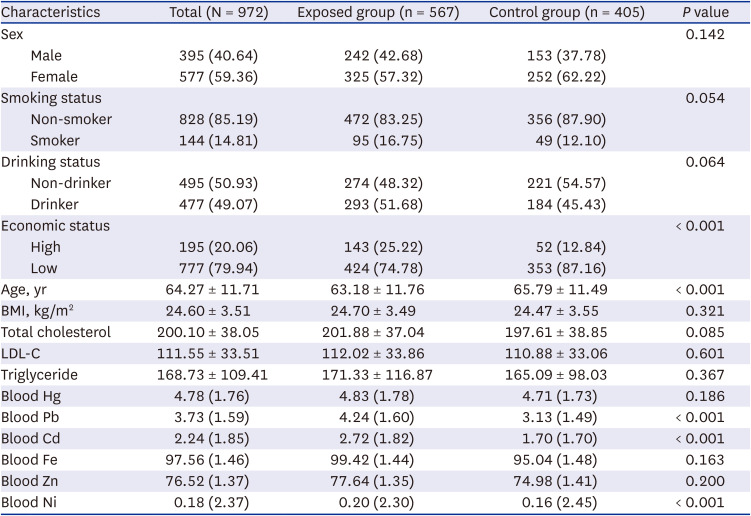
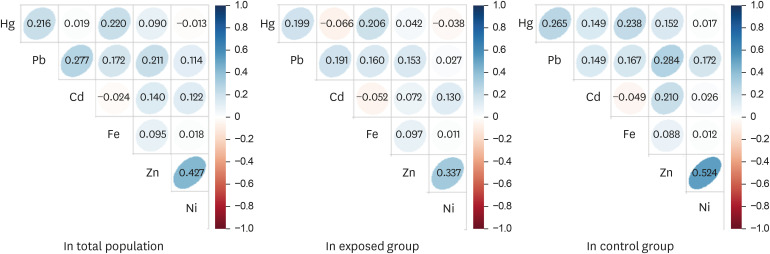
The participants’ demographic characteristics are summarized in Table 1. Among the total participants, 40.64% (n = 395) were men, and 14.81% (n = 144) were smokers. A total of 777 participants (79.94%) had an average monthly income of less than 1,000,000 won. The average age of the participants was 64.27 ± 11.71 years, and the average age of the control group was relatively higher than that of the exposed group. The geometric mean concentrations of Pb, Cd, and Ni in the blood were higher in the exposed group than in the control group. Pearson’s correlation coefficients for the log-transformed blood heavy metal concentrations were 0.43 for Zn and Ni, 0.28 for Pb and Cd, and 0.22 for Hg and Pb (Fig. 1).
Table 1
Demographic characteristics of the study participants
Multivariable regression analyses
Table 2 shows the relationship between blood levels of heavy metals and dyslipidemia markers using multivariate linear regression models with adjustments for various confounding factors. In all participants, the TC level increased significantly with blood Pb (β = 7.604, 95% CI, 1.661, 13.547) and Fe (β = 13.180, 95% CI, 6.719, 19.642) levels. Blood Fe (β = 12.320, 95% CI, 3.738, 20.901) and Zn (β = 14.842, 95% CI, 4.122, 25.263) in the exposed group and blood Hg (β = 9.838, 95% CI, 2.133, 17.542) and Fe (β = 14.812, 95% CI, 4.807, 24.754) in the control group were significantly associated with TC. Low-density lipoprotein cholesterol (LDL-C) showed a statistically significant relationship with Hg (β = 9.604, 95% CI, 2.937, 16.272) only in the control group. Regarding TG, there was a significant association with blood Fe (β = 51.835, 95% CI, 33.774, 69.896) in the total population, with Fe (β = 48.552, 95% CI, 22.912, 74.193) and Zn (β = 39.887, 95% CI, 7.855, 71.919) in the exposed group, and with blood Fe (β = 56.651, 95% CI, 31.345, 81.958) in the control group.
Table 2
Associations of blood Hg, Pb, Cd, Fe, Zn, and Ni levels with dyslipidemia markers
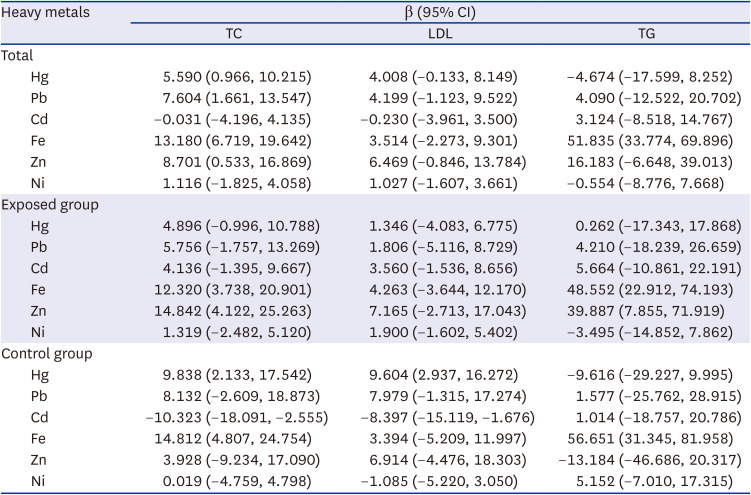
The model was adjusted for sex, age, smoking, drinking, economic status, and body mass index.
Estimated change from multivariate linear regression using ordinary least squares.
Hg = mercury, Pb = lead, Cd = cadmium, Fe = iron, Zn = zinc, Ni = nickel, CI = confidence interval, TC = total cholesterol, LDL = low-density lipoprotein, TG = triglyceride.
BKMR analyses
As a result of estimating the change in TC levels when the concentration of the six heavy metals changed to a specific critical value (25th–75th percentile) compared with the median concentration of each heavy metal, the joint effect of the six heavy metals was found to be significantly associated with TC levels below the 45th percentile and above the 55th percentile. The estimate at the 25th percentile was −10.35, and the estimate at the 75th percentile was 7.16 (Fig. 2A). We assessed which of the six metals significantly affected TC levels by estimating the univariate summaries of the changes in TC levels associated with the IQR changes for each heavy metal. We observed that blood Pb had the greatest effect on TC levels, and blood Fe levels also had a significant effect on TC levels. For Hg, significant associations were observed only when the concentrations of the other metals were at the 50th and 75th percentiles. Blood Fe, Pb, and Hg levels had the greatest effect on TC levels when the concentrations of the other heavy metals were at the 75th percentile, compared with when the other heavy metal levels were at the 50th and 25th percentiles. When the other five heavy metal concentrations were fixed at the 25th, 50th, and 75th percentiles, estimates of the TC levels by IQR increase of blood Fe were 3.84 (95% CI, 0.43, 7.26), 4.68 (95% CI, 1.79, 7.58), and 5.40 (95% CI, 2.03, 8.76), respectively. When the other five heavy metal concentrations were fixed at the 25th, 50th, and 75th percentiles, estimates of the TC levels by IQR increase of blood Pb were 5.14 (95% CI, 1.33, 8.96), 5.45 (95% CI, 2.05, 8.85), and 5.66 (95% CI, 1.66, 9.66), respectively (Fig. 2B). When the other five heavy metal concentrations were fixed at the 25th, 50th, and 75th percentiles, estimates of the TC levels by IQR increase of blood Hg were 2.99 (95% CI, −0.76, 6.74), 3.74 (95% CI, 0.51, 6.97), and 4.37 (95% CI, 0.79, 7.95), respectively (Fig. 2B).
Fig. 2
Combined effect of the heavy metals on TC level on the total population. The Bayesian kernel machine regression model was used to assess the effect on the total population. The model was adjusted for age, sex, drinking, smoking, economic status, and body mass index. (A) The overall effect of the exposure to the combined metals: 95% CI of the estimate of the TC value at each quantile compared with that when all heavy metals are set at the median concentration (B) Single pollutant association: 95% CI of TC estimates for the interquartile range change of each heavy metal concentration when the concentrations of the remaining heavy metals are fixed at the 25th, 50th, and 75th percentiles (C) Univariate exposure-response functions and 95% confidence bands for each heavy metal, with the other pollutants fixed at the 50th percentile. (D) Bivariate exposure-response functions, that is, when the concentrations of other heavy metals are the medians and the concentrations of expos2 metal (row) are at the 25th, 50th, and 75th percentile, respectively, it shows the change in TC concentration according to the change in expos1 (column) level.
Zn = zinc, Fe = iron, Ni = nickel, Cd = cadmium, Pb = lead, Hg = mercury, TC = total cholesterol, CI = confidence interval.
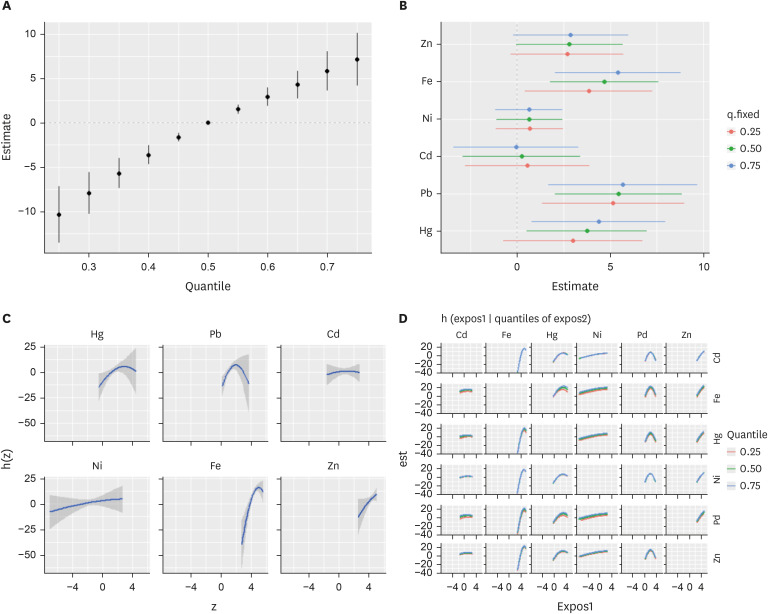
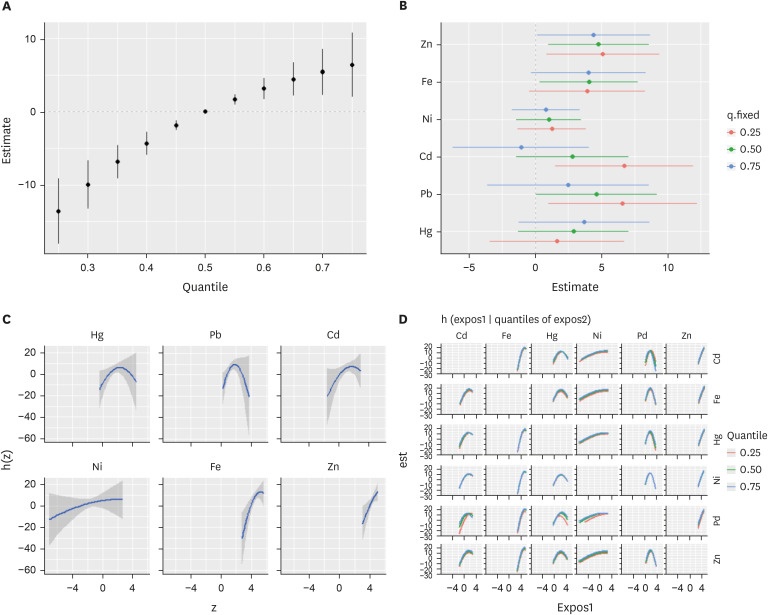
By estimating the exposure-response function between each heavy metal and TC levels when the other five metals were fixed at the median, we found that there was a non-linear relationship between blood Hg, Pb, and Fe concentrations and TC levels. In contrast, blood Ni and Zn were positively correlated with TC levels, and blood Cd concentration had little effect on the changes in TC concentration (Fig. 2C-D). BKMR analysis was performed on the exposed group. The combined effect of the six heavy metals was found to be significantly associated with TC levels below the 45th percentile and above the 55th percentile. In the exposed group, the range of the combined effect between the 25th and 75th percentiles of the six metals on the TC level was larger than that in the total population (25th: −13.55, 75th: 6.33) (Fig. 3A). When the concentrations of the other five heavy metals were fixed at the 25th or 50th percentiles, IQR increases in the levels of Zn, Cd, and Pb in the blood and TC concentration showed a significant association. When the concentrations of the other five heavy metals were fixed at the 75th percentile, only the IQR increase in the blood Zn concentration showed a significant association with the TC level. Depending on the concentrations of the other five heavy metals, the effect of the IQR increase in blood Pb, Cd, and Hg on the TC level was different. In particular, the higher the concentration of the other five heavy metals, the lower the effect of the IQR increase in Pb and Cd concentrations on the TC concentration (Fig. 3B). When the other five metals were fixed at the median, all heavy metals, except blood Zn, showed a non-linear relationship with the TC concentration (Fig. 3C-D).
Fig. 3
Combined effect of heavy metals on TC level on the exposed group. The Bayesian Kernel Machine Regression model was used to assess the effect on the exposed group. The model was adjusted for age, sex, drinking, smoking, economic status, and body mass index. (A) The overall effect of the exposure to the combined metals: 95% CI of the estimate of the TC value at each quantile compared with that when all heavy metals are set at the median concentration (B) Single pollutant association: 95% CI of TC estimates for the interquartile range change of each heavy metal concentration when the concentrations of the remaining heavy metals are fixed at the 25th, 50th, and 75th percentiles (C) Univariate exposure-response functions and 95% confidence bands for each metal, with the other pollutants fixed at the 50th percentile. (D) Bivariate exposure-response functions, that is, when the concentrations of other heavy metals are the medians and the concentrations of expos2 metal (row) are at the 25th, 50th, and 75th percentile, respectively, it shows the change in TC concentration according to the change in expos1 (column) level.
Zn = zinc, Fe = iron, Ni = nickel, Cd = cadmium, Pb = lead, Hg = mercury, TC = total cholesterol, CI = confidence interval.
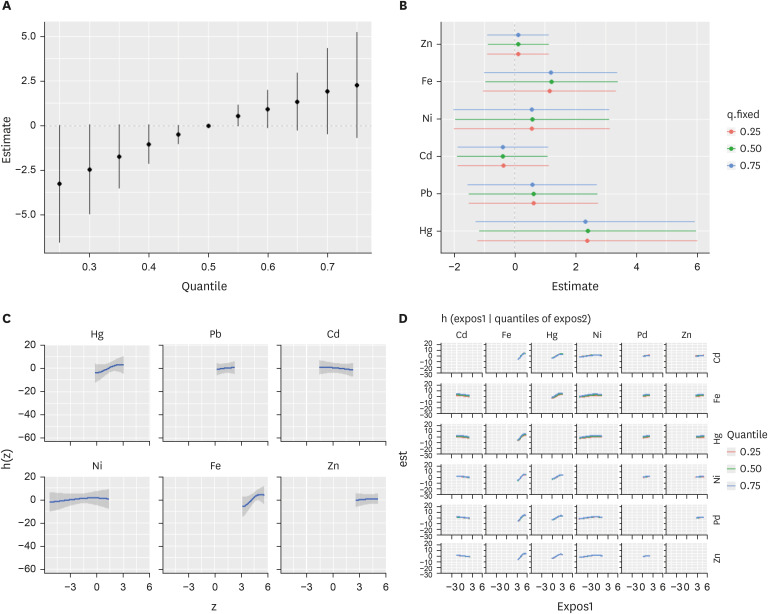
In the control group, the combined effects of the concentration changes of the six heavy metals on the TC concentration were not statistically significant (Fig. 4A). When the concentrations of the other five heavy metals were fixed at the 75th percentile, no association with heavy metals was observed, and an increased IQR concentration of the heavy metals had a significant effect on the TC concentration (Fig. 4B). When the other five metals were fixed at the median, blood Hg and Fe levels showed a positive linear association with TC levels, whereas blood Cd levels showed a negative association. Blood Pb, Ni, and Zn levels did not affect TC levels (Fig. 4C-D).
Fig. 4
Combined effect of heavy metals on total cholesterol (TC) level on the control group. The Bayesian Kernel Machine Regression model was used to assess the effect on the control group. The model was adjusted for age, sex, drinking, smoking, economic status, and body mass index. (A) The overall effect of the exposure to the combined metals: 95% CI of the estimate of the TC value at each quantile compared with that when all heavy metals are at the median concentration (B) Single pollutant association: 95% CI of TC estimates for the interquartile range change of each heavy metal concentration when the concentrations of the remaining heavy metals are fixed at the 25th, 50th, and 75th percentiles (C) Univariate exposure-response functions and 95% confidence bands for each metal, with the other pollutants fixed at the 50th percentile. (D) Bivariate exposure-response functions, that is, when the concentrations of other heavy metals are the medians and the concentrations of expos2 metal (row) are at the 25th, 50th, and 75th percentile, respectively, it shows the change in TC concentration according to the change in expos1 (column) level.
Zn = zinc, Fe = iron, Ni = nickel, Cd = cadmium, Pb = lead, Hg = mercury, TC = total cholesterol, CI = confidence interval.
DISCUSSION
This study evaluated the effects of combined exposure to Cd, Fe, Hg, Ni, Pb, and Zn on dyslipidemia marker levels in residents of a smelter plant in Korea. The relationships between the levels of the six heavy metals and dyslipidemia markers were evaluated using multiple linear regression analysis. For all participants, TC levels showed significant associations with blood Hg, Pb, Fe, and Zn levels; however, only Fe and Zn showed significant associations in the exposure group, and Hg and Fe showed positive associations and blood Cd levels showed negative association in the control group. In contrast, the results of the BKMR analysis showed that increased blood Fe, Zn, Pb, and Hg levels were significantly associated with TC levels in all participants, and Zn, Fe, Cd, and Pb showed a significant association in the exposure group. However, no significant associations were observed in the control group. One reason why the results of the multiple linear regression analysis differ from those of the BKMR analysis is the application of a linear analysis method, despite some metals and TC levels having a non-linear relationship. Zn, Fe, and Ni showed a non-linear association with TC levels, and some heavy metals showed a U-shaped association, suggesting that the associations may vary depending on the concentration of heavy metal exposure. A significant advantage of the BKMR model is that it can identify the combined effects of multiple metal exposures. In this study, the combined effect of multiple heavy metal exposures showed that increased metal concentrations significantly affected TC levels in both the total population and the exposure group, while no significant effect was observed in the control group. Thus, the BKMR can be a more suitable method for evaluating the effects of exposure to various heavy metals on health.
Some studies have reported an association between blood Pb and cholesterol levels. The likely underlying mechanism by which blood Pb increases serum cholesterol levels is through its effect on cholesterol metabolism in the liver. According to Kojima et al.,22 Pb affects lipid metabolism by inhibiting cytochrome p450, which is essential for lipid metabolism, and by inducing lanosterol 14α-demethylase, which is essential for cholesterol synthesis. Additionally, Pb-mediated hypercholesterolemia is accompanied by the activation of cholesterol synthesis enzymes such as 3-hydroxyl-3-methylglutaryl-CoA reductase and farnesyl diphosphate synthase.22 In a cross-sectional study of occupational exposure to Pb, the group exposed to Pb had higher TC levels than the control group.23
The association between Zn exposure and dyslipidemia has not been confirmed. According to Ranasinghe et al.24 and Asbaghi et al.,25 Zn supplementation may exert an adjunctive effect on dyslipidemia treatment. Moreover, it has been reported to increase HDL-C levels and decrease TC, TG, and LDL-C levels. However, serum TC levels have also been reported to be the highest among individuals in the highest quartile of Zn intake.2627 In addition, Nriagu et al.28 reported that chronic exposure to Zn may increase serum cholesterol levels by increasing and decreasing LDL-C and HDL-C concentrations, respectively.
Some studies have reported that increased Fe concentrations in the body affect cholesterol metabolism. Meroño et al.29 reported that patients with excess Fe showed changes in glucose metabolism and had increased concentrations of TG and LDL-C. High Fe levels can increase cholesterol levels by inducing insulin resistance, which can lead to lipid oxidation stress and increase proinflammatory cytokines and other mechanisms, thereby promoting cardiovascular diseases.30 Hg is known as a major heavy metal that aggravates metabolic syndromes and cardiovascular diseases, including atherosclerosis.31 A cross-sectional study reported an association between lipid regulation disorders and high Hg levels.32 Another study reported a positive correlation between Hg exposure and TC and LDL-C levels.33 Our study shows that high blood Hg levels were significantly associated with TC concentrations, which corroborates the results of previous studies. The mechanisms underlying the effects of Hg on dyslipidemia remain unclear. One possible mechanism is the involvement of Hg in lipid metabolism and adipocyte homeostasis.34 Adipocytes produce adipokines that are involved in lipid metabolism,35 and Hg has been reported to cause functional abnormalities in the adipose tissue of rats.36 The toxic effects of Hg include oxidative stress and depletion of antioxidants.37 Oxidative stress is a major contributor to cellular dysfunction and is associated with various diseases, including dyslipidemia.38 Hg exposure may induce excessive production of reactive oxygen species due to cell damage and LDL-C oxidation.39 An association between Cd exposure and dyslipidemia has also been previously reported. Some studies have reported that Cd exposure affects lipid metabolism and increases the risk of cardiovascular disease510; however, a national survey of Koreans (Korea National Health and Nutrition Examination Surveys) found no association between Cd levels in the blood and TC, LDL-C, HDL-C, or TG.40 In addition, an analysis of National Health and Nutrition Examination Survey data from the United States showed that Cd exposure was not associated with dyslipidemia.41 Herein, the association between blood Cd levels and TC levels was not significant for all individuals. However, in the exposure group, Cd showed a significant positive association when the concentrations of other heavy metals were in the 25th percentile; this association decreased as the concentrations of other heavy metals increased. This suggests that interactions with other heavy metals influence the effect of Cd on the TC concentration. The association between Ni exposure and serum cholesterol levels is also ambiguous. In an experiment in rats, Ni sulfate treatment significantly increased serum LDL-C and TG levels.42 Similarly, Cloëz et al.43 found that low doses of Ni increased lipid synthesis in mice. However, another study reported that feeding rats with Ni acetate reduced serum cholesterol levels.44 Ni chloride also reduces serum total lipid, phospholipid, and bilirubin levels in rats.45 Decreased cholesterol levels following exposure to Ni sulfate have also been reported.46 Studies on the association between Ni exposure and cholesterol levels in humans are limited. In a study by Chen et al.,47 urinary Ni concentrations were significantly negatively associated with TG and LDL-C concentrations in a Chinese population. However, Yang et al.3 reported that workers with high exposure to Ni had significantly higher TG concentrations and a higher prevalence of dyslipidemia.47 These results are inconsistent with the results of our study, which showed that Ni concentration did not significantly affect levels of serum cholesterol.
To our knowledge, studies on the association between blood heavy metal concentration and lipid metabolism have reported varying results. The results of this study agree or disagree with those of previous studies, depending on the type of heavy metal being considered. The exact reason for this discrepancy remains unclear; however, it is likely that most heavy metal exposures occur simultaneously with exposure to several heavy metals rather than exposure to a single heavy metal and that interactions between heavy metals affect health indicators. Therefore, it is important to evaluate the combined effects of various types of heavy metals using methods such as BKMR.
The stratified analysis based on exposure levels revealed a significant impact of combined heavy metal exposure on lipid metabolism in the exposed group, whereas no such association was observed in the control group. While the precise cause or mechanism underlying this observation could not be determined by this study, it is plausible that the metal interactions vary depending on the extent of heavy metal exposure, potentially leading to differential effects on lipid metabolism. This possibility is backed up by the fact that certain heavy metals such as Pb, Hg, and Fe did not exhibit a linear relationship with cholesterol concentration in the analysis encompassing all participants in this study. These findings indicate that there is a need to divide and examine groups with varying levels of exposure in epidemiological studies to accurately determine the relationship between hazardous substances, including heavy metals, and their associated health effects.
Understanding the mechanisms of toxicity of single heavy metals and health indicators is important for toxicology. However, for public health, the comprehensive effect of multiple heavy metals is more meaningful than the individual effect of a heavy metal. From the perspective of residents exposed to heavy metals, it is important to determine whether the observed dyslipidemia in residents is due to a refinery plant. Therefore, it is necessary to understand the combined effects of heavy metals rather than the relationships between individual heavy metals and dyslipidemia indicators.
This study has some limitations. First, while the participants were divided into exposure and control groups for comparison, matching by age and sex was not implemented. However, since various factors including age and sex were controlled as covariates in the statistical analysis stage, the possibility of them acting as confounders is not high. Second, the cross-sectional nature of this study hinders the establishment of a clear temporal relationship between exposure and health outcomes. However, in the case of heavy metals, they have a relatively long half-life in the body, so they provide a relatively stable level of exposure compared to volatile organic compounds or polycyclic aromatic hydrocarbons. Despite its limitations, this study holds several strengths. First, it analyzed the impact of various heavy metal exposures on lipid concentrations in the body using the BKMR model, accounting for potential non-linear relationships between these factors. Second, the study compared the association between heavy metal exposure and lipid metabolism in two distinct populations: one with exceptionally high exposure to heavy metals near a smelter and a general population group. This comparison affirmed that the level of exposure can significantly influence the relationship with health outcomes.
The results of this study showed that exposure to six heavy metals from a refinery plant significantly increased the residents’ TC levels. In addition, the combined effect of heavy metal exposure on all the participants was found to significantly affect the concentration changes of LDL-C, TG, and HDL-C (Supplementary Figs. 1, 2, 3). These results provide evidence that the cholesterol levels of residents around the Janghang refinery plant may have increased due to exposure to multiple heavy metals.
 XML Download