Journal List > Korean J Physiol Pharmacol > v.28(2) > 1516086325

Kim, Kim, Jeon, Moon, Kwak, Na, Lee, Park, Kim, Lee, Choi, and Shin: Profiling of endogenous metabolites and changes in intestinal microbiota distribution after GEN-001 (Lactococcus lactis) administration

Abstract

This study aimed to identify metabolic biomarkers and investigate changes in intestinal microbiota in the feces of healthy participants following administration of Lactococcus lactis GEN-001. GEN-001 is a single-strain L. lactis strain isolated from the gut of a healthy human volunteer. The study was conducted as a parallel, randomized, phase 1, open design trial. Twenty healthy Korean males were divided into five groups according to the GEN-001 dosage and dietary control. Groups A, B, C, and D1 received 1, 3, 6, and 9 GEN-001 capsules (1 × 10¹¹ colony forming units), respectively, without dietary adjustment, whereas group D2 received 9 GEN-001 capsules with dietary adjustment. All groups received a single dose. Fecal samples were collected 2 days before GEN-001 administration to 7 days after for untargeted metabolomics and gut microbial metagenomic analyses; blood samples were collected simultaneously for immunogenicity analysis. Levels of phenylalanine, tyrosine, cholic acid, deoxycholic acid, and tryptophan were significantly increased at 5–6 days after GEN-001 administration when compared with predose levels. Compared with predose, the relative abundance (%) of Parabacteroides and Alistipes significantly decreased, whereas that of Lactobacillus and Lactococcus increased; Lactobacillus and tryptophan levels were negatively correlated. A single administration of GEN-001 shifted the gut microbiota in healthy volunteers to a more balanced state as evidenced by an increased abundance of beneficial bacteria, including Lactobacillus, and higher levels of the metabolites that have immunogenic properties.

INTRODUCTION

Gut microbiota-derived metabolites play key roles in the host immune system. Microbiota-generated lipopolysaccharide (LPS) can have important effects on the immune system [1]. Bacteroides-generated LPS increases autoimmune activity in the intestines [2], and LPS produced by Escherichia coli is a marker of gut inflammation [3]. Bile acid metabolites regulated by gut microbiota play a central role in the immune system. The primary bile acids, chenodeoxycholic and cholic acids, are conjugated to glycine in the liver and then secreted into the intestines where they are metabolized by the intestinal microbiota to secondary bile acids, deoxycholic and lithocholic acids [4,5]. These secondary bile acids can inhibit the secretion of proinflammatory cytokine by dendritic cells and macrophages [6].
An unbalanced gut microbiota with decreased diversity and gut dysbiosis can occur in cases of various diseases [7] including human immunodeficiency virus infection [8], inflammatory bowel disease (IBD) [9], and metabolic syndrome [10]. The gut microbiota composition significantly differs between patients with cervical cancer and healthy controls of an increased abundance of the Bacteroidetes phylum and Prevotella genus and a decreased abundance of the Firmicutes phylum in patients compared with controls [11-13].
As awareness about the importance of gut microbes has increased, the selected microbes have been evaluated for use as therapeutic agents, such as live biotherapeutic products (LBPs) [14-16]. This term of LBP was initially used by the U.S. Food and Drug Administration to describe microbial treatments (e.g., Lactococcus lactis) that exhibit potential for treating diseases [17]. Although our understanding of the role of the gut microbiome is evolving rapidly, many questions remain unanswered regarding microbiome therapeutics and the impact of gut microbes on human health. Several studies have evaluated LBPs using pharmacometabolomics to identify alterations in microbiota-derived metabolites and to understand the mechanisms underlying the effects of different probiotics on LBP [18,19].
L. lactis is a probiotic that exhibits anti-inflammatory properties, enhances the immune system, maintains intestinal microbial balance, and prevents gastrointestinal infections [20-22]. An in vitro study reported that L. lactis-derived metabolites, such as vaccenic acid, indole lactic acid, and γ-aminobutyric acid, induced death of cancer cells [23]. Treatment with L. lactis increases the expression of the tumor suppressor gene p53 in gastric cancer cells, which enhances the expression of p21 gene to induce apoptosis by inhibiting the G1 phase during the cell cycle [24,25]. L. lactis treatment in human colon adenocarcinoma cell lines induces tumor cell apoptosis by producing tumor necrosis factor-related apoptosis-inducing ligand protein [26]. However, limited number of clinical trials has evaluated the metabolomic changes caused by L. lactis.
Therefore, this study aimed to characterize the metabolome profiles from stool samples of healthy adult men after the administration of a single dose of GEN-001 (L. lactis) as an LBP. Moreover, the effects of GEN-001 on the composition of the intestinal microbiota and the related mechanisms of GEN-001 action were investigated.

METHODS

Study design and sample information

This study was adopted a parallel, randomized, phase 1 open design. The clinical trial was performed in accordance with the International Council for Harmonization guidelines, Korea Good Clinical Practice, domestic regulations related to clinical trials, and the Declaration of Helsinki. This study was approved by the Ministry of Food and Drug Safety of the Republic of Korea and the Institutional Review Board of Jeonbuk National University Hospital (Jeonju, Republic of Korea) (IRB No. CUH2020-03-011) and Seoul National University Hospital (Seoul, Republic of Korea) (IRB No. H-2006-029-1132).
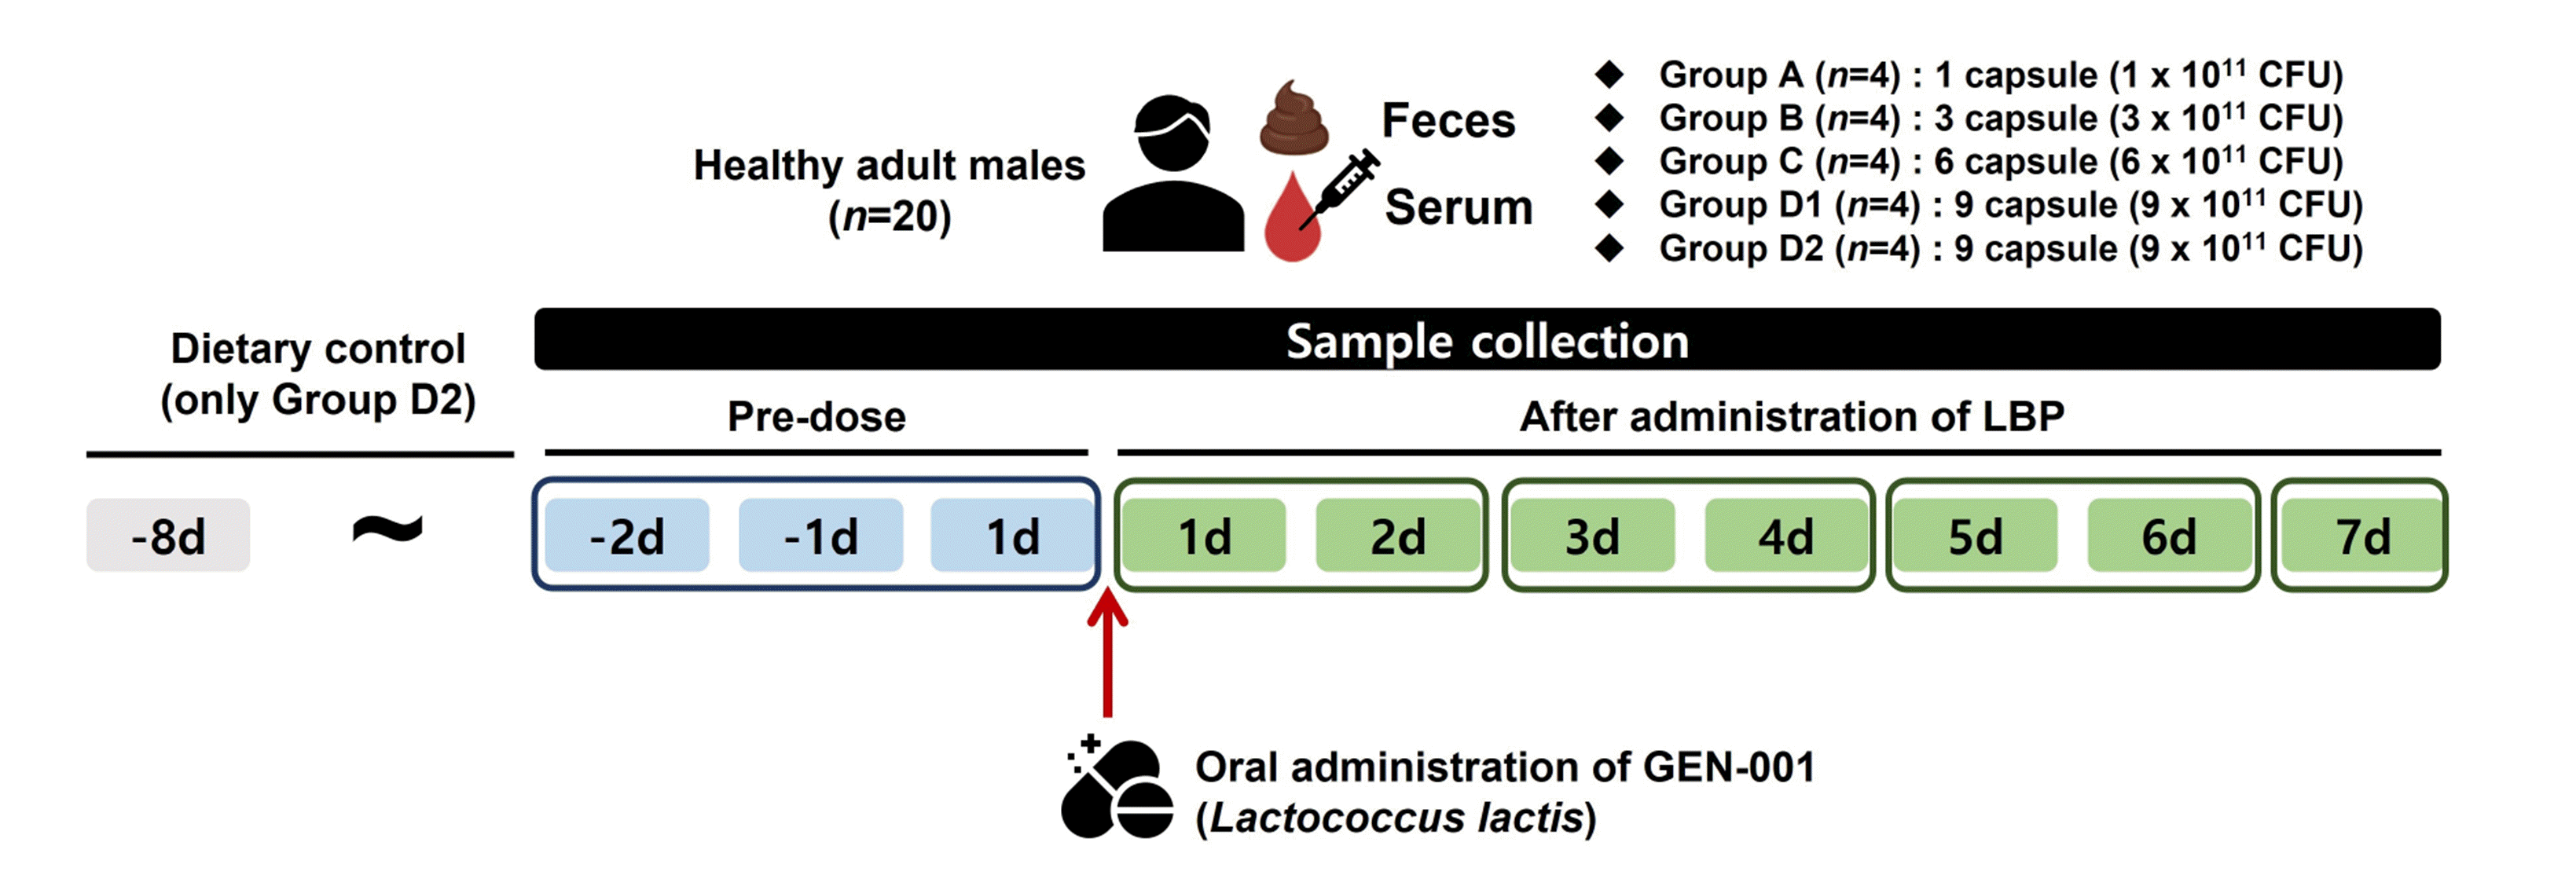
A total 20 non-smoker healthy adult men (aged 19–50 years), weighing at least 55 kg with a body mass index from 18 to < 28 kg/m2 were recruited (Table 1); the subjects also defecated more than three times per week. Subjects were excluded if they were allergic to lactic acid bacteria, had taken antibiotics within 3 months before the clinical trial commencement, or took prebiotics or consumed yogurt containing probiotics within 1 month before starting the trial. Participants were randomly divided into five groups. The dosage of GEN-001 was 1 capsule (1 × 10¹¹ colony forming units/capsule) in group A, 3 capsules in group B, 6 capsules in group C, and 9 capsules in groups D1 and D2. GEN-001 was administered as a single dose. Groups A, B, C, and D1 were not under any dietary control; however, group D2 had a run-in period that started 7 days before GEN-001 administration with dietary control and then received GEN-001 after this. Drug administration was confirmed by checking the mouth of each participant. Fecal samples were obtained 1–2 days before GEN-001 administration and 1–2, 3–4, 5–6, and 7 days after GEN-001 administration. All study participants were hospitalized to collect samples for the study. Collected fecal samples were homogenized by adding sterile saline. Homogenized fecal samples were stored at −70°C. Blood samples were also collected at the same time points (Fig. 1, Supplementary Fig. 1).

Materials and chemicals

GEN-001 was provided by Genome and Company Inc., and is a single-strain L. lactis isolated from the gut of healthy human volunteers.
Acetonitrile, liquid chromatography–mass spectrometry (LC–MS)-grade deionized water, and extra pure formic acid were purchased from Sigma-Aldrich Chemical Co. Acetylcholine, cholic acid, choline, quinic acid, proline, pyroglutamic acid, tryptophan, phenyllactic acid, deoxycholic acid, malic acid, hypoxanthine, carnitine, glutamic acid, norleucine, phenylalanine, tyrosine, valine, methylmalonic acid, pyruvic acid, and glucuronic acid were purchased from Sigma-Aldrich Chemical Co. Trigonelline was purchased from Toronto Research Chemicals Inc. Urobilin hydrochloride was purchased from Santa Cruz Biotechnology Inc. Deionized water for sample preparation was prepared using a Milli-Q water system (Merck).

Untargeted metabolomics analysis of fecal samples

Samples were prepared by mixing 1 g feces with 1 ml of tertiary distilled water at room temperature and homogenizing in a vortex mixer for 5 min. The homogenized sample was frozen at −80°C for 1 h and then freeze-dried for 48 h. The freeze-dried sample was added to tertiary distilled water (to 20 mg/μl), vortexed for 5 min, and centrifuged at 13,000 × g and 4°C for 10 min. Then, 150 μl of 8:2 methanol/water (v/v) was added to 200 μl of supernatant and vortexed for 5 min. The mixture was diluted four times with 1,050 μl tertiary distilled water and analyzed using ultra-high-pressure liquid chromatography-high resolution mass spectrometry (UHPLC-HRMS).
Sample analysis was performed using an Ultimate 3000 instrument (Thermo Fisher Scientific) coupled with a Q Exactive Focus Hybrid Quadrupole-Orbitrap mass spectrometer (Thermo Fisher Scientific). A Kinetex C18 column (2.1 × 100 mm, 2.6 μm) (Phenomenex) was used for chromatographic separation at a constant temperature of 40°C. Mobile phase A was made up of deionized water with 0.1% formic acid, whereas mobile phase B of acetonitrile with 0.1% formic acid. Samples were analyzed in the electrospray ionization positive (ESI+) and negative (ESI−) modes. Pooled patient samples were used as quality control samples to confirm system suitability. Scans ranged from 100 to 1,000 m/z using the full MS-data-dependent MS2 (ddMS2) scan mode at resolutions of 70,000 and 17,500.
Standard materials for each analysis were dissolved at 100 ppm and analyzed using parallel reaction monitoring mode. Putative identities were confirmed using mzCloud, Human Metabolome Database, and Kyoto Encyclopedia of Genes and Genomes databases by comparing mass spectra. UHPLC-HRMS quantitative analysis was performed on the final metabolites. Donepezil-d4 (CDN Isotopes) was used as an internal standard (IS) for endogenous metabolite quantification in the positive mode, and thioctic acid-d5 (Toronto Research Chemicals) was used for quantification in the negative mode. IS was added to pretreated stool samples to 10 μg/ml final concentration. Samples were analyzed under the same conditions as those for metabolite analysis. Metabolite concentrations were calculated using the ratio of IS and metabolite peak areas.

Microbiota analysis of fecal samples

Fecal samples were homogenized and stored at −70°C at the Center for Clinical Pharmacology of Jeonbuk National University Hospital. DNA extraction and next-generation sequencing (NGS) and analysis were conducted at DNAlink Inc. using the Illumina Miseq platform (Illumina) for 16s rRNA sequencing.

Immunogenicity and hematological analyses of serum samples

Immunogenicity and hematological analyses were performed by GCCL Inc. Hematology analysis was conducted on blood samples collected predose and 7 days after GEN-001 administration. Immunogenic cytokines were analyzed in serum samples, which were collected with fecal samples at predose and 1–2, 3–4, 5–6, and 7 days after GEN-001 administration. Serum concentrations of immunogenic cytokines, such as interferon (IFN)-γ, tumor necrosis factor (TNF)-α, interleukin (IL)-1β, IL-2, IL-7, and IL-15, were determined.

Statistical analysis

Raw LC–MS/MS data were processed using Compound discoverer 3.1 (Thermo Fisher Scientific). Multiple statistical analyses, such as orthogonal partial least squares discriminant analysis (OPLS-DA), and principal component analysis were performed using SIMCA 14.1 (Umetrics). OPLS-DA identified variable importance in the projection (VIP), p, and p (correlation) values. VIP is the importance of a variable that distinguishes groups, the p-value represents the covariance of variables, and p (correlation) represents the correlation coefficient between variables. The cut-off criteria for these values were VIP ≥ 3, |p-value| ≥ 0.05, and |p(corr)| ≥ 0.5.
Statistical analyses were performed using Statistical Package for Social Sciences Ver. 26 (IBM). The repeated measure analysis of variance (RM ANOVA) and Friedman statistical analyses were used to compare metabolite concentrations before and after GEN-001 administration. The one-way ANOVA and Kruskal–Wallis tests were used to compare differences in doses. Two-sample t-test and Mann–Whitney tests were used to compare data with or without dietary control. A p-value of < 0.05 was considered significant. Correlation analysis was performed using the Spearman’s correlation method on the DisplayR platform.

RESULTS

Administration of GEN-001 significantly increased endogenous metabolites concentrations in healthy male volunteers

OPLS-DA was used to compare metabolite levels before and after GEN-001 administration, and 18 endogenous metabolites that satisfied the cut-off criteria and identification were selected as final candidates (Supplementary Table 1). Quantification analysis revealed that the concentrations of 11 metabolites (acetylcholine, proline, valine, tyrosine, norleucine, phenylalanine, tryptophan, glucuronic acid, pyruvic acid, cholic acid, and deoxycholic acid) significantly increased after GEN-001 administration compared with those before administration (p < 0.05) (Supplementary Fig. 1A). The concentrations of proline, tyrosine, tryptophan, and deoxycholic acid were significantly increased at all time points after GEN-001 administration compared with their predose levels. Proline, tyrosine, and tryptophan concentrations at 5–6 days after administration were 1.45-, 1.73-, and 1.96-fold higher, respectively, than that at predose (p < 0.01). The deoxycholic acid concentration at 3–4 days after administration was 3.64-fold higher than that at predose (p < 0.01).
Among the 18 metabolites selected based on OPLS-DA in comparison with the GEN-001 dosage, pyroglutamic acid, norleucine, and pyruvic acid concentrations significantly differed between groups A and B to D1 (Supplementary Fig. 1B). However, the concentration of these metabolites did not increase or decrease in proportion to the dose of GEN-001, and their concentrations were already different before the administration of GEN-001.
Five metabolites were selected for comparison between the dietary- and noncontrolled groups (Supplementary Table 1). Valine concentration was lower in the noncontrolled group than in the dietary-controlled group (Supplementary Fig. 1C). In particular, at predose and 1–2 days after GEN-001 administration, the valine concentration in the noncontrolled group was 0.27- and 0.34-fold lower than that in the dietary-controlled group, respectively (p < 0.05).

Administration of GEN-001 significantly increased the concentrations of metabolites involved in the phenylalanine, tyrosine, and tryptophan metabolic pathways

To determine the effects of the 11 metabolites whose concentrations significantly increased after GEN-001 administration, pathway and network analyses were performed to examine their functions and mechanisms. Consequently, phenylalanine, tyrosine, and tryptophan biosynthesis; phenylalanine metabolism; tyrosine metabolism; and ascorbate and aldarate metabolism satisfied the cut-off requirements (p-value < 0.05, and pathway impact ≥ 0.1) (Fig. 2A) [27]. Three pathways (phenylalanine, tyrosine, and tryptophan biosynthesis, phenylalanine metabolism, and tyrosine metabolism) had common significant results in these analyses (Fig. 2B). These results suggested that GEN-001 administration significantly increased the concentrations of metabolites involved in the phenylalanine-, tyrosine-, and tryptophan-related metabolic pathways, such as phenylalanine, tyrosine, and pyruvic acid.

Changes in intestinal L. lactis relative abundance after GEN-001 administration

NGS was performed using 16s rRNA from fecal samples to identify changes in the relative abundance (%) of L. lactis in the intestines of healthy individuals after a single dose of GEN-001. The abundance of L. lactis significantly increased after the administration of GEN-001, suggesting that GEN-001 affects the composition of intestinal microorganisms.
Dosage comparisons showed no significant differences in the relative abundance of L. lactis. However, the relative abundance of L. lactis at 1–2 days was significantly increased (approximately 10.1-fold) and 3–4 days (approximately 6.61-fold) compared with the predose level (Fig. 3A, B). The relative abundance of L. lactis increased the most at 1–2 days and then gradually decreased until day 7. The relative abundance of L. lactis was also higher in the dietary-controlled group (D2) than in the noncontrolled group (D1). This result indicated that dietary control affected the relative abundance of intestinal L. lactis (Fig. 3C).
Correlation between the relative abundance of intestinal L. lactis and 11 metabolites that significantly increased with GEN-001 administration showed that proline levels were negatively correlated with L. lactis at all time points. The Spearman’s correlation coefficients (r) for proline concentration were r = −0.65 at 1–2 days, and r = −0.77 at 3–4 days, which were significant (p < 0.05). Valine levels were negatively correlated with L. lactis abundance at all timepoints except for 7 days and showed a significant negative correlation (r = −0.52 at 3–4 days, p < 0.05). Conversely, pyruvic acid and glucuronic acid levels showed positive correlations with L. lactis abundance at all time points, and glucuronic acid showed a significant positive correlation (r = 0.59 at 1–2 days, p < 0.05) (Fig. 3D).

Alpha- and beta-diversity analysis of the effects of GEN-001 administration on intestinal microbial diversity

No changes in intestinal microbial diversity were observed using Shannon and Bray–Curtis analyses under the following three conditions: before and after administration, dosage, and dietary control. Moreover, no significant differences were observed in the results of the other alpha-diversity analyses, such as Simpson, ACE, Chao 1, and OTUs (Supplementary Fig. 2).

Effects of GEN-001 administration on the composition of intestinal microbiota at the genus level

When changes in microbial composition were identified at the phylum level, five phyla (Actinobacteriota, Bacteroidota, Firmicutes, Proteobacteria, and Verrucomicrobiota), accounted for > 97% of the total intestinal microbiota, and no significant differences were observed after GEN-001 administration. Among the top 10 genera (Fig. 4A), the relative abundance of Alistipes and Parabacteroids was significantly reduced (Fig. 4B). The relative abundance of Alistipes was approximately 0.8-fold lower 7 days after administration of GEN-001 than that at predose, and the relative abundance of Parabacteroids was approximately 2-fold lower 3–4 days after administration of GEN-001 than that at predose, which was maintained for 7 days. The relative abundance of Escherichia significantly differed between the dietary-controlled group (D2) and the noncontrolled group (D1) at predose and 1–2 days; however, after 3–4 days, the difference between these two groups reduced. The relative abundances of Bacteroides and Parabacteroides were higher in group D2 than in group D1. No significant changes were observed at the phylum and genus levels in the dose comparisons.
Relative abundance changes were confirmed before and after GEN-001 administration for Lactobacillus, Bifidobacterium, and Lactococcus, which are well-known probiotics [28,29]. The relative abundance of Lactobacillus and Lactococcus increased after the administration of GEN-001 compared with that in the predose group. The relative abundance of Lactobacillus increased the most at 7 days by 17.25-fold when compared with that in the predose but was not significantly different. However, the relative abundance of Lactococcus significantly increased by 7.94-fold and 13.49-fold at 1–2 and 3–4 days, respectively, when compared with that in the predose (p < 0.05). Conversely, the relative abundance of Bifidobacterium significantly decreased at all time points, with the highest decrease of 0.14-fold at 7 days when compared with that in the predose group (Fig. 4C) (p < 0.05).
From the correlation evaluation between the metabolites and the 13 genera (top 10 genera and three probiotic strains), cholic acid, pyruvic acid, and glucuronic acid were negatively correlated with Bacteroide B and Bacteroides at all time points. Deoxycholic acid did not correlate with Bacteroides B and Bacteroides at predose. However, deoxycholic acid was negatively correlated with Bacteroides B and Bacteroides after GEN-001 administration. Deoxycholic acid showed significantly weak negative correlation (r = −0.45) with Bacteroides B at 5–6 days. Bacteroides and Bacteroides B showed a positive correlation with tryptophan, phenylalanine, norleucine, tyrosine, valine, proline, and acetylcholine at all time points. Overall, tryptophan was negatively correlated with Prevotella and Alistipes but positively correlated with Escherichia. Parabacteroides had a negative correlation with pyruvic acid at all time points (r = −0.73 highest correlation coefficient at 3–4 days, p < 0.05) (Supplementary Fig. 3). Of the three probiotic strains, Lactobacillus and Lactococcus showed positive correlations with cholic acid, pyruvic acid, and glucuronic acid and negative correlations with tryptophan, phenylalanine, norleucine, tyrosine, valine, and proline at 5–6 and 7 days, respectively. No significant correlation was observed between Bifidobacterium and the 11 metabolites, and no specific pattern could be confirmed (Fig. 4D).

Effects of GEN-001 administration on immunogenic cytokines

Serum IFN-γ, TNF-α, IL-1, IL-2, IL-7, and IL-15 concentrations were measured to determine the effect of GEN-001 administration on immunogenicity. In most samples, the IL-1, IL-2, and IL-15 concentrations were lower than the lowest measurable concentrations (3.2 pg/ml). No significant changes were observed for IFN-γ, TNF-α, and IL-7 concentrations after GEN-001 administration compared with those at predose.
Hematological analyses were performed on blood samples before and 7 days after GEN-001 administration. After GEN-001 administration, lymphocyte proportions (%) in white blood cells significantly increased, whereas neutrophil and monocyte proportions significantly decreased (p < 0.05). However, these changes were not clinically significant. Similarly, no significant changes in the basophil and eosinophil proportions (%) were observed.
Correlation analyses of IFN-γ, TNF-α, and IL-7 and the 11 metabolites whose concentrations increased after GEN-001 administration were performed. The heatmap showed that pyruvic acid and glucuronic acid were negatively correlated with IFN-γ and TNF-α, whereas tryptophan, phenylalanine, norleucine, tyrosine, valine, and proline were positively correlated. Particularly, pyruvic acid was significantly correlated with TNF-α (r = −0.87) at 1–2 days after GEN-001 administration (p < 0.05).

DISCUSSION

In this study, the concentrations of 11 metabolites increased significantly in fecal samples after GEN-001 administration compared with those at predose. These metabolites are involved in phenylalanine and tryptophan metabolism and in the primary and secondary bile acid pathway metabolism. Importantly, the concentrations of tyrosine, deoxycholic acid, tryptophan, and proline significantly increased at all time points (Supplementary Fig. 1A), and tyrosine, deoxycholic acid, and tryptophan, in particular, are known to be associated with gut microbiota metabolism.
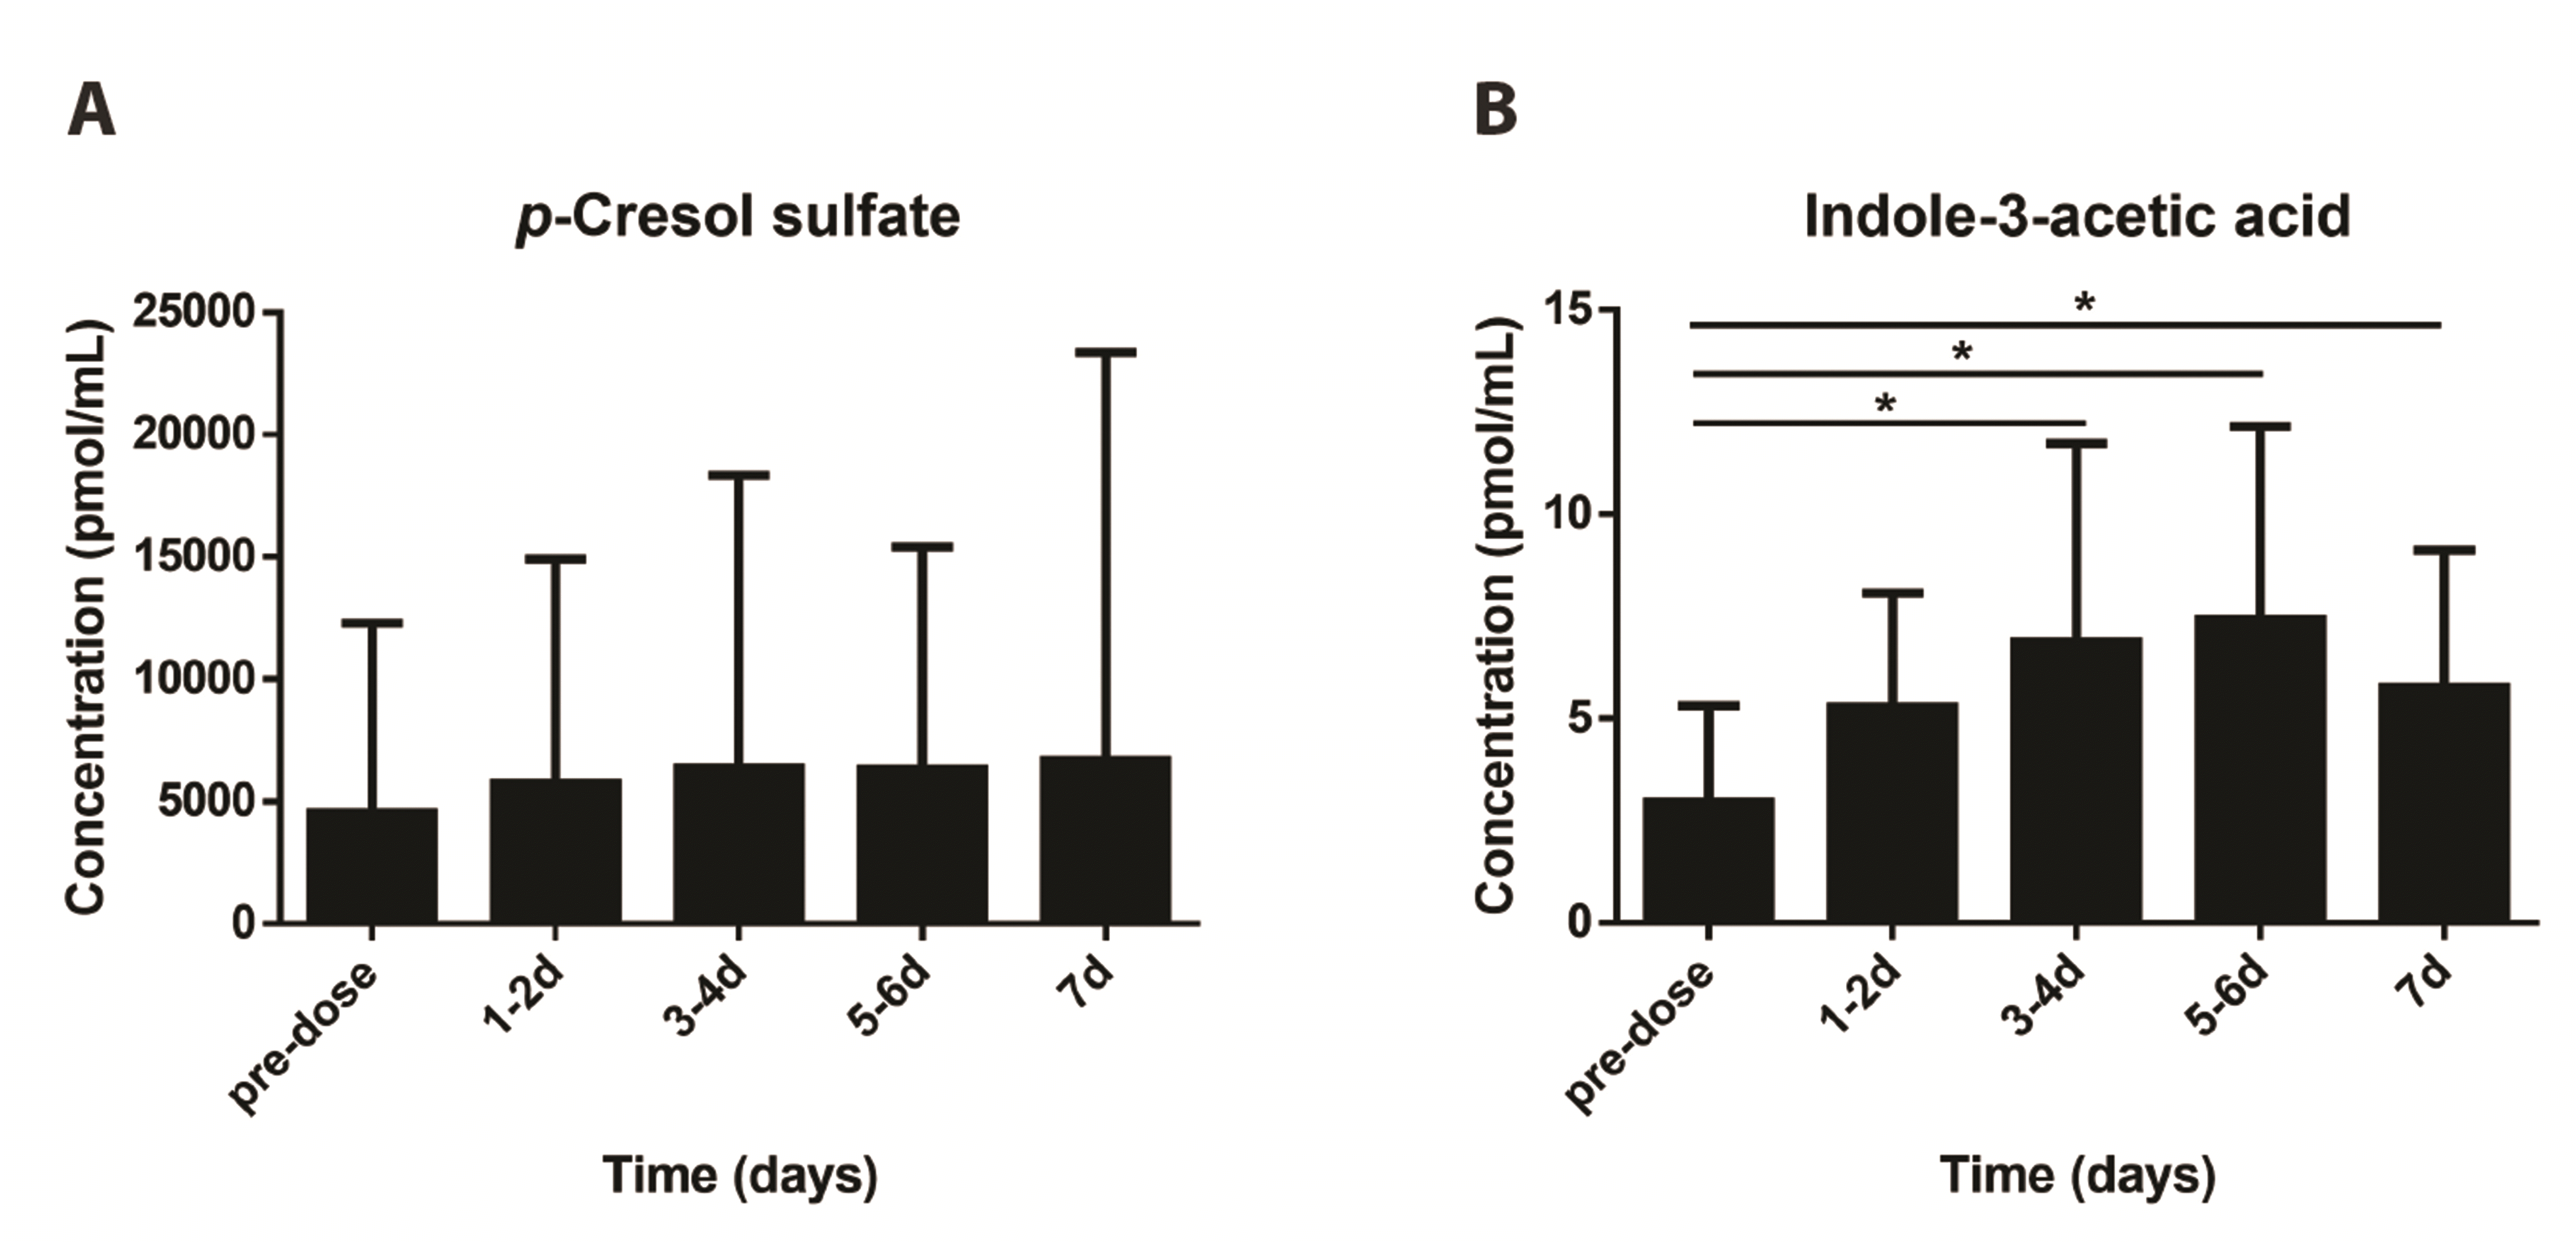
Tyrosine is metabolized by the gut microbiota and is associated with anti-inflammatory responses and several diseases. Phenylalanine is metabolized to tyrosine, and intestinal microbes then convert tyrosine to p-cresol, which is metabolized to p-cresol sulfate and dispersed throughout the liver and colonic mucosa [30,31]. p-Cresol is converted to p-cresol sulfate in the colon and liver. p-Cresol sulfate and tyrosine can reduce type 2 inflammation and are active against neutrophilic inflammation [31]. Although a change in p-cresol sulfate concentration was observed in this study, it was not significant, but it confirmed the increase in concentration after GEN-001 administration compared to the predose (Fig. 5A). A previous study reported that tyrosine and acetylcholine can induce dopa and norepinephrine production in lymphocytes [32].
Deoxycholic and cholic acid suppress inflammatory cytokine production. Deoxycholic acid, a primary bile acid metabolite, is synthesized in the liver and secreted into the intestine where it is hydrolyzed by intestinal microorganisms (Bacteroids, Lactobacillus, Bifidobacterium, and Clostridium) to produce deoxycholic acid, a secondary bile acid. Primary and secondary bile acids inhibit proinflammatory cytokine secretion from host macrophages, dendritic cells, and hepatocytes [6,33,34].
No significant difference in the relative abundance of L. lactis was found among the different dose groups, but the relative abundance of L. lactis significantly increased at 1–2 and 3–4 days after GEN-001 administration compared with that at the predose. Dsouza et al. [35] reported poor colonization of LBP constituent strains in the intestine, according to minimal change in the relative abundance of LBP constituent strains in the intestine despite multiple doses of LBP for 21 days. Conversely, in this study, a single dose of GEN-001 affected the relative abundance of L. lactis in the intestine. However, multiple doses might be necessary for complete L. lactis colonization in the gut because the relative abundance of L. lactis decreased at 7 days compared with that at 1–2 days. In addition, dietary control might affect the intestinal composition of L. lactis because the relative abundance of L. lactis in the predose of the dietary-controlled group was significantly higher than that in the noncontrolled group.
Administration of GEN-001 altered the relative abundance of beneficial bacterial genera, such as Lactobacillus and Lactococcus, and that of Bifidobacterium. Particularly, L. lactis intake increased Lactobacillus and Lactococcus abundance (Fig. 4C). The abundance of Lactobacillus, which increased after GEN-001 administration, was negatively correlated with tryptophan, whose concentration increased significantly after GEN-001 administration (Fig. 4D). These correlations are considered to be related to Lactobacillus-induced tryptophan metabolism because these bacteria metabolize tryptophan into indole derivatives such as indole-3-acetic acid (IAA), indole-3-aldehyde (IAld), indole-3-propionic acid, indole-3-acetaldehyde (IAAld), and indole-acrylic acid [36,37]. L. lactis treatment significantly increased the concentrations of indole lactic acid, which is produced by tryptophan metabolism in the gut, in a previous in vitro study [23].
Tryptophan metabolites produced by Lactobacillus suppress intestinal inflammatory responses and maintain homeostasis of the intestinal immune system. These metabolites, such as IAA, IAld, and IAAld, are aryl hydrocarbon receptor (AhR) ligands that activate AhR, which is important for innate immune responses. In vivo mouse model studies have shown that the AhR ligand produced by Lactobacillus activates AhR and enhances cytokine release to suppress inflammatory responses [38,39]. In addition, AhR-deficient mice show increased susceptibility to colitis compared with control mice, suggesting that inflammation may be worsened by the lack of AhR activation in the intestine [40,41]. Furthermore, intestinal tissue from patients with IBD showed reduced AhR expression when compared with healthy controls [42,43]. Herein, indole acid derivatives were quantified to confirm that GEN-001 administration affected Lactobacillus metabolism of tryptophan. The concentration of IAA significantly increased after GEN-001 administration compared with that at predose (Fig. 5B). GEN-001 administration increased IAA concentrations via Lactobacillus-induced tryptophan metabolism, suggesting that GEN-001 improves anti-inflammatory reactions in the host immune system.
Administration of GEN-001 significantly decreased the relative abundance of Parabacteroides and Alistipes, which can induce colorectal cancer and inflammation in the gut (p < 0.05) (Fig. 4B). In a previous study, a higher relative abundance of Parabacteroides and Alistipes was found in patients with colorectal cancer compared with that in healthy controls [44]. The abundance of the Alistipes genus increased in the intestines of a mouse model in which the gene encoding IL-10, an anti-inflammatory cytokine, was knocked out in a previous study and induced inflammation-associated tumorigenesis [45,46]. This indicates that Alistipes are involved in host intestinal inflammatory responses.
After GEN-001 administration, the alterations in endogenous metabolites and intestinal microbiota (e.g., tyrosine, tryptophan, and deoxycholic acid and Lactobacillus and Lactococcus) were suggested to be related to the host immune system and anti-inflammatory reactions. However, no significant changes were observed in IFN-γ, TNF-α, IL-1β, IL-2, IL7, and IL-15 concentrations of lymphocytes following GEN-001 administration, which may be because this study was only conducted in healthy subjects after a single administration. The use of a syngeneic tumor mouse model demonstrated a significant increase in IFN-γ concentration after oral administration of L. lactis in vivo [23]. The difference between our study and the previous study was the health status of the participants. In another study using a healthy mouse model, no changes in immunogenicity were observed when L. lactis was administered, which is consistent with the results of this study [47]. On the other hand, in a previous study with 8 weeks of probiotic administration, IFN-γ increased significantly compared to that at predose [48].
A limitation of this study was the use of a single dose of GEN-001. A major difficulty in developing probiotic treatments, such as LBP, is the engraftment of microorganisms in the intestine. Steady administration of LBP is known to be crucial is this regard because exogenous microbes have limited retention time in the intestines [49]. Due to a single dose was used to evaluate the stability of GEN-001, no significant change in the diversity analysis of intestinal microorganisms (alpha- and beta-diversity analysis) was observed after GEN-001 administration. The relative abundance was presented to reveal the composition of the microbiota. It is essential and commonly used to characterize differences between microbial communities. However, relative abundance data has difficult and complex statistical problems because the observed microbiome data only reflect the relative numbers of taxa and are distorted by experimental bias [50,51].
This study comprehensively evaluated the correlations between GEN-001-induced effects on endogenous metabolites, intestinal microorganisms, and immunogenicity in humans. Our findings suggested that administration of GEN-001 improves the human immune system and inflammatory response. Previously, most gut microbiota studies have been performed using a sequence-based approach, which limited the functional understanding of how gut microorganisms affect humans [52]. Also, several studies evaluated L. lactis have been reported [7,23,53], but clinical studies on LBP using L. lactis as a treatment were limited. This study was a pharmacometabolomic approach on GEN-001 that revealed the effects and mechanisms of action in humans, adding credibility to the hypotheses of previous studies. The study results were contributed to the integrated understanding of the GEN-001 as a LBP.
In conclusion, GEN-001 administration increased the concentration of endogenous metabolites, such as tryptophan, tyrosine, deoxycholic acid, p-cresol sulfate, and IAA, produced by intestinal microorganisms. The administration of GEN-001 reduced the relative abundance of harmful bacteria, such as Prevotella and Alistipes, and increased the relative abundance of beneficial bacteria, such as Lactobacillus and Lactococcus.

SUPPLEMENTARY MATERIALS

Supplementary data including one table and three figures can be found with this article online at https://doi.org/10.4196/kjpp.2024.28.2.153

ACKNOWLEDGEMENTS

We appreciate Ms. Ye-ji Kang for participating in sample pretreatment and LC-MS/MS analysis.

Notes

FUNDING

This research was supported by a grant from the Korean Health Technology R&D Project through the Korea Health Industry Development Institute (KHID), funded by the Ministry of Health & Welfare, Republic of Korea (grant no. HI19C0790). This work was also supported by a National Research Foundation of Korea (NRF) grant funded by the Korean government (MSIT) (No. RS-2023-00251397), and the 4th BK21 project (Educational Research Group for Platform Development of Management of Emerging Infectious Disease), funded by the Korean Ministry of Education (5199990614732).

CONFLICTS OF INTEREST

The author disclosed that KMP and HJK are employees of the Genome and Company. The contents of this study were neither influenced nor constrained by this fact. The authors declare that they have no conflict of interest.

REFERENCES

1. Candelli M, Franza L, Pignataro G, Ojetti V, Covino M, Piccioni A, Gasbarrini A, Franceschi F. 2021; Interaction between lipopolysaccharide and gut microbiota in inflammatory bowel diseases. Int J Mol Sci. 22:6242. DOI: 10.3390/ijms22126242. PMID: 34200555. PMCID: PMC8226948.
crossref
2. Vatanen T, Kostic AD, d'Hennezel E, Siljander H, Franzosa EA, Yassour M, Kolde R, Vlamakis H, Arthur TD, Hämäläinen AM, Peet A, Tillmann V, Uibo R, Mokurov S, Dorshakova N, Ilonen J, Virtanen SM, Szabo SJ, Porter JA, Lähdesmäki H, et al. DIABIMMUNE Study Group. Xavier RJ. 2016; Variation in microbiome LPS immunogenicity contributes to autoimmunity in humans. Cell. 165:842–853. Erratum in: Cell. 2016;165:1551. DOI: 10.1016/j.cell.2016.04.007. PMID: 27133167. PMCID: PMC4950857.
crossref
3. Orivuori L, Mustonen K, de Goffau MC, Hakala S, Paasela M, Roduit C, Dalphin JC, Genuneit J, Lauener R, Riedler J, Weber J, von Mutius E, Pekkanen J, Harmsen HJM, Vaarala O. PASTURE Study Group. 2015; High level of fecal calprotectin at age 2 months as a marker of intestinal inflammation predicts atopic dermatitis and asthma by age 6. Clin Exp Allergy. 45:928–939. DOI: 10.1111/cea.12522. PMID: 25758537.
crossref
4. Yang W, Cong Y. 2021; Gut microbiota-derived metabolites in the regulation of host immune responses and immune-related inflammatory diseases. Cell Mol Immunol. 18:866–877. DOI: 10.1038/s41423-021-00661-4. PMID: 33707689. PMCID: PMC8115644.
crossref
5. Tremaroli V, Bäckhed F. 2012; Functional interactions between the gut microbiota and host metabolism. Nature. 489:242–249. DOI: 10.1038/nature11552. PMID: 22972297.
crossref
6. Postler TS, Ghosh S. 2017; Understanding the holobiont: how microbial metabolites affect human health and shape the immune system. Cell Metab. 26:110–130. DOI: 10.1016/j.cmet.2017.05.008. PMID: 28625867. PMCID: PMC5535818.
crossref
7. Carding S, Verbeke K, Vipond DT, Corfe BM, Owen LJ. 2015; Dysbiosis of the gut microbiota in disease. Microb Ecol Health Dis. 26:26191. DOI: 10.3402/mehd.v26.26191. PMID: 25651997. PMCID: PMC4315779.
crossref
8. Li SX, Armstrong A, Neff CP, Shaffer M, Lozupone CA, Palmer BE. 2016; Complexities of gut microbiome dysbiosis in the context of HIV infection and antiretroviral therapy. Clin Pharmacol Ther. 99:600–611. DOI: 10.1002/cpt.363. PMID: 26940481. PMCID: PMC4927263.
crossref
9. Manichanh C, Borruel N, Casellas F, Guarner F. 2012; The gut microbiota in IBD. Nat Rev Gastroenterol Hepatol. 9:599–608. DOI: 10.1038/nrgastro.2012.152. PMID: 22907164.
crossref
10. Federico A, Dallio M, DI Sarno R, Giorgio V, Miele L. 2017; Gut microbiota, obesity and metabolic disorders. Minerva Gastroenterol Dietol. 63:337–344. DOI: 10.23736/S1121-421X.17.02376-5. PMID: 28927249.
crossref
11. Wang Z, Wang Q, Zhao J, Gong L, Zhang Y, Wang X, Yuan Z. 2019; Altered diversity and composition of the gut microbiome in patients with cervical cancer. AMB Express. 9:40. DOI: 10.1186/s13568-019-0763-z. PMID: 30904962. PMCID: PMC6431307.
crossref
12. Sims TT, Colbert LE, Zheng J, Delgado Medrano AY, Hoffman KL, Ramondetta L, Jazaeri A, Jhingran A, Schmeler KM, Daniel CR, Klopp A. 2019; Gut microbial diversity and genus-level differences identified in cervical cancer patients versus healthy controls. Gynecol Oncol. 155:237–244. DOI: 10.1016/j.ygyno.2019.09.002. PMID: 31500892. PMCID: PMC6825899.
13. Kang GU, Jung DR, Lee YH, Jeon SY, Han HS, Chong GO, Shin JH. 2020; Dynamics of fecal microbiota with and without invasive cervical cancer and its application in early diagnosis. Cancers (Basel). 12:3800. DOI: 10.3390/cancers12123800. PMID: 33339445. PMCID: PMC7766064.
crossref
14. Cordaillat-Simmons M, Rouanet A, Pot B. 2020; Live biotherapeutic products: the importance of a defined regulatory framework. Exp Mol Med. 52:1397–1406. DOI: 10.1038/s12276-020-0437-6. PMID: 32908212. PMCID: PMC8080583.
crossref
15. Paquet JC, Claus SP, Cordaillat-Simmons M, Mazier W, Rawadi G, Rinaldi L, Elustondo F, Rouanet A. 2021; Entering first-in-human clinical study with a single-strain live biotherapeutic product: input and feedback gained from the EMA and the FDA. Front Med (Lausanne). 8:716266. DOI: 10.3389/fmed.2021.716266. PMID: 34458291. PMCID: PMC8385711.
crossref
16. Dreher-Lesnick SM, Stibitz S, Carlson PE Jr. 2017; U.S. regulatory considerations for development of live biotherapeutic products as drugs. Microbiol Spectr. 5:BAD–0017. DOI: 10.1128/microbiolspec.BAD-0017-2017. PMID: 28975881.
crossref
17. U.S. Food and Drug Administration. 2016. Early Clinical Trials with Live Biotherapeutic Products: Chemistry, Manufacturing, and Control Information [Internet]. U.S. Food and Drug Administration. https://www.fda.gov/regulatory-information/search-fda-guidance-documents/early-clinical-trials-live-biotherapeutic-products-chemistry-manufacturing-and-control-information. cited 2023 Dec 4.
18. Yu JS, Youn GS, Choi J, Kim CH, Kim BY, Yang SJ, Lee JH, Park TS, Kim BK, Kim YB, Roh SW, Min BH, Park HJ, Yoon SJ, Lee NY, Choi YR, Kim HS, Gupta H, Sung H, Han SH, et al. 2021; Lactobacillus lactis and Pediococcus pentosaceus-driven reprogramming of gut microbiome and metabolome ameliorates the progression of non-alcoholic fatty liver disease. Clin Transl Med. 11:e634. DOI: 10.1002/ctm2.634. PMID: 34965016. PMCID: PMC8715831.
19. Ye J, Erland LAE, Gill SK, Bishop SL, Verdugo-Meza A, Murch SJ, Gibson DL. 2021; Metabolomics-guided hypothesis generation for mechanisms of intestinal protection by live biotherapeutic products. Biomolecules. 11:738. DOI: 10.3390/biom11050738. PMID: 34063522. PMCID: PMC8156236.
crossref
20. Luerce TD, Gomes-Santos AC, Rocha CS, Moreira TG, Cruz DN, Lemos L, Sousa AL, Pereira VB, de Azevedo M, Moraes K, Cara DC, LeBlanc JG, Azevedo V, Faria AMC, Miyoshi A. 2014; Anti-inflammatory effects of Lactococcus lactis NCDO 2118 during the remission period of chemically induced colitis. Gut Pathog. 6:33. DOI: 10.1186/1757-4749-6-33. PMID: 25110521. PMCID: PMC4126083.
crossref
21. Jin SW, Lee GH, Jang MJ, Hong GE, Kim JY, Park GD, Jin H, Kim HS, Choi JH, Choi CY, Lee SG, Jeong HG, Hwang YP. 2020; Immunomodulatory activity of Lactococcus lactis GCWB1176 in cyclophosphamide-induced immunosuppression model. Microorganisms. 8:1175. DOI: 10.3390/microorganisms8081175. PMID: 32748895. PMCID: PMC7464527.
crossref
22. Peng X, Zhang R, Duan G, Wang C, Sun N, Zhang L, Chen S, Fan Q, Xi Y. 2018; Production and delivery of Helicobacter pylori NapA in Lactococcus lactis and its protective efficacy and immune modulatory activity. Sci Rep. 8:6435. DOI: 10.1038/s41598-018-24879-x. PMID: 29691472. PMCID: PMC5915382.
23. Kim S, Kim Y, Lee S, Kim Y, Jeon B, Kim H, Park H. 2022; Live biotherapeutic Lactococcus lactis GEN3013 enhances antitumor efficacy of cancer treatment via modulation of cancer progression and immune system. Cancers (Basel). 14:4083. DOI: 10.3390/cancers14174083. PMID: 36077619. PMCID: PMC9455052.
24. Kim SY, Kim JE, Lee KW, Lee HJ. 2009; Lactococcus lactis ssp. lactis inhibits the proliferation of SNU-1 human stomach cancer cells through induction of G0/G1 cell cycle arrest and apoptosis via p53 and p21 expression. Ann N Y Acad Sci. 1171:270–275. DOI: 10.1111/j.1749-6632.2009.04721.x. PMID: 19723065.
crossref
25. Kim JY, Woo HJ, Kim YS, Kim KH, Lee HJ. 2003; Cell cycle dysregulation induced by cytoplasm of Lactococcus lactis ssp lactis in SNUC2A, a colon cancer cell line. Nutr Cancer. 46:197–201. DOI: 10.1207/S15327914NC4602_13. PMID: 14690796.
crossref
26. Bohlul E, Hasanlou F, Taromchi AH, Nadri S. 2019; TRAIL-expressing recombinant Lactococcus lactis induces apoptosis in human colon adenocarcinoma SW480 and HCT116 cells. J Appl Microbiol. 126:1558–1567. DOI: 10.1111/jam.14237. PMID: 30815963.
27. Abooshahab R, Hooshmand K, Razavi SA, Gholami M, Sanoie M, Hedayati M. 2020; Plasma metabolic profiling of human thyroid nodules by gas chromatography-mass spectrometry (GC-MS)-based untargeted metabolomics. Front Cell Dev Biol. 8:385. DOI: 10.3389/fcell.2020.00385. PMID: 32612989. PMCID: PMC7308550.
crossref
28. Land MH, Rouster-Stevens K, Woods CR, Cannon ML, Cnota J, Shetty AK. 2005; Lactobacillus sepsis associated with probiotic therapy. Pediatrics. 115:178–181. DOI: 10.1542/peds.2004-2137. PMID: 15629999.
29. Kalia VC, Patel SKS, Cho BK, Wood TK, Lee JK. 2022; Emerging applications of bacteria as antitumor agents. Semin Cancer Biol. 86:1014–1025. DOI: 10.1016/j.semcancer.2021.05.012. PMID: 33989734.
30. Blachier F, Andriamihaja M. 2022; Effects of the L-tyrosine-derived bacterial metabolite p-cresol on colonic and peripheral cells. Amino Acids. 54:325–338. DOI: 10.1007/s00726-021-03064-x. PMID: 34468872.
31. Wypych TP, Pattaroni C, Perdijk O, Yap C, Trompette A, Anderson D, Creek DJ, Harris NL, Marsland BJ. 2021; Microbial metabolism of L-tyrosine protects against allergic airway inflammation. Nat Immunol. 22:279–286. DOI: 10.1038/s41590-020-00856-3. PMID: 33495652.
32. Musso NR, Brenci S, Indiveri F, Lotti G. 1997; L-tyrosine and nicotine induce synthesis of L-Dopa and norepinephrine in human lymphocytes. J Neuroimmunol. 74:117–120. DOI: 10.1016/S0165-5728(96)00212-3. PMID: 9119963.
33. Duboc H, Rajca S, Rainteau D, Benarous D, Maubert MA, Quervain E, Thomas G, Barbu V, Humbert L, Despras G, Bridonneau C, Dumetz F, Grill JP, Masliah J, Beaugerie L, Cosnes J, Chazouillères O, Poupon R, Wolf C, Mallet JM, et al. 2013; Connecting dysbiosis, bile-acid dysmetabolism and gut inflammation in inflammatory bowel diseases. Gut. 62:531–539. DOI: 10.1136/gutjnl-2012-302578. PMID: 22993202.
crossref
34. Brestoff JR, Artis D. 2013; Commensal bacteria at the interface of host metabolism and the immune system. Nat Immunol. 14:676–684. DOI: 10.1038/ni.2640. PMID: 23778795. PMCID: PMC4013146.
35. Dsouza M, Menon R, Crossette E, Bhattarai SK, Schneider J, Kim YG, Reddy S, Caballero S, Felix C, Cornacchione L, Hendrickson J, Watson AR, Minot SS, Greenfield N, Schopf L, Szabady R, Patarroyo J, Smith W, Harrison P, Kuijper EJ, et al. 2022; Colonization of the live biotherapeutic product VE303 and modulation of the microbiota and metabolites in healthy volunteers. Cell Host Microbe. 30:583–598.e8. DOI: 10.1016/j.chom.2022.03.016. PMID: 35421353.
36. Agus A, Planchais J, Sokol H. 2018; Gut microbiota regulation of tryptophan metabolism in health and disease. Cell Host Microbe. 23:716–724. DOI: 10.1016/j.chom.2018.05.003. PMID: 29902437.
37. Ghiboub M, Verburgt CM, Sovran B, Benninga MA, de Jonge WJ, Van Limbergen JE. 2020; Nutritional therapy to modulate tryptophan metabolism and aryl hydrocarbon-receptor signaling activation in human diseases. Nutrients. 12:2846. DOI: 10.3390/nu12092846. PMID: 32957545. PMCID: PMC7551725.
38. Lamas B, Richard ML, Leducq V, Pham HP, Michel ML, Da Costa G, Bridonneau C, Jegou S, Hoffmann TW, Natividad JM, Brot L, Taleb S, Couturier-Maillard A, Nion-Larmurier I, Merabtene F, Seksik P, Bourrier A, Cosnes J, Ryffel B, Beaugerie L, et al. 2016; CARD9 impacts colitis by altering gut microbiota metabolism of tryptophan into aryl hydrocarbon receptor ligands. Nat Med. 22:598–605. DOI: 10.1038/nm.4102. PMID: 27158904. PMCID: PMC5087285.
crossref
39. Zelante T, Iannitti RG, Cunha C, De Luca A, Giovannini G, Pieraccini G, Zecchi R, D'Angelo C, Massi-Benedetti C, Fallarino F, Carvalho A, Puccetti P, Romani L. 2013; Tryptophan catabolites from microbiota engage aryl hydrocarbon receptor and balance mucosal reactivity via interleukin-22. Immunity. 39:372–385. DOI: 10.1016/j.immuni.2013.08.003. PMID: 23973224.
40. Li Y, Innocentin S, Withers DR, Roberts NA, Gallagher AR, Grigorieva EF, Wilhelm C, Veldhoen M. 2011; Exogenous stimuli maintain intraepithelial lymphocytes via aryl hydrocarbon receptor activation. Cell. 147:629–640. DOI: 10.1016/j.cell.2011.09.025. PMID: 21999944.
crossref
41. Wang Q, Yang K, Han B, Sheng B, Yin J, Pu A, Li L, Sun L, Yu M, Qiu Y, Xiao W, Yang H. 2018; Aryl hydrocarbon receptor inhibits inflammation in DSSinduced colitis via the MK2/pMK2/TTP pathway. Int J Mol Med. 41:868–876. DOI: 10.3892/ijmm.2017.3262.
42. Nikolaus S, Schulte B, Al-Massad N, Thieme F, Schulte DM, Bethge J, Rehman A, Tran F, Aden K, Häsler R, Moll N, Schütze G, Schwarz MJ, Waetzig GH, Rosenstiel P, Krawczak M, Szymczak S, Schreiber S. 2017; Increased tryptophan metabolism is associated with activity of inflammatory bowel diseases. Gastroenterology. 153:1504–1516.e2. DOI: 10.1053/j.gastro.2017.08.028. PMID: 28827067.
crossref
43. Palego L, Betti L, Rossi A, Giannaccini G. 2016; Tryptophan biochemistry: structural, nutritional, metabolic, and medical aspects in humans. J Amino Acids. 2016:8952520. DOI: 10.1155/2016/8952520. PMID: 26881063. PMCID: PMC4737446.
44. Park J, Kim NE, Yoon H, Shin CM, Kim N, Lee DH, Park JY, Choi CH, Kim JG, Kim YK, Shin TS, Yang J, Park YS. 2021; Fecal microbiota and gut microbe-derived extracellular vesicles in colorectal cancer. Front Oncol. 11:650026. DOI: 10.3389/fonc.2021.650026. PMID: 34595105. PMCID: PMC8477046.
45. Moschen AR, Gerner RR, Wang J, Klepsch V, Adolph TE, Reider SJ, Hackl H, Pfister A, Schilling J, Moser PL, Kempster SL, Swidsinski A, Orth Höller D, Weiss G, Baines JF, Kaser A, Tilg H. 2016; Lipocalin 2 protects from inflammation and tumorigenesis associated with gut microbiota alterations. Cell Host Microbe. 19:455–469. DOI: 10.1016/j.chom.2016.03.007. PMID: 27078067.
46. Tilg H, Adolph TE, Gerner RR, Moschen AR. 2018; The intestinal microbiota in colorectal cancer. Cancer Cell. 33:954–964. DOI: 10.1016/j.ccell.2018.03.004. PMID: 29657127.
crossref
47. Park BH, Kim IS, Park JK, Zhi Z, Lee HM, Kwon OW, Lee BC. 2021; Probiotic effect of Lactococcus lactis subsp. cremoris RPG-HL-0136 on intestinal mucosal immunity in mice. Appl Biol Chem. 64:93. DOI: 10.1186/s13765-021-00667-6.
48. Nishiyama K, Kobayashi T, Sato Y, Watanabe Y, Kikuchi R, Kanno R, Koshizuka T, Miyazaki N, Ishioka K, Suzutani T. 2018; A double-blind controlled study to evaluate the effects of yogurt enriched with Lactococcus lactis 11/19-B1 and Bifidobacterium lactis on serum low-density lipoprotein level and antigen-specific interferon-γ releasing ability. Nutrients. 10:1778. DOI: 10.3390/nu10111778. PMID: 30453487. PMCID: PMC6266548.
49. Pan H, Sun T, Cui M, Ma N, Yang C, Liu J, Pang G, Liu B, Li L, Zhang X, Zhang W, Chang J, Wang H. 2022; Light-sensitive Lactococcus lactis for microbe-gut-brain axis regulating via upconversion optogenetic micro-nano system. ACS Nano. 16:6049–6063. DOI: 10.1021/acsnano.1c11536. PMID: 35362965.
crossref
50. Wang S. 2023; Multiscale adaptive differential abundance analysis in microbial compositional data. Bioinformatics. 39:btad178. DOI: 10.1093/bioinformatics/btad178. PMID: 37018137. PMCID: PMC10112958.
crossref
51. Bruijning M, Ayroles JF, Henry LP, Koskella B, Meyer KM, Metcalf CJE. 2023; Relative abundance data can misrepresent heritability of the microbiome. Microbiome. 11:222. DOI: 10.1186/s40168-023-01669-w. PMID: 37814275. PMCID: PMC10561453.
52. Taguer M, Maurice CF. 2016; The complex interplay of diet, xenobiotics, and microbial metabolism in the gut: Implications for clinical outcomes. Clin Pharmacol Ther. 99:588–599. DOI: 10.1002/cpt.366. PMID: 26950037.
crossref
53. Zeng Z, Liu W, Luo S, Hu C, Xu N, Huang A, Xi T, Xing Y. 2019; Shape of gastrointestinal immunity with non-genetically modified Lactococcus lactis particles requires commensal bacteria and myeloid cells-derived TGF-β1. Appl Microbiol Biotechnol. 103:3847–3861. DOI: 10.1007/s00253-019-09716-z. PMID: 30852661.
crossref

Fig. 1

Study design and sample collection time points.

LBP, live biotherapeutic product.
kjpp-28-2-153-f1.tif
Fig. 2

Pathway and network analyses.

(A) Pathway analysis results were significant at p < 0.05 and a pathway impact of 0.1. (B) Network analysis results were significant at a degree of ≥ 2, betweenness ≥ 1.0, and p < 0.05. Color boxes and numbers are indicated in the function table.
kjpp-28-2-153-f2.tif
Fig. 3

Alterations in the relative abundance of

Lactococcus lactis and Spearman’s correlation analysis between L. lactis and metabolites. Alterations in the relative abundance of L. lactis and Spearman’s correlation analysis between L. lactis and metabolites, (A) before and after GEN-001 administration, (B) with different GEN-001 doses, and (C) with or without dietary control. (D) Correlation analysis between L. lactis composition and metabolites in fecal samples 1–2 days after GEN-001 administration vs. predose. Values are presented as mean with standard deviation. Group A, four healthy adult men who take 1 × 10¹¹ CFU; Group B, four healthy adult men who take 3 × 10¹¹ CFU; Group C, four healthy adult men who take 6 × 10¹¹ CFU; Group D1, four healthy adult men who take 9 × 10¹¹ CFU without dietary control; Group D2, four healthy adult men who take 9 × 10¹¹ CFU with dietary control; CFU, colony forming unit. *p < 0.05 and **p < 0.01.
kjpp-28-2-153-f3.tif
Fig. 4

Genus level changes in microbial distribution.

(A) Gut microbial composition at genus levels before and after GEN-001 administration over time (groups A–D1). (B) Changes in the relative abundance (%) of Alistipes and Parabacteroides in the top 10 genera. (C) Changes in the relative abundance of genera used in probiotics (Lactobacillus, Lactococcus, and Bifidobacterium) after GEN-001 administration. (D) Spearman’s correlation analysis between the composition of the three probiotic genera and metabolites in fecal samples. Values are presented as mean with standard deviation. *p < 0.05.
kjpp-28-2-153-f4.tif
Fig. 5

Changes in concentrations of metabolites after GEN-001 administration.

(A) p-cresol sulfate (tyrosine metabolite), (B) Indole-3-acetic acid (tryptophan metabolite). Values are presented as mean with standard deviation. *p < 0.05.
kjpp-28-2-153-f5.tif
Table 1
Demographic characteristics of each study group
Variable Statistic Group A Group B Group C Group D1 Group D2 All subjects
No. of subjects - 4 4 4 4 4 20
Dose (CFU)a - 1 × 10¹¹ 3 × 10¹¹ 6 × 10¹¹ 9 × 10¹¹ 9 × 10¹¹ -
Dietary controlb (N/Y) - N N N N Y -
Sex - Male Male Male Male Male -
Age (y) Mean (SD) 34.00 (13.14) 27.50 (9.47) 25.00 (1.63) 25.00 (3.56) 26.50 (2.65) 27.60 (7.53)
Height (cm) Mean (SD) 170.13 (8.63) 177.18 (7.99) 174.13 (5.45) 173.58 (8.95) 173.95 (3.86) 173.79 (6.84)
Weight (kg) Mean (SD) 70.13 (6.77) 79.30 (12.67) 72.18 (2.36) 72.25 (9.89) 78.75 (3.37) 74.52 (8.10)
BMI (kg/m2) Mean (SD) 24.20 (2.06) 25.15 (2.89) 23.75 (0.90) 23.88 (2.22) 25.98 (1.04) 24.59 (1.95)
Alcohol (g/wk)
Yes n (%) 4 (100.0) 0 (0.0) 3 (75.0) 4 (100.0) 1 (25.0) 12 (60.0)
No n (%) 0 (0.0) 4 (100.0) 1 (25.0) 0 (0.0) 3 (75.0) 8 (40.0)
Caffeine (cups/day)
Yes n (%) 3 (75.0) 3 (75.0) 3 (75.0) 2 (50.0) 1 (25.0) 12 (60.0)
No n (%) 1 (25.0) 1 (25.0) 1 (25.0) 2 (50.0) 3 (75.0) 8 (40.0)

Group A, administration of 1 capsule; Group B, administration of 3 capsules; Group C, administration of 6 capsules; Group D1, administration of 9 capsules without dietary control; Group D2, administration of 9 capsules with dietary control; BMI, body mass index; SD, standard deviation. aCFU, colony forming unit. 1 capsule is 1 × 10¹¹ CFU. bGroup D2 was dietary controlled a week before GEN-001 administration.

TOOLS
Similar articles