

 PDF
PDF Citation
 Print
Print


INTRODUCTION
Obesity is a significant global health concern, and its prevalence has doubled worldwide since 1980. In 2009, the World Health Organization reported that over half a billion adults worldwide were overweight [1]. Obesity is a major contributing risk factor for various diseases, including dyslipidemia and hepatic steatosis [2]. Approved medications for obesity treatment often carry side effects and the potential for drug abuse [3]. While several anti-obesity agents are effective for weight loss, many of them have limitations related to safety [4]. Throughout history, natural products derived from plants have been used as medicines and have proven to be a successful source of potential drugs. Mentha canadensis (MA), a plant species in the Lamiaceae family, is commonly known as an East Asian wild mint in Asia [5]. Compared to other mint species, it is particularly rich in natural menthol and pulegone, with menthol extensively used in various pharmaceutical preparations [67]. Mentha piperita, which belongs to the same genus as MA, is commonly used in Brazil for therapeutic purposes. Its usage has shown a reduction in body weight gain and improved lipid profiles in animals given juice extracted from its leaves [8]. However, no studies have investigated the anti-obesity effects of MA or elucidated its underlying mechanism. Therefore, the present study aimed to evaluate and characterize the molecular mechanism by which MA extracts exert anti-metabolic syndrome effects in diet-induced obese (DIO) mice.
MATERIALS AND METHODS
Sample preparation
MA was sourced from Puremind Co., Ltd. (Yeongcheon, Korea). The MA extract was obtained through an ultrasonic extraction process using 70% alcohol for more than 5 h, twice, at a temperature of 30°C (25 kW, 700–800 kHz). The resulting extract was filtered to remove any raw material residue, following the same method used for MA extraction. The MA extraction was then collected, concentrated, and freeze-dried. The yield of the extraction process was 33.72%. The dose of the MA alcohol extract was determined by previous studies [59].
Experimental animals and diet
Four-week-old male C57BL/6J mice (n = 35) were obtained from the Jackson Laboratory (Bar Harbor, ME, USA). Upon arrival, all mice were individually housed in the same room with a 12-h light-dark cycle at a controlled temperature of 22 ± 2°C. For the first week, they were fed a normal chow diet. Subsequently, the mice were randomly divided into 2 groups. One group (n = 10) continued to receive the normal chow diet (ND), while the other group (n = 25) was fed a high-fat diet (HFD) consisting of 60% of kilocalories from fat. This HFD feeding lasted for 4 weeks, aiming to induce obesity. After the obesity induction period at 9 weeks of age, the mice fed the HFD were randomly assigned to 2 groups. One group (n = 15) continued to receive the HFD alone (HFD group), while the other group (n = 10) received the HFD supplemented with 1.5% (w/w) MA ethanol extract (MA group) for a duration of 13 weeks (Table 1). Throughout the experimental period, all mice had free access to both food and distilled water. The body weight and food intake of all mice were regularly measured. All procedures conducted in this study were approved by the Animal Ethics Committee of Kyungpook National University (Approval No. 2017-0117).
Table 1
Diet composition for animal experiment

ND, normal diet (AIN-93G, 16% kcal from fat); HFD, high-fat diet (60% kcal from fat); MA, high-fat diet + Mentha canadensis ethanol extract (1.5%, w/w); TBHQ, tert-butylhydroquinone.
1)AIN-93G-mineral mixture (g/kg): calcium carbonate anhydrous, 357; potassium phosphate monobasic, 196; potassium citrate tripotassium monohydrate, 70.78; sodium chloride, 74; potassium sulfate, 46.60; magnesium oxide, 24; ferric citrate, 6.06; zinc carbonate, 1.65; sodium meta-silicate·9H2O, 1.45; manganous carbonate, 0.63; cupric carbonate, 0.30; chromium potassium sulfate·12H2O, 0.275; boric acid, 0.0815; sodium fluoride, 0.635; nickel carbonate, 0.0318, lithium chloride, 0.0174, sodium selenite anhydrous, 0.01025; potassium iodate, 0.010; ammonium paramolybdate·4H2O, 0.00795; ammonium vanadate 0.0066; powdered sucrose, 221.026.
2)AIN-93G-vitamin mixture (g/kg): nicotinic acid, 3; Ca pantothenate, 1.6; pyridoxine-HCl, 0.7; thiamin-HCl, 0.6; riboflavin, 0.6; folic acid, 0.2; biotin, 0.02; vitamin B-12 (cyanocobalamin), 2.5; vitamin E (all-rac-α-tocopheryl acetate), 15; vitamin A (all-trans-retinyl palmitate), 0.8; vitamin D-3 (cholecalciferol), 0.25; vitamin K-1 (phylloquinone), 0.075; powdered sucrose, 974.655.
Blood analysis
Plasma concentrations of total cholesterol (TC), high-density lipoprotein cholesterol (HDL-C), triglyceride (TG), and glucose were determined using commercial kits (Asan Pharm Co., Seoul, Korea). Plasma free fatty acid (FFA) concentration was determined using a commercial kit from Wako Chemicals (Osaka, Japan). Apolipoprotein (Apo) A-I and ApoB100 levels were measured using enzymatic kits (Eiken Chemical Co., Tokyo, Japan). NonHDL-C, HDL-C to TC (HTR), and atherogenic index (AI) were calculated as follows:
Plasma levels of insulin, GIP, GLP-1, leptin, PAI-1, IFN-γ, IL-1β, IL-6, and IL-10 were measured using a MILLIPLEX kit (Merck Millipore, Billerica, MA, USA). All assays were performed according to the manufacturers’ instructions.
Measures of hepatic and fecal lipid contents
Hepatic and fecal lipids were extracted following the method of Folch et al. [10]. Fecal samples from each group were collected daily for a week and subjected to lipid extraction. The dried hepatic lipid residues were dissolved in 1 mL of ethanol for subsequent analysis of TG, cholesterol, and FA. Emulsification of the dissolved lipid solution was achieved by adding Triton X-100 and a sodium cholate solution in distilled water to a final volume of 200 µL. Fecal samples were dried and extracted using an ice-cold mixture of chloroform and methanol (2:1 v/v) for 24 h at 4°C. After centrifugation at ×900 g for 10 min, the supernatant was collected, dried at 50°C, and dissolved in ethanol. The concentrations of hepatic and fecal TG, cholesterol, and FA were analyzed using the same enzymatic kits employed for the plasma analyses.
Activity measures of hepatic lipid-regulating enzymes
Hepatic mitochondrial, cytosolic, and microsomal fractions were prepared as previously described with slight modifications [11]. Protein concentrations were determined by Bradford method [12], and cytosolic fatty acid synthase (FAS) activity was measured by monitoring the malonyl coenzyme A (CoA)-dependent oxidation of NADPH at 340 nm [13]. Cytosolic malic enzyme activity was measured according to the method of Ochoa et al. [14] by the production of cytosolic NADPH at 340 nm. Cytosolic G6PD activity was determined based on the reduction of 1 µmol of NADP per minute at 25°C, measured at 340 nm using a spectrophotometer, as described by Russo et al. [15]. Mitochondrial FA β-oxidation was measured by monitoring the reduction of NAD+ to NADH at 340 nm [16], while mitochondrial carnitine palmitoyl-CoA reductase activity was assayed following the method described by Markwell et al. [17]. Microsomal phosphatidate phosphatase activity was determined using a spectrophotometric method [18].
RNA isolation and gene expression analysis
All tissues were prepared and analyzed as previously described [19]. Total RNA was reverse transcribed to cDNA using the QuantiTect Reverse Transcription kit (Qiagen, Hilden, Germany). RNA expression was quantified by real-time quantitative polymerase chain reaction (PCR) using the QuantiTect SYBR Green PCR kit (Qiagen) and a SDS7000 sequence-detection system (Applied Biosystems, Foster City, CA, USA). Primers were designed to detect acetyl-CoA carboxylase (Acc1, 107476), CCAAT enhancer binding protein beta (C/ebpb, 12608), stearoyl-CoA desaturase 1 (Scd1, 20249), sterol regulatory element binding protein-1 (Srebp1, 20787), uncoupling protein 1(Ucp1, 22227), carnitine palmitoyltransferase 1 (Cpt1, 12894), peroxisome proliferator activated receptor alpha (Ppara, 19013), acetyl-CoA carboxylase beta (Acc2, 100705), peroxisome proliferative activated receptor, gamma, coactivator 1 alpha (Pgc1a, 19017), interleukin 6 (Il6, 16193), sirtuin 1 (Sirt1, 93759), tumor necrosis factor (Tnfa, 21926), tumor necrosis factor receptor superfamily, member 12a (Tnfrsf12a, 27279), tumor necrosis factor receptor superfamily, member 10b (Tnfrsf10b, 21933), 3-hydroxy-3-methylglutaryl-CoA reductase (Hmgcr, 15357), and acyl-CoA thioesterase 10 (Acat, 64833). Amplification was performed as follows: 95°C for 10 min, followed by 95°C for 15 s and 60°C for 60 s for 40 cycles. Cycle threshold values were normalized using glyceraldehyde-3-phosphate dehydrogenase (Gapdh). Relative gene expression was calculated using the 2−ΔΔCT method [20].
Morphology of liver and fat tissues
Liver and epididymal white adipose tissue (eWAT) were excised from the mice and immersed in a 10% formalin buffer solution for fixation. Subsequently, the fixed tissues were processed using standard procedures for paraffin embedding. Sections with a thickness of 4 μm were prepared and stained with hematoxylin and eosin as well as Masson’s trichrome (MT). The stained sections were observed under an optical microscope (Nikon, Tokyo, Japan) at a magnification of 200×.
Energy expenditure (EE)
EE was measured using an Oxylet indirect calorimeter (Panlab, Cornella, Spain). The mice were individually placed in metabolic chambers at a temperature of 25°C, with ad libitum access to food and water. The oxygen (O2) and carbon dioxide (CO2) analyzers were calibrated using highly purified gas standards. Whole-body oxygen consumption (VO2) and carbon dioxide production (VCO2) were recorded at 3-min intervals using a computer-assisted data acquisition program (Chart 5.2; AD Instruments, Sydney, Australia) throughout a 24-h period. The data were averaged for each mouse. EE was calculated using the following equation:
RESULTS
MA supplementation reduces body weight and body fat in mice
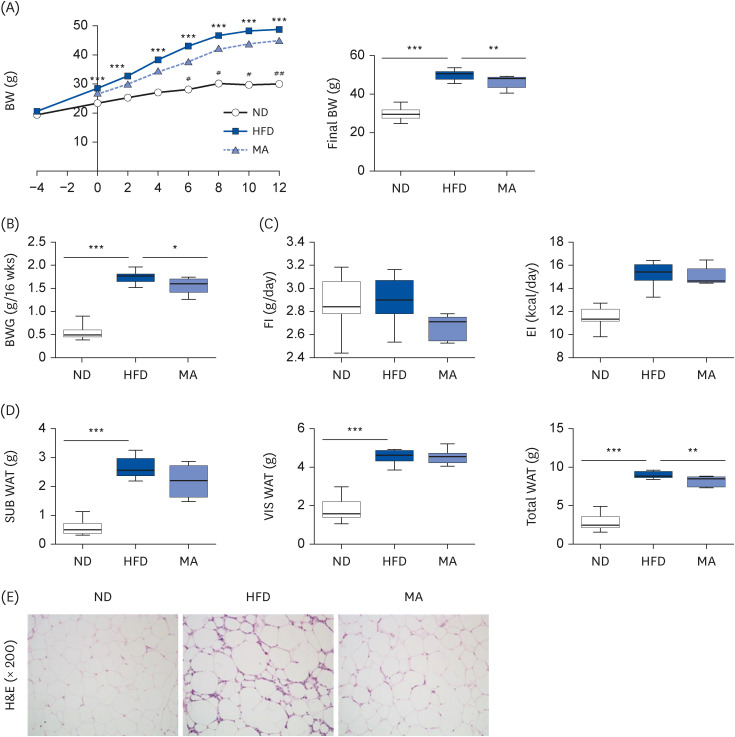
After a 4-week period of obesity induction, mice fed a HFD exhibited a significant increase in body weight compared to mice in the ND group, indicating DIO in the HFD group. However, dietary supplementation with MA resulted in a marked decrease in body weight and body weight gain, attributed to a reduction in food and energy intake (Fig. 1A-C). Furthermore, while there were no significant differences in the weights of subcutaneous and visceral white adipose tissue (WAT), the total WAT weight was significantly lower in the MA-treated group compared to the HFD group (Fig. 1D). These findings were consistent with the observed morphology of eWAT (Fig. 1E).
Fig. 1
Effects of 13-week Mentha Canadensis extract supplementation on body and adipocyte weights and eWAT morphology in C57BL/6J mice fed a HFD. (A) Changes in BW, (B) BWG, (C) FI and EI, (D) WAT weight, and (E) eWAT morphology. Data are presented as the mean ± SE. Representative eWAT photomicrographs shown at 200× magnification.
ND, normal diet; HFD, high-fat diet (20% fat and 1% cholesterol); MA, high-fat diet + Mentha canadensis ethanol extract (1.5%, w/w); H&E, hematoxylin and eosin-stained transverse section of epididymal white adipose tissue; eWAT, epididymal white adipose tissue; BW, body weight; BWG, body weight gain; FI, food intake; EI, energy intake; SUB, subcutaneous; VIS, visceral.
Mann Whitney U t-test; *P < 0.05, **P < 0.01, ***P < 0.001 vs. control.
MA supplementation increases EE and regulates associated gene expression of HFD mice
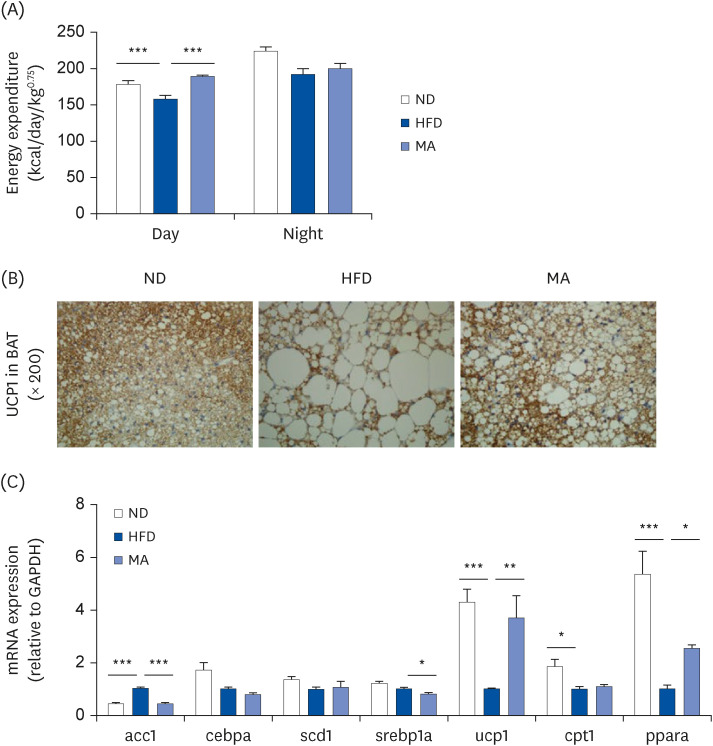
Hourly assessments of EE were conducted, and the results are presented in Fig. 2A. We observed a significant decrease in EE during the day compared to the nighttime measurements. However, in mice supplemented with MA, daytime EE was markedly higher compared to the HFD group. Immunohistochemical analysis of brown adipose tissue (BAT) revealed a significant increase in Ucp1 expression and smaller BAT adipocyte size in the MA-supplemented group compared to the HFD group (Fig. 2B). Additionally, we analyzed the mRNA expression of 7 genes associated with lipid metabolism in eWAT (Fig. 2C) and found that MA supplementation significantly reduced the expression of Acc1 and Srebp1a, while increasing the expression of Ucp1 and Ppara compared to the HFD group.
Fig. 2
Effects of 13-week Mentha canadensis extract supplementation on energy expenditure in C57BL/6J mice fed a HFD. (A) Measures of energy expenditure. (B) Immunohistochemistry of UCP1 staining in BAT (magnification 200×). (C) Measures of epididymal white adipose tissue mRNA expression of genes related to lipid metabolism. Data are presented as the mean ± SE.
ND, normal diet; HFD, high-fat diet (20% fat and 1% cholesterol); MA, high-fat diet + Mentha canadensis ethanol extract (1.5%, w/w); BAT, brown adipose tissue; GAPDH, glyceraldehyde-3-phosphate dehydrogenase.
Mann Whitney U t-test; *P < 0.05, **P < 0.01, ***P < 0.001 vs. control.
MA supplementation improves hepatic steatosis by altering enzymatic activity and gene expression of HFD mice
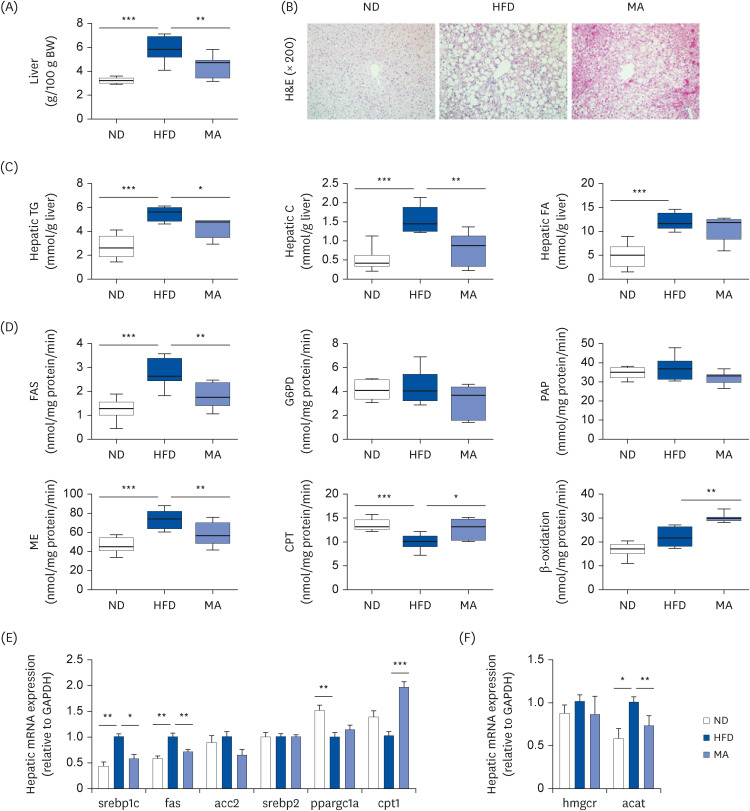
Furthermore, we observed that the HFD-induced increases in liver weight and hepatic lipid levels, including TG, cholesterol, and FFAs, were significantly attenuated by the administration of MA supplements (Fig. 3A and C). Additionally, the activities of FAS and malic enzyme were significantly reduced, while β-oxidation levels were significantly increased in mice from the MA group compared to the HFD group (Fig. 3D). Moreover, the mRNA expression of Srebp1c, Fas, and Acat was significantly decreased, whereas Cpt1 expression was increased in the MA group compared to the HFD group (Fig. 3E and F). These results were consistent with our morphological observations, as evidenced by the reduced formation of lipid droplets in the liver tissue of mice in the MA group compared to those in the HFD group (Fig. 3B).
Fig. 3
Effects of 16-week Mentha canadensis supplementation on hepatic steatosis-related biomarkers in C57BL/6J mice fed a HFD. (A) Measures of liver weight. (B) Photomicrographs showing hepatic morphology (magnification 200×). Measures of (C) hepatic lipid contents and (D) hepatic enzyme activities related to lipid metabolism. (E, F) Hepatic mRNA expression levels of genes involved in lipid metabolism. Data are presented as the mean ± SE.
ND, normal diet; HFD, high-fat diet (20% fat and 1% cholesterol); MA, high-fat diet + Mentha canadensis ethanol extract (1.5%, w/w); FAS, fatty acid synthase, G6PD, glucose-6-phosphatedehydrogenase; PAP, phosphatidate phosphatase; ME, malic enzyme; CPT, carnitine palmitoyl-coenzyme A reductase; BW, body weight; TG, triglyceride; FA, fatty acid; FAS, fatty acid synthase; GAPDH, glyceraldehyde-3-phosphate dehydrogenase.
Mann Whitney U t-test; *P < 0.05, **P < 0.01, ***P < 0.001 vs. control.
MA supplementation ameliorates plasma lipid profile and increases fecal lipid content of HFD mice
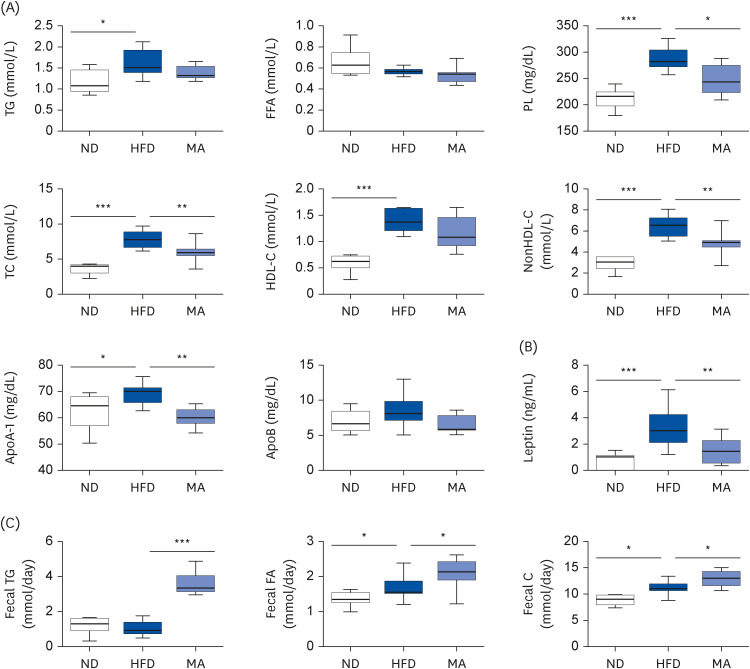
The plasma lipid profiles of our study groups are presented in Fig. 4A. We did not observe any significant differences in plasma levels of TG, FFA, and ApoB between the HFD and MA-supplemented groups. However, mice fed a HFD exhibited significant increases in plasma phospholipid (PL), TC, nonHDL-C, and ApoA-1 levels compared to those in the ND group. Interestingly, mice in the MA-supplemented group displayed lower values for these variables than those in the HFD group, along with an increase in fecal excretion of TG, FA, and cholesterol (Fig. 4C). Additionally, we observed a significant decrease in plasma leptin levels in the MA group compared to the HFD group (Fig. 4B).
Fig. 4
Effects of 16-week Mentha canadensis supplementation on plasma and fecal lipid contents in C57BL/6J mice fed a HFD. (A) Plasma lipid profiles. (B) Plasma leptin levels. (C) Fecal lipid contents. Data are presented as the mean ± SE.
ND, normal diet; HFD, high-fat diet (20% fat and 1% cholesterol); MA, high-fat diet + Mentha canadensis ethanol extract (1.5%, w/w); TG, triglyceride; FFA, free fatty acid; PL, phospholipid; TC, total cholesterol; C, cholesterol; HDL, high-density lipoprotein; Apo, apolipoprotein.
Mann Whitney U t-test; *P < 0.05, **P < 0.01, ***P < 0.001 vs. control.
MA supplementation ameliorates fibrosis and reduces cytokine secretion of HFD mice
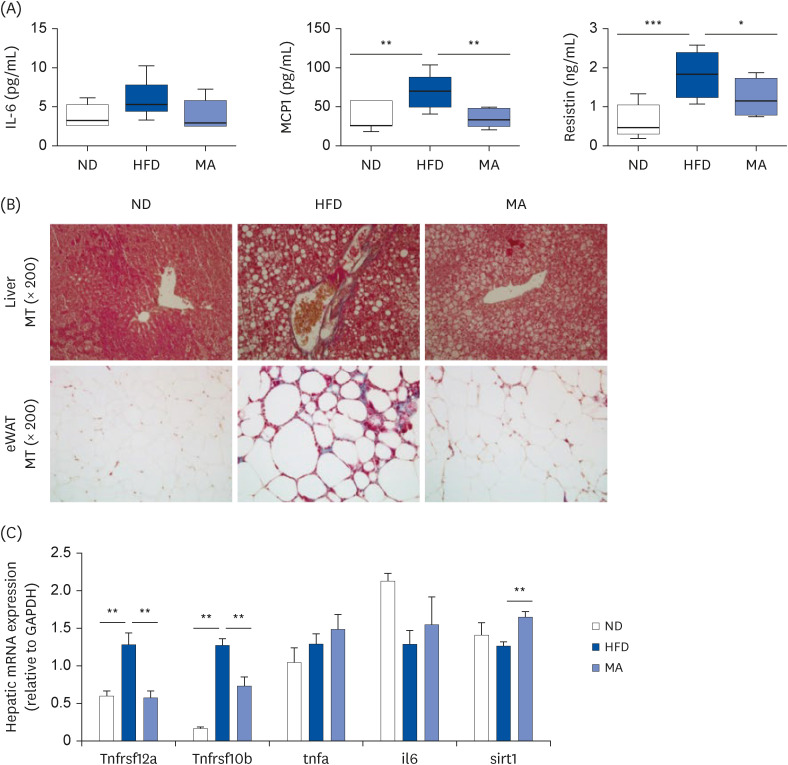
Furthermore, we observed a significant decrease in plasma levels of inflammatory cytokines MCP1 and resistin in the MA group (Fig. 5A). MT staining of liver tissue and eWAT revealed the presence of fibrosis (blue color) in the HFD group, while no evidence of fibrosis was observed in mice from the ND or MA group. In fact, the tissue specimens from the MA group displayed a similar appearance to those from the ND group. Additionally, we found that hepatic mRNA expression of Tnfrsf12a, Tnfrsf10b, and Sirt1 was significantly lower in the MA-supplemented group compared to the HFD group.
Fig. 5
Effects of 16-week Mentha canadensis supplementation on inflammation and fibrosis biomarkers in C57BL/6J mice fed a HFD. (A) Plasma cytokine levels. (B) MT staining of eWAT and hepatic tissue (magnification 200×). (C) Hepatic mRNA expression levels of inflammation-related genes. Data are presented as the mean ± SE.
ND, normal diet; HFD, high-fat diet (20% fat and 1% cholesterol); MA, high-fat diet + Mentha canadensis ethanol extract (1.5%, w/w); IL-6, interleukin 6; MCP1, monocyte chemoattractant protein-1; eWAT, epididymal white adipose tissue; MT, Masson’s trichrome; GAPDH, glyceraldehyde-3-phosphate dehydrogenase.
Mann Whitney U t-test; *P < 0.05, **P < 0.01, ***P < 0.001 vs. control.
DISCUSSION
In the present study, we aimed to investigate the anti-obesity properties of MA and the potential mechanisms underlying its metabolic regulation in the context of an obesogenic diet. It is well known that when energy intake surpasses EE, it leads to an increase in body weight, with excess energy being stored as TGs in adipose tissue, ultimately resulting in overweight or obesity [2122]. In our experimental design, mice were fed either a ND or a HFD to induce obesity over a 4-week period. The HFD-fed mice were then divided into 2 groups: the HFD group and the HFD with MA group. We observed that MA supplementation significantly suppressed body weight and reduced body fat during the experimental period, despite no changes in food and energy intakes. To support these findings, we also measured the metabolic rate, which showed a significant increase in EE in the MA group compared to the HFD group. In the process of adapting to protect the body from hypothermia, BAT, which is the best-known thermogenic system, expresses high levels of Ucp1 to dissipate energy in the form of heat by uncoupling mitochondrial proton gradients during mitochondrial respiration [23]. Ucp1 acts as a major regulator of adaptive thermogenesis, involving the uncoupling of oxidative phosphorylation from ATP synthesis by dissipating the proton gradient [24]. Similarly, EE is induced in response to excessive caloric intake, and animals with reduced thermogenic function are susceptible to DIO [25]. In our study, the MA supplementation significantly increased EE by inducing a notable upregulation of UCP1 expression in BAT, leading to a reduction in DIO. MA supplementation upregulated the expression of Ucp1 in BAT and regulated the mRNA expression of genes related to lipid metabolism in eWAT.
The development of non-alcoholic fatty liver disease (NAFLD) is often associated with an increase in dietary lipids or adipocyte lipolysis, leading to elevated levels of FFAs [26]. Most obese individuals experience an increase in lipolysis from expanded fat cell mass, resulting in elevated FFA [27]. In the MA-supplemented group, we observed an elevation in lipogenesis through the upregulation of the FAS-related gene Acc1 in eWAT, which helps prevent the transport of FFAs into the liver. The liver plays a crucial role in metabolic abnormalities, and the prevalence of metabolic syndrome and NAFLD is closely linked to obesity [28]. Dysregulation of lipid metabolism in the liver leads to abnormal accumulation of lipid droplets, known as hepatic steatosis [29]. MA supplementation increased Srebp1-c expression compared with HFD group, subsequently activating Fas, a transcription factor involved in FA and TG synthesis [30]. Additionally, MA supplementation upregulated the expression of the FA oxidation-related gene Cpt1. In the liver, FAs are converted to acyl-CoA, which is shuttled into mitochondria through Cpt1 for β -oxidation. Acetyl-CoA, produced through glycolysis, is carboxylated by ACC2 to form malonyl-CoA, which inhibits Cpt1 and the transfer of acyl-CoA for β-oxidation [31].
Our findings indicated a significant reduction in both liver weight and the size of lipid droplets in the liver. Similarly, hepatic lipid contents, including TG and cholesterol were decreased in mice of the MA-supplemented group. Moreover, MA supplementation increased the expression of hepatic Ppargc1a and Cpt1, while decreasing the expression of Srebp1c and Acc2 compared to the HFD group. We also observed decreased levels of Acat and reduced hepatic cholesterol synthesis gene expression, as well as downregulation of malic enzyme activity in the MA group compared to the HFD group. Based on these findings, MA supplementation appears to exert a protective effect on liver disease, which normally progresses to fibrosis and cirrhosis, through the suppression of hepatic steatosis.
In our study, we also measured plasma markers including TC, PL, nonHDL-C, and ApoA levels. All these markers were decreased in the MA group. The reduction in HDL-C level in the MA-supplemented group can be attributed to a decrease in plasma TC concentration. Many sphingolipids and PLs have been implicated in obesity, insulin resistance, type-2 diabetes mellitus, and cardiovascular disease [1531]. HFD significantly elevated plasma PL levels, whereas MA supplementation effectively lowered PL levels in mice. Therefore, MA supplementation may help prevent metabolic syndrome by suppressing body and liver weight and preventing dyslipidemia.
Adiposity is associated with the production and release of several inflammatory mediators, contributing to chronic low-grade inflammation [3233]. Leptin, an adipokine primarily expressed in adipose tissue, plays a major role in the regulation of body weight [34]. Leptin can modulate the production of pro-inflammatory adipokines/cytokines. We found that MA supplementation significantly reduced plasma leptin levels and markedly decreased the levels of pro-inflammatory cytokines MCP1 and resistin. Additionally, the morphology of the liver and eWAT indicated an anti-fibrotic condition in the MA group, showing less advanced fibrosis. We also observed a significant decrease in the expression of inflammation-related genes (Tnfrsf12a, Tnfrsf10b, and Sirt1) in the liver and eWAT of the MA group compared to the HFD group. These results suggest that dietary MA treatment improves obesity-related inflammation, including reduced fibrosis in both eWAT and liver, by altering gene expression and plasma adipokine levels.
Our study has several limitations in the experimental design. The use of a single dosage of MA treatment prevents us from observing the concentration-dependent effects of MA extract. Furthermore, the absence of a positive control group results in insufficient evidence for the development of MA extract as an anti-obesity functional pharmaceutical material. We will perform the follow-up studies to verify the appropriate dosage in the near future. Additionally, we intend to establish a positive control group to secure the rationale for the development of MA extract as an anti-obesity functional pharmaceutical material
MA effectively suppresses body weight and increases daily EE. Further, MA improves hepatic steatosis by regulating the activities of lipid-metabolism-related enzymes and the expression of associated mRNA. Moreover, MA alleviates obesity-related inflammation by reducing cytokine secretion and modulating mRNA expression. These findings from our study demonstrate the potential of MA supplementation in effectively mitigating DIO and its associated complications.
 XML Download