

 PDF
PDF Citation
 Print
Print


INTRODUCTION
Myocarditis is an inflammatory disease of the myocardium; it is caused by diverse infectious and non-infectious conditions. Viral infection and post-viral immune-mediated responses are common causes of myocarditis. The symptoms of typical myocarditis include acute chest pain, shortening of breath, palpitation, or a combination of these symptoms.12 Myocarditis can progress to heart failure or asymptomatic left ventricular dysfunction.3
Coronavirus disease 2019 (COVID-19) vaccine-associated myocarditis (VAM) has been reported infrequently due to the recent rise in the rate of administration of COVID-19 messenger ribonucleic acid (mRNA) vaccines. The reported incidence of COVID-19 VAM is 1 in 200,000 people. According to known American and Israeli studies, COVID-19 VAM tends to occur within one week of inoculation; it has been reported to occur more frequently in young men, especially after the second vaccination.4 However, in South Korea, according to the report of the Korea Disease Control and Prevention Agency, there was no significant difference between the incidence of COVID-19 VAM with regard to gender and heart abnormalities were reported regardless of age. Further, more side effects were observed after the first vaccination than the second.
Cardiac magnetic resonance (CMR) imaging plays an important role for the non-invasive evaluation of myocardial tissues in acute myocarditis and helps to predict the prognosis of acute myocarditis on the basis of certain phenotypic characteristics.56 According to several published papers, the CMR imaging features of COVID-19 VAM and other types of myocarditis showed a pattern similar to that of myocardial injury.78 Despite the differences in clinical aspects between patients from South Korea and countries from the west, very few studies regarding the differences of CMR imaging characteristics between COVID-19 VAM and other types of myocarditis have been conducted in South Korea.
Therefore, the aim of the present study is to compare the clinical manifestations and CMR imaging characteristics of COVID-19 VAM and other types of myocarditis in South Korean subjects.
METHODS
Study design and population
From January 2020 to March 2022, a total of 43 patients underwent CMR imaging owing to the clinical suspicion of acute myocarditis at the Chonnam National University Hospital, Gwangju, Korea. In this study, acute myocarditis was diagnosed in patients based on both clinical presentations suggestive of myocarditis and the fulfilment of the Modified Lake Louise criteria for acute myocarditis on CMR.9 The enrolled patients were classified into two groups according to their COVID-19 vaccination history: COVID-19 VAM (symptom onset within 14 days of vaccine administration with no other cause of myocarditis identified) and other types of myocarditis (all other patients meeting the inclusion criteria without temporally associated COVID-19 vaccine administration or known COVID-19 illness).1011
Collection of clinical data
By reviewing the medical records of the patients retrospectively, the patients’ demographic characteristics, social history, underlying disease status, vaccination status, symptoms at presentation, laboratory findings, including the peak troponin I, peak creatine kinase-myocardial band, peak C-reactive protein, and peak brain natriuretic peptide levels, and electrocardiography data, were investigated. Further, adverse clinical events (ACEs), including the development of clinically significant arrhythmias, persistent systolic dysfunction, sudden cardiac arrest, or death were investigated for evaluating the prognosis of the patients. We considered persistent systolic dysfunction when a patient continued to show systolic dysfunction (left ventricular ejection fraction < 55%) on echocardiogram for more than 6 months, even after recovery from myocarditis.
Magnetic resonance imaging (MRI) technique
The CMR imaging analyses were performed using a 3 Tesla scanner (Magnetom Vida; Siemens, Munich, Germany) containing cardiac surface coils. The protocols for MRI were as follows: long-axis and short-axis true fast imaging with steady-state free precession, preparation of slices (inter-slice gap, 2 mm; slice thickness, 8 mm), and fat-saturated T2 weighted turbo spin echo. For acquiring the late gadolinium enhancement (LGE) images, the phase-sensitive inversion recovery technique was performed 10 minutes after the intravenous injection of contrast media (Dotarem; Guerbet, Villepinte, France).12 Short-axis T1 and T2 mapping slice data of the mid-level ventricle were obtained using the modified Look-Locker inversion recovery (MOLLI) method for native T1 and post T1 mapping,13 and T2 preparation method for native T2 mapping.14
CMR imaging analysis
The CMR imaging interpretation was performed by one experienced cardiovascular radiologist. Cardiac function was assessed using short-axis images. The Syngo.via software on the SIEMENS workstation facilitated image processing. The endocardium and epicardium were delineated slice by slice, starting from the apex and extending to the level of the mitral valve on the heart’s short axis. Both the papillary muscle and chordae tendineae were factored into the heart function measurement.
For the analysis of LGE, the presence and dominant pattern of LGE were evaluated visually. The presence of lateral or septal involvement was evaluated whether there was LGE in the corresponding segment. Regarding the LGE involvement score, we considered the sum of the scores of the apical lateral segment, mid anterolateral/inferolateral segments, and basal anterolateral/inferolateral segments as the lateral involvement score, and the sum of the scores of the apical septal segment, mid anteroseptal/inferoseptal segments, and basal anteroseptal/inferolateral segments as the septal involvement score. The dominant pattern of LGE was categorized as follows: subepicardial, mid-wall, and subendocardial LGE.
We used a semi-quantitative analysis method to evaluate the degree of LGE. Unlike myocardial infarction, patients with myocarditis tend to have faint LGE, especially in mild cases.9 So general quantification methods would be difficult.1516 Additionally, it was reported that semi-quantitative analysis can be useful in evaluating myocarditis. According to the American Heart Association (AHA) 17-segment model, the degree of LGE was quantified by segmental scoring as follows: 0 (0%), 1 (1–25%), 2 (26–50%), 3 (51–75%), and 4 (76–100%).17 Likewise, according to the AHA recommendations, the native T1 and T2 values of each segment were obtained by region-of-interest analysis. We used the local reference based on CMR images taken in 10 volunteers with normal cardiac function (native T1 at 1,185.4 ± 25.5 ms, native T2 at 35.6 ± 5.4 ms, respectively). If there was a native T1 or T2 value higher than 2 standard deviations above the mean of sequence-specific local reference values, it was defined as high native T1 or T2 (high native T1 > 1,270 ms and high native T2 > 46 ms at 3 T).18
Additionally, we obtained the extracellular volume (ECV) fraction of each patient from CMR and clinical data, calculated the average ECV fraction for each group, and compared them statistically. The normal value of ECV fraction was referred to previous literature (0.26 ± 0.04, 3 T, MOLLI), because in the case of CMR using a contrast agent, it was difficult to obtain test volunteers.19
Statistical analysis
To compare variables between the groups of subjects with COVID-19 VAM and other types of myocarditis, categorical variables, such as CMR imaging findings, were analyzed using Fisher’s exact or Pearson’s χ2 test. Continuous variables were analyzed using the Mann-Whitney U test. All statistical analyses were performed using a statistical software (IBM SPSS statistics 25.0; IBM Corp., Armonk, NY, USA), and results with P values less than 0.050 were considered statistically significant.
RESULTS
Demographics and clinical outcomes of the patients
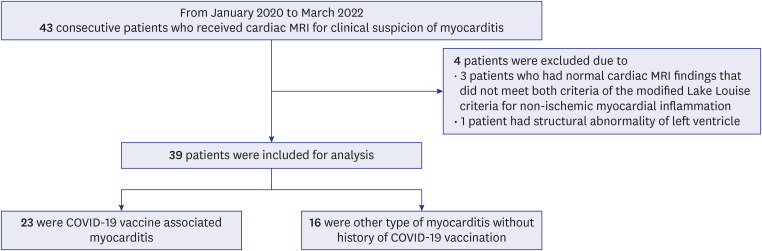
Of the 43 patients who underwent CMR imaging for the clinical suspicion of acute myocarditis, 4 patients were excluded. Of the excluded patients, 3 patients had normal CMR findings that did not meet both criteria of the Modified Lake Louise criteria for non-ischemic myocardial inflammation, and 1 patient had an underlying structural abnormality of the heart (Fig. 1). Patients underwent outpatient follow-up after being discharged after improvement in acute symptoms. Considering that mass vaccination occurred from 2021 to 2022, follow-up records for at least one year were referred and the average clinical follow-up duration of all patients was 20.1 ± 6.5 months.
Fig. 1
Flow chart detailing the patient selection procedure.
MRI = magnetic resonance imaging, COVID-19 = coronavirus disease 2019.
The demographic information and clinical manifestations of the patients are summarized in Table 1. The patients in the COVID-19 VAM group were significantly younger than those in the other-myocarditis group (31.8 ± 11.4 vs. 45.2 ± 19.4 years, P = 0.010). Other findings including demographics, symptoms at presentation, comorbidities, and laboratory findings were not significantly different between the groups.
Table 1
Demographics and clinical manifestations of patients with myocarditis
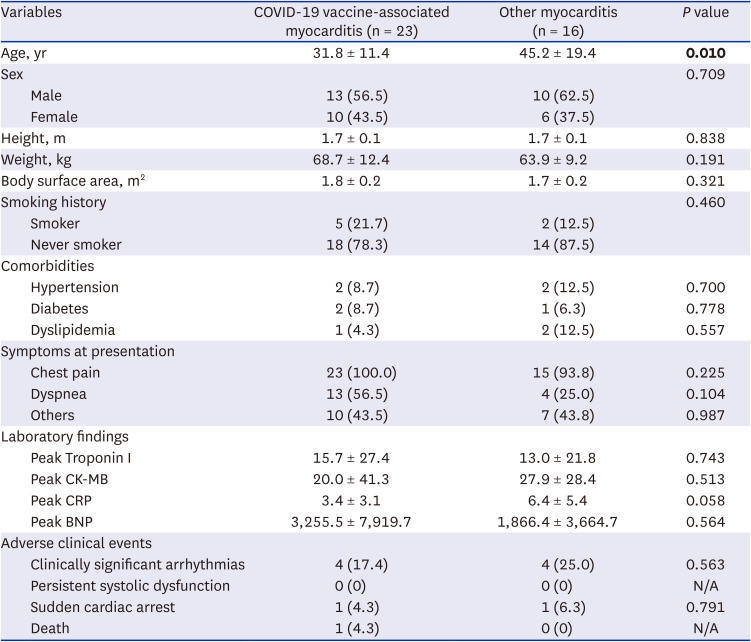
The values in parentheses are percentages. The data are presented as the means ± standard deviations, where applicable. The significant P value is shown in bold.
COVID-19 = coronavirus disease 2019, CK-MB = creatine kinase-myocardial band, CRP = C-reactive protein, BNP = brain natriuretic peptide, N/A = not available.
ACEs were observed in 6 patients from the COVID-19 VAM group (4 clinically significant arrhythmias, 1 sudden cardiac arrest, and 1 death) and 5 patients from the other-myocarditis group (4 clinically significant arrhythmias and 1 sudden cardiac arrest). All patients who had showed systolic dysfunction at the time of diagnosis of myocarditis recovered 6 months after the onset of myocarditis. The incidence of ACEs did not differ significantly between the two groups.
Results of the CMR imaging of the patients
The CMR imaging characteristics of the two groups are summarized in Table 2 and the representative cases of COVID-19 VAM and other types of myocarditis are shown in Figs. 2 and 3. The period from the date of symptom onset to CMR imaging did not differ significantly between the COVID-19 VAM and other-myocarditis groups (6.1 ± 4.8 days vs. 4.7 ± 2.9 days, P = 0.299).
Table 2
MRI characteristics of the patients with myocarditis
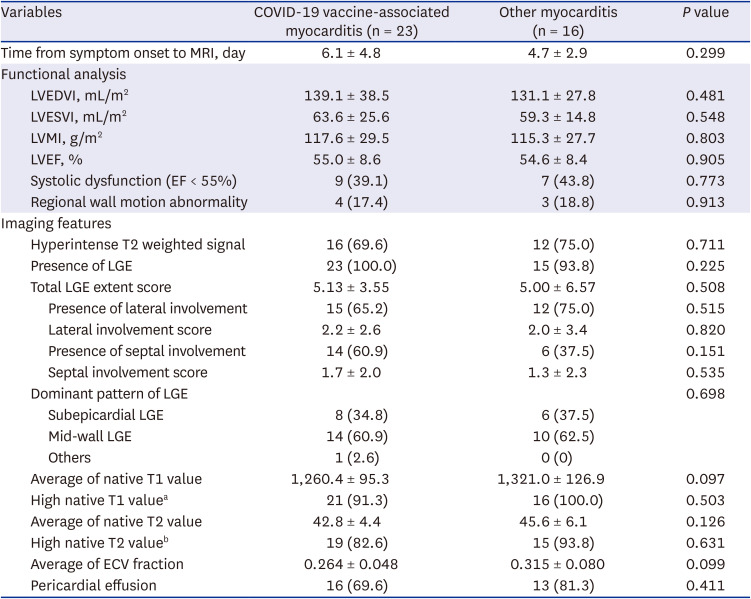
The values in parentheses are percentages. The data are presented as the means ± standard deviations, where applicable.
MRI = magnetic resonance imaging, COVID-19 = coronavirus disease 2019, LVEDVI = left ventricular end-diastolic volume index, LVESVI = left ventricular end-systolic volume index, LVMI = left ventricular mass index, LVEF = left ventricular ejection fraction, EF = ejection fraction, LGE = late gadolinium enhancement, ECV = extracellular volume.
aHigh native T1 value corresponds to when the native T1 value is higher than 2 standard deviations above the mean of sequence-specific local reference values (> 1,270 ms at 3 T).
bHigh native T2 value corresponds to when the native T2 value is higher than 2 standard deviations above the mean of sequence-specific local reference values (> 46 ms at 3 T).
Fig. 2
COVID-19 vaccine-associated myocarditis in an 18-year-old man who presented with chest pain 3 days after COVID-19 vaccination (Pfizer-BioNTech). Cardiac magnetic resonance imaging performed 6 days after symptom onset shows mid-wall to subepicardial late gadolinium enhancement in the basal to the mid lateral wall of the left ventricle (A, arrows), corresponding hyperintense lesion in T2-weighted imaging (B, arrows), high regional native T1 value (C, 1,317 msec, maximum region of interest, arrows), and high regional native T2 value (D, 50 msec, maximum region of interest, arrows) in the short-axis images, suggesting acute myopericarditis (institutional reference values: native T1 at 1,185.4 ± 25.5 ms, native T2 at 35.6 ± 5.4 ms, respectively).
COVID-19 = coronavirus disease 2019.
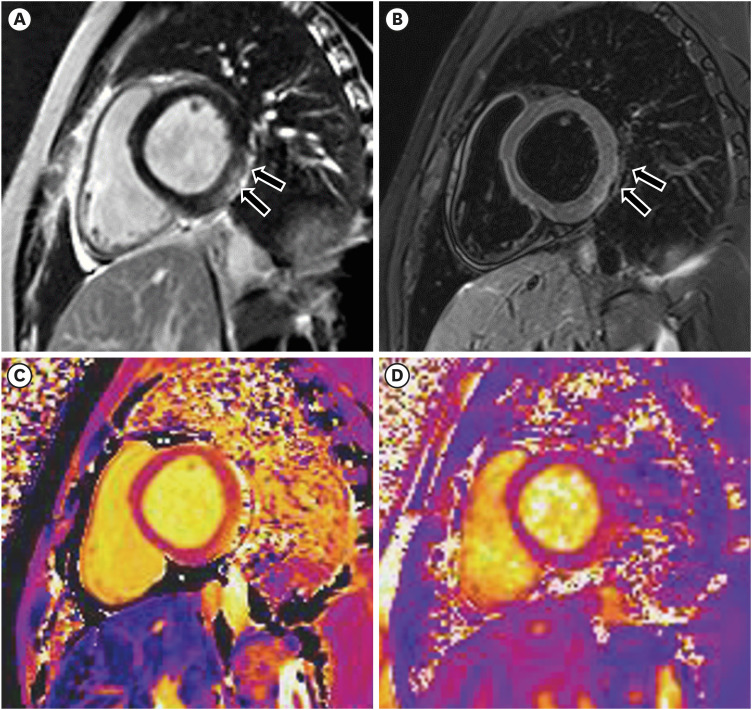
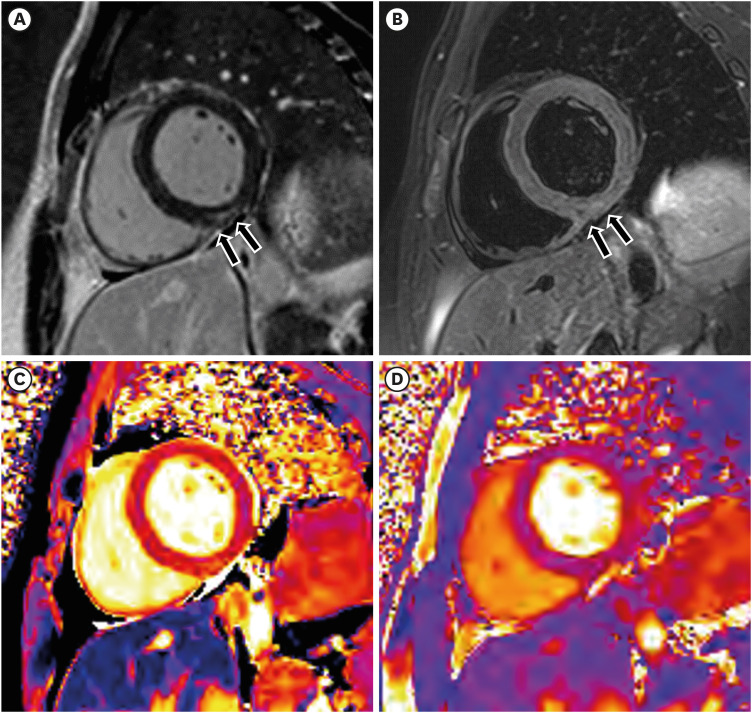
Fig. 3
Acute myocarditis without coronavirus disease 2019 vaccination history in a 26-year-old man who presented with anterior chest pain 2 days ago. The cardiac magnetic resonance imaging shows subepicardial late gadolinium enhancement in the mid inferior wall of the left ventricle (A, arrows), corresponding hyperintense lesion in the T2-weighted imaging (B, arrows), high regional native T1 value (C, 1,291 msec, maximum region of interest, arrows), and high regional native T2 value (D, 47 msec, maximum region of interest, arrows) in the short-axis images, suggesting acute myocarditis (institutional reference values: native T1 at 1,185.4 ± 25.5 ms, native T2 at 35.6 ± 5.4 ms, respectively).
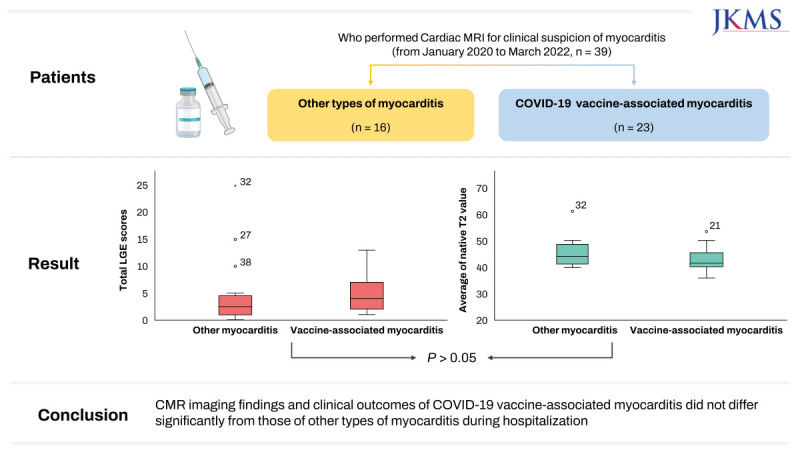
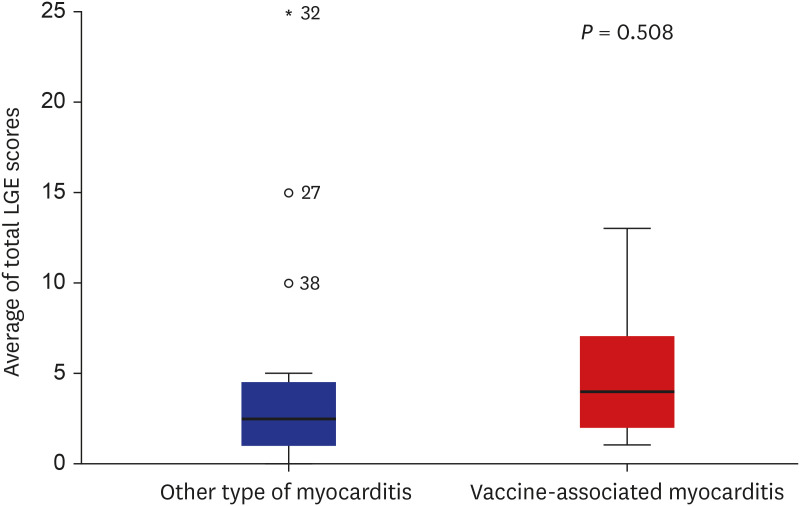
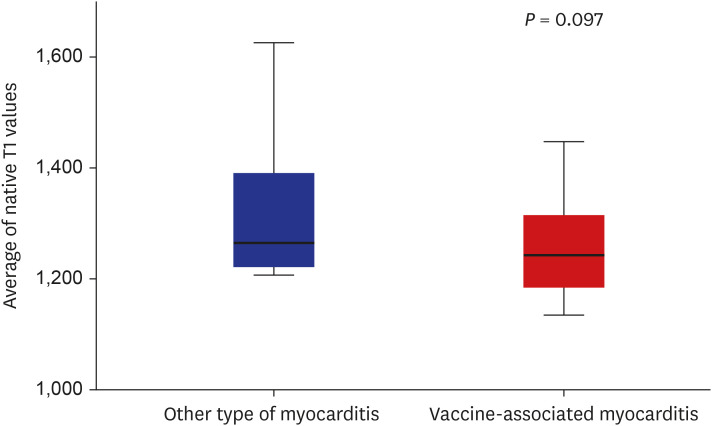
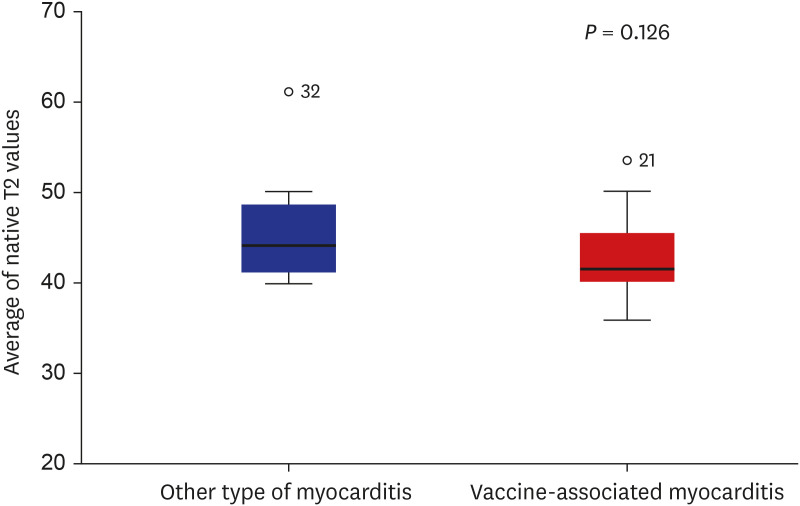
In the CMR functional analysis, there were no significant differences observed between the two groups upon comparison. In the imaging analysis, there was no significant difference observed upon the comparison of the total LGE scores between the two groups (Fig. 4). However, both groups showed more lateral involvement of LGE than septal involvement; the dominant pattern of LGE in both groups was mid-wall involvement. The average native T1 and T2 values tended to be lower in the COVID-19 VAM group than in the other-myocarditis group, but without statistical significance (Table 2, Figs. 5 and 6). The presence of high native T1 or T2 values was not significantly different between the two groups (Table 2). Upon the comparison of each segment of the native T1 and T2 values, although the other-myocarditis group tended to show higher native T1 and T2 values than the COVID-19 VAM group, there were no significant differences observed for any of the segments. The average of ECV fraction and incidence of pericardial effusion between the two groups were also not significantly different (Table 2).
Fig. 4
Boxplot: total LGE scores of coronavirus disease 2019 vaccine-associated myocarditis and other types of myocarditis.
LGE = late gadolinium enhancement.
DISCUSSION
According to recent studies in the US, the incidence of acute myocarditis associated with COVID-19 vaccination and infection is approximately 450 per million.20 With the increase in COVID-19 vaccination rates and number of studies regarding this aspect, COVID-19 VAM has been identified as a rare but risky complication, especially in young men.21 Consistent with this finding, the present study showed that the subjects in the COVID-19 VAM group were younger than those in the other-myocarditis group. However, there were no other significant differences between the clinical manifestations in COVID-19 VAM and other types of myocarditis.
Previous reports have demonstrated that the risk of cardiac arrhythmia increases after the administration of a second dose of COVID-19 mRNA vaccines.22 However, in the present study, the variation in the incidence of arrhythmia with regard to the vaccination dose could not be evaluated due to the small sample size; however, there was no significant difference between the frequency of arrhythmia in the COVID-19 VAM and other-myocarditis groups. Since CMR imaging was performed only in a limited number of patients (i.e., small sample size), additional studies are needed to evaluate the association between the vaccination and arrhythmia.
Generally, the patterns of myocardial injury, as observed by CMR imaging, in COVID-19 VAM and other types of myocarditis are known to be similar; although COVID-19 VAM tends to show less frequent septal involvement.8 This finding was consistent with the results of the present study, which showed that lateral involvement was more frequent in COVID-19 VAM. Less frequent septal involvement may mean that His bundle abnormalities, such as AV blocks, are less likely to accompany this condition.
Similar to findings from prior reports, the present study showed that there were no significant differences between the incidence of abnormal T2 hyperintensity, semi-quantitative features of LGE, and native T1 and T2 values in the two groups. If there were more T2 hyperintense lesions and lesser LGE involvement in COVID-19 VAM, a favorable prognosis might be expected, because these characteristics are indicative of a reduced degree of myocardial injury and eventually, a better response to treatment.
This study has several limitations. First, the number of patients analyzed was too small to obtain statistically significant results, as it was single-center research, and the incidence of COVID-19 VAM was infrequent. Further multicenter studies with larger sample sizes will be needed in the future to validate our findings. Second, we only included patients who underwent CMR in the study, and there is a selection bias in that patients with clinically severe disease conditions may not have undergone CMR. And we also did not include COVID-19 related myocarditis case. Considering the pandemic situation and institutional guidelines, CMR was not performed on patients infected with COVID-19 at the time. Third, the short clinical follow-up period and the absence of follow-up CMR imaging are limitations in evaluating the prognosis of COVID-19 VAM, as most patients with mild symptoms did not return after symptom recovery. Fourth, since the study was a single-reader analysis, there may be discrepancies in the inter-observer agreement. Therefore, multi-reader studies are needed in the future. Finally, because the analysis was performed only based on the patients’ vaccination history, it is difficult to ascertain whether or not COVID-19 VAM really occurred; however, this is an unavoidable limitation.
In conclusion, in this study, there were no significant differences between the clinical manifestations and CMR imaging characteristics of COVID-19 VAM and other types of myocarditis.
 XML Download