

 PDF
PDF Citation
 Print
Print


INTRODUCTION
Seasonal influenza is an acute respiratory infection that occurs worldwide and is known to infect 10-20% of the world’s population every year, causing severe illness in 3 to 5 million people and resulting in 250,000 to 500,000 deaths. Influenza viruses cause seasonal epidemics due to annual changes in viral antigenicity, influenced by point mutations in the hemagglutinin (HA) and neuraminidase (NA) genes, which are responsible for red blood cell aggregation on the virus surface.1
The Korea Disease Control and Prevention Agency (KDCA) has been monitoring the epidemic trend throughout each year to minimize the spread of influenza in the community, reduce the occurrence of influenza complications and deaths, and issues an influenza epidemic alert during flu season. In Korea, seasonal influenza was designated as a third-tier legal infectious disease in 2000 and is currently monitored through a sentinel surveillance system. The influenza epidemic alerts in Korea are issued using the same influenza epidemic formula as the U.S. Centers for Disease Control and Prevention (CDC) standard. If the influenza-like illness (ILI) rate collected by the sentinel monitoring clinics exceeds the epidemic threshold through clinical monitoring, medical institutions and the public are notified of the flu season.2
The influenza epidemic alert system, which used the influenza epidemic formula, operated consistently every year before the coronavirus disease 2019 (COVID-19) pandemic. However, since the onset of the COVID-19 pandemic, it is estimated that the natural immunity to influenza in the population has declined during the 2020–2021 and 2021–2022 seasons due to the implementation of quarantine policies, such as gathering restrictions and social distancing, as well as non-pharmaceutical interventions like hand washing and mask-wearing.34 Moreover, since the 2022–2023 season, due to the mitigation of quarantine policies and increased social mobility, influenza viruses have been continuously detected unusually from the summer.56
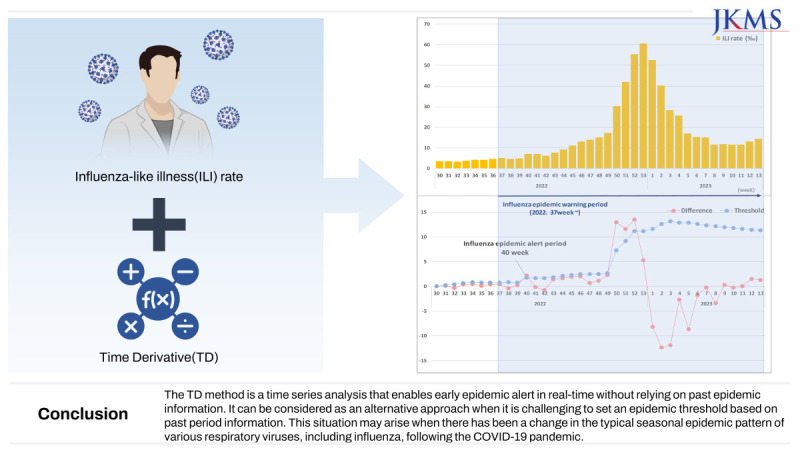
Among these unusual occurrences, the importance of detecting the onset of the flu season earlier than the existing epidemic alert system has become apparent. As a result, we have attempted to propose the Time Derivative (TD) method as a supplementary approach to the existing influenza alert system for early detection of seasonal influenza epidemics.
METHODS
ILI rate and the epidemic threshold
ILI has been used to monitor the scale of influenza epidemics and refers to individuals who have symptoms such as coughing, sore throat, and fever above 38°C.2 The KDCA calculates the ILI rate on a weekly basis to provide fundamental data for the development of national influenza management policies. The sentinel surveillance institutions include around 200 primary clinics, including pediatrics, internal medicine, and family medicine. The monitoring period will be based on seasonal intervals, covering a total of 52 or 53 weeks from the 36th week of the current year to the 35th week of the next year. The sentinel surveillance institutions report the number of reported cases of ILI and the total number of patients in the following age group: 0 year old, 1–6 years old, 7–12 years old, 13–18 years old, 19–49 years old, 50–64 years old, and 65 years old and above.7 They submit these reports once a week to the KDCA’s web reporting system. (http://is.kdca.go.kr) Based on the reported data, the ILI rate is calculated per 1,000 outpatient visits, and no personal information is collected during this process.
The formula for calculating the ILI rate is as follows, and this rate is published each week in KDCA’s weekly sentinel surveillance report.8

The national influenza epidemic threshold is established each season using the epidemic formula. The epidemic formula for establishing the national influenza threshold utilizes the formula provided by the U.S. CDC.9
The Epidemic Threshold = (Mean of the ILI Rates during Non-Epidemic Periods over the Previous 3 Years) + (2 × S.D.)
※ Non-epidemic period: A period when the influenza viral detection rate is less than 2% and lasts for more than 2 weeks.
In this study, we evaluated the effectiveness of the TD method as an early alert system by analyzing the ILI rate for each week during previous seasons when the seasonal influenza epidemic occurred from 2013–2014 to 2022–2023. The analyses were performed using Microsoft Excel 2018 (Microsoft Corp., Redmond, WA, USA) and R software ver. 4.2.2 (The R Foundation, Vienna, Austria). To compute a cumulative seasonal standard deviation of ILI, we utilized the cumstats package in R.
The introduction of the TD method
In this study, we utilized the TD method to detect the onset of an influenza epidemic.10 The cumulative sum (CUSUM) and exponentially weighted moving average (EWMA) control charts have been adopted for the early detection of infectious disease epidemics.1112 Both methods require information on past influenza seasons, such as the mean and standard deviation of ILI rate during non-epidemic periods. However, the TD method does not need past epidemic information because it utilizes the change in the slope of the time series. The TD method detects the onset of an epidemic as a sudden change in the slope of the time series of ILI.
In the TD method, the slope of the time series, that is, the TD, is given by:
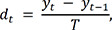
where yt is the ILI at week t, and T denotes the time interval, i.e., a week. Then, we identify the outbreak start week t where the TD dt exceeds a threshold such as:
Here, µt is a cumulative seasonal mean described by:
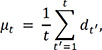
Where t′ = 1 is the first week for which µt is summed over, i.e., the first week of the TD method. In this study, we set t′ = 1 to the 30th week of every year for early detection of influenza epidemic. σt is a cumulative seasonal standard deviation given by
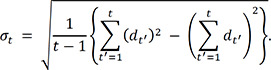
µt and σt smooth out the usual fluctuation of dt around zero before the onset of an influenza epidemic. We determine the value of the adjusted parameter k through validation, as explained in the RESULTS section.
To compare with the TD, we describe methods for detecting the start week of an outbreak using the CUSUM and the EWMA. In the CUSUM, the cumulative sum is given by:
where µ0 is the mean of ILI for non-epidemic periods and C0 = 0. Here, K is the allowable value where , σ is the standard deviation of ILI for non-epidemic periods, and δ is the shift we wish to detect in the σ unit. The onset of an outbreak is detected if Ct exceeds the control limit hσ. The CUSUM has two adjustable parameters, δ and h. In the EWMA, the exponentially weighted moving average is defined as:
where λ(0 < λ ≤ 1) is a weighting factor. If zt exceeds the control limit , then t is considered the start week of an outbreak. The parameters µ_0 and σ are the mean and standard deviation of ILI during non-epidemic periods, as in the CUSUM algorithm. In the EWMA, there are two adjustable parameters: λ and L.
RESULTS
The setting of the first week of the TD method and the adjusted parameter k
The TD method aims to detect the onset of the flu season early. In other words, the threshold varies depending on the first week of the TD method and the adjusted parameter k. The TD method calculates the threshold value by applying the change in ILI rate for each week. This threshold value is then compared with the TD of ILI rate. The first week of the TD method and the adjusted parameter k are crucial because they determine the thresholds, which in turn affect the timing of the alert. Therefore, it is important to carefully set the first week of the TD method and choose an appropriate value for the adjusted parameter k to ensure accurate and timely alerts. The following preconditions were established to determine the first week of the TD method:
• The first week of the TD method should be chosen in a manner that is unaffected by the influence of the previous seasonal trend.
• As early detection before the first week of influenza season is necessary, the first week of the TD method should be applied before the 36th week of the year.
Taking into account the preconditions and considering the epidemic period during past seasons, it has been determined that the first week of the TD method is set to be the 30th week. The 30th week corresponds to the last week of July, which coincides with the time of influenza epidemics in southern hemisphere countries. It was chosen to facilitate early detection of the influenza epidemic by initiating the analysis before the start of the influenza season, which typically begins in the 36th week.
The adjusted parameter k is determined based on specific preconditions, similar to the setting of the first week of the TD method.
• As a result of the application of adjusted parameter k, the calculated alert time should either be the same as or earlier than the existing influenza epidemic alert, depending on the purpose of the early alerting.
• As a result of the application of adjusted parameter k, the difference between the calculated early alert time and the actual start time of the influenza epidemic alert remains within the acceptable range even when the season changes.
From the 2013–2014 season to the 2022–2023 season, the TD analysis was applied, starting from the 30th week, excluding the 2020–2021 and 2021–2022 seasons when there were no influenza epidemics. Additionally, the adjusted parameter k changed by 0.1 ranging from 1.0 to 3.0 and applied to the TD method. Afterward, the timing of the early alert for the epidemic was assessed for each parameter, and the results were compared with the actual timing of issuing the epidemic alert for each season. The results are presented in Fig. 1, which includes the timing of the early alert for each parameter and the corresponding comparison with the actual timing of issuing the epidemic alert for each season (Fig. 1).
Fig. 1
The process of setting the adjusted parameter k.
The analysis was conducted excluding the 2020–2021 and 2021–2022 seasons when there were no influenza epidemics.
aResult: The suggested early alert times based on the Time Derivative method (week).
bDiff (Difference): The difference between the actual week of issuance for the seasonal influenza epidemic alert and the suggested early alert time based on the Time Derivative method (week).
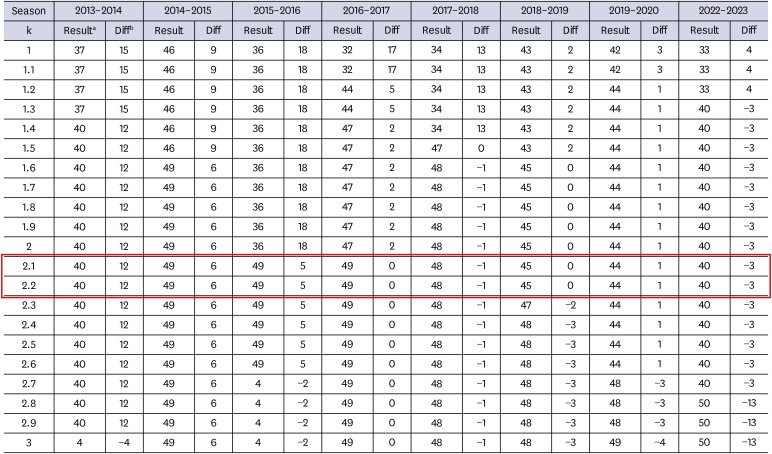
Despite the parameter k changing by increments of 0.1, the calculated early alert time does not exhibit a gradual change. However, significant differences in change were observed during the epidemic period, resulting in varying ranges of changes in the early alert time for each season. After evaluating the various parameter k and considering the preconditions of the adjusted parameter k, it was determined that the range of 2.1 to 2.2 most effectively meets the requirements. Therefore, the adjusted parameter k was ultimately set to 2.1, as it was considered the most reasonable value that aligns with the established preconditions.
Results of applying the TD method from the 2013–2014 season to the 2022–2023 season
The results for each season from 2013–2014 to the present, obtained using the first week of the TD method and adjusted parameters, by applying the TD method to determine the early alert time, are as follows (Figs. 2 and 3). These results are compared with the actual influenza epidemic alert time. Except for the 2020–2021 and 2021–2022 seasons, which did not experience an influenza epidemic, the TD method suggested an early alert time as early as 12 weeks before the actual issuance of the epidemic alert, and up to 3 weeks after the issuance of the epidemic alert. Furthermore, it was observed that the difference between the early alert time suggested by the TD method and the actual issuance of the epidemic alert gradually decrease as the recent season progresses from the previous season.
Fig. 2
Weekly ILI rate from 2013 to 2023, results of TD analysis, and influenza epidemic baseline by seasons.
ILI = influenza-like illness, TD = Time Derivative.
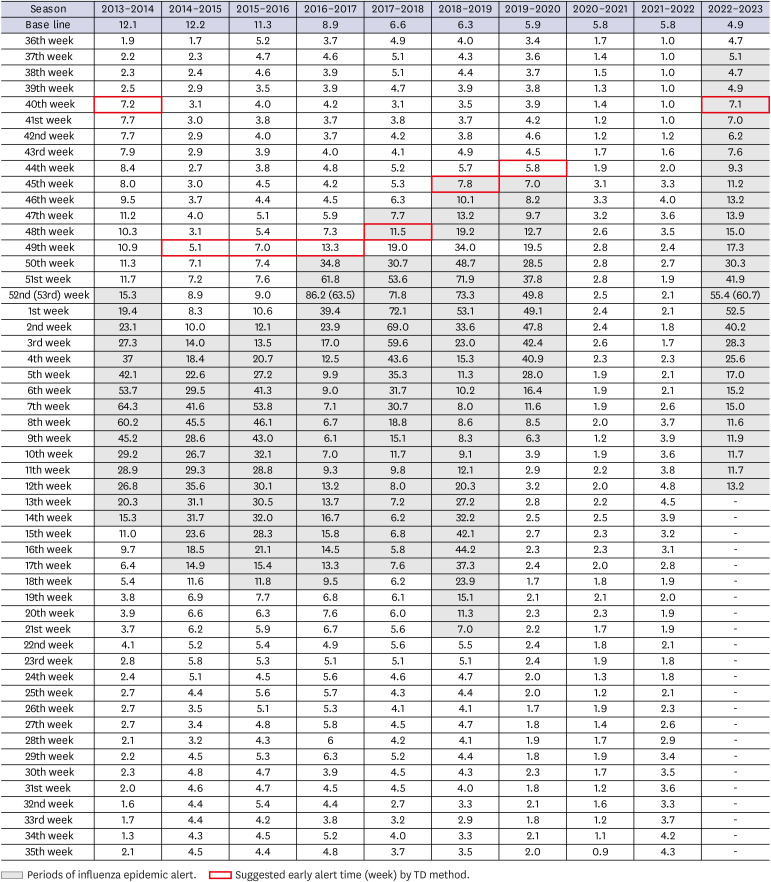
Fig. 3
Results of TD analysis in the 2019–2020 and 2022–2023 seasons. Difference: The ILI rate difference between this week and last week indeed represents the time derivative (). Threshold: This is composed of the cumulative average and cumulative standard deviation of the time derivative in each season. If the time derivative exceeds the threshold at the first moment, and early epidemic alerts is possible (dt > µt + k · σt. [adjusted parameter: k]).
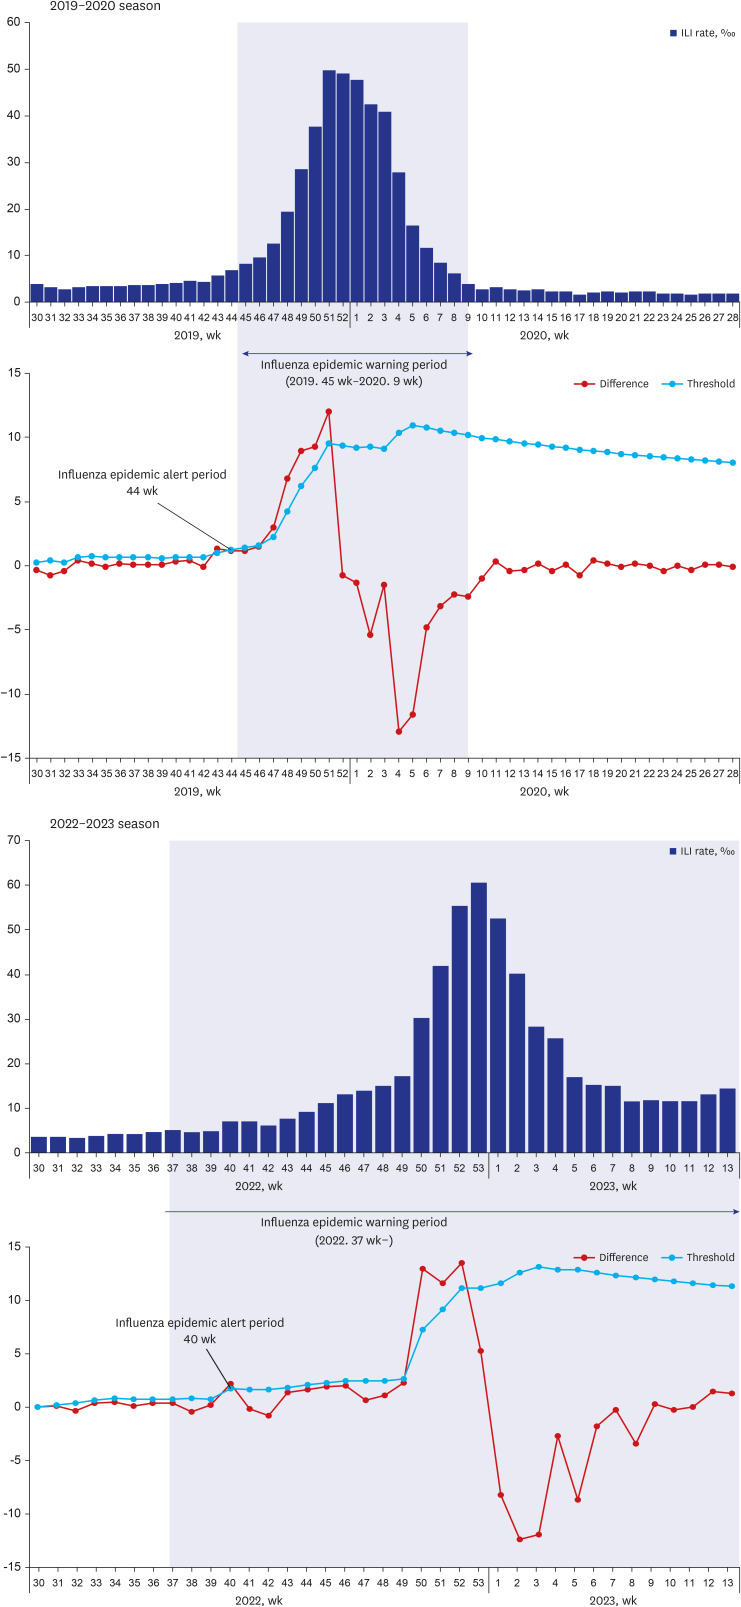
Based on the results, most of the early alert times suggested by the TD method were either earlier than or consistent with the issuance time of the influenza epidemic alert. However, it should be noted that in the 2017–2018 and 2022–2023 seasons, the objective of achieving an early alert was not accomplished.
DISCUSSION
This study applied the TD method to achieve early alertness for seasonal influenza epidemics. It identified the principle of TD analysis, established the first week of the TD method, adjusted parameter k for analysis, and evaluated the usefulness of the TD method as an early alert system. This evaluation involved comparing the actual influenza epidemic alert periods with the periods calculated by the TD method from the 2013–2014 season to the 2022–2023 season.
Except for the two seasons (2020–2021 and 2021–2022), early epidemic influenza alerts could be recognized using TD analytics in the past seasons, except for the 2017–2018 and 2022–2023 seasons. During the period of 2013 to 2015, the threshold for influenza epidemics was consistently above 10 when the epidemic alert time occurred either at the end of the year or at the beginning of the following year. But since 2016, the epidemic threshold has decreased year to year less than 10. Consequently, it can be observed that the time of issuing the epidemic alert has gradually moved closer to the autumn season. Furthermore, it is evident that the early alert time suggested by the TD method and the actual issued time of the epidemic alert have also been gradually approaching each other. However, in the 2017–2018 and 2022–2023 seasons, the alert time suggested by the TD method was observed to occur after the issuance of the epidemic alert. Consequently, the intended purpose of early alertness was not achieved. There are several considerations pertaining to this outcome.
(1) In the case of the 2022–2023 season, there was a non-influenza epidemic due to the COVID-19 pandemic over the past three years. As a result, the threshold calculation for this season was based on the data from the 2021–2022 season, 2019–2020 season, and 2018–2019 season. The 2020–2021 season was excluded from the threshold calculation due to a 0% influenza viral detection rate during that period. The purpose of setting it this way was to preemptively respond to the possibility of concurrent influenza and COVID-19 epidemic by applying sensitive standard. If calculated based on the data from the 2021–2022 season, 2020–2021 season, and 2019–2020 season, using the existing influenza epidemic threshold formula, the epidemic threshold is 5.8. The epidemic alert time is the 40th week which coincides with the early alert time suggested by TD method.
(2) In the case of the 2017–2018 season, unlike other past seasons, there was notable difference in that the ILI rate increased relatively smoothly before the issuance of the epidemic alert. In the other past seasons, it was observed that there was a rapid increase in the ILI rate before the issuance of the epidemic alert. For the TD method to identify an epidemic, a relatively rapid increase compared to previous periods is required. However, during the 2017–2018 season, there was no such rapid increase observed until the epidemic alert was issued. Usually, when the epidemic alert is issued, the ILI rate is observed to increase rapidly until it reaches its peak. However, in the 2017–2018 season, the TD method identified the epidemic alert time when the ILI rate started to increase rapidly after the existing epidemic alert had already been issued.
Based on the results of this study, we assessed the usefulness of the TD method for early influenza epidemic alert. By examining the ILI rate, we observed that the weekly difference in ILI rate remains below 10 during the non-epidemic period and before the issuance of the epidemic alert, indicating relatively low variation. Therefore, the application of the TD method to identify early epidemic alert using the ILI rate is somewhat limited due to the rapid changes in time differences that occur using the characteristics of the time interval. However, excluding the seasons without influenza epidemics in the past 10 years and applying the TD method, it was possible to achieve the goal of early influenza epidemic alert in all seasons except one season.
As early influenza epidemic alert methods, the cumulative sum (CUSUM) and exponentially weighed moving average (EWMA), which are well-known worldwide, have the advantage of detecting small changes during the analysis period. However, a limitation is that historical information is required for the analysis.13
On the other hand, the TD method has the advantage of being a real-time series analysis that enables early epidemic alerts even without relying on past epidemic information. However, there are limitations related to the setting of the start week and the adjusted parameter k, which can affect the threshold and make the interpretation of results difficult.
However, despite that, the TD method has a competitive advantage in early influenza epidemic alerts compared to the existing known methods. According to previous study based on National Health Insurance Service (NHIS) influenza claim data from 2009 to 2017, the TD method showed higher sensitivity than CUSUM and EWMA, in evaluating validity through false positive rate (FPR) and true positive rate (TPR) calculations for early epidemic detection (TD: [FPR]0.004/[TPR]0.879, CUSUM: [FPR]0.046/[TPR]0.596, EWMA: [FPR]0.046/[TPR]0.778).10
When all these factors are considered together, the TD method can be considered as an alternative approach when setting an epidemic alert threshold becomes challenging based on information from past epidemic periods, especially considering the changing patterns caused by the COVID-19 pandemic, which have affected the typical seasonal epidemic patterns of various respiratory viruses, including influenza. Also, it can be meaningful in that TD method has introduced the concept, necessity, and methodology of early influenza alert that have not been previously implemented in Korea.
It is important to have early recognition of the influenza epidemic through various methods, such as the TD method, for effective public health management.14 In the near future, it is also necessary to consider applying the TD method using the ILI rate by age. In addition, if the TD method can be applied using data sources such as big data, besides the ILI rate, which has a relatively small variation due to the characteristics of the data source, it is possible to generate more consistent results. However, in this case, real-time access to the corresponding big data is necessary.
This study sets parameters from the perspective of the KDCA, which operates the influenza monitoring system. However, it is important to note that these parameters may not represent the most academically appropriate method, and different results may arise based on the parameter settings. Therefore, caution should be exercised when interpreting the findings.
 XML Download