

 PDF
PDF Citation
 Print
Print


INTRODUCTION
Spirometric assessment is crucial for diagnosing and assessing the severity of airflow obstruction in the patients with chronic obstructive pulmonary disease (COPD).1 To interpret spirometry results accurately, a reference equation is necessary, as lung function can vary based on factors such as age, sex, height, thoracic wall size, and ethnicity. Recent 2022 European Respiratory Society (ERS)/American Thoracic Society (ATS) statement recommends a composite Global Lung Initiative (GLI)-2012 reference equation regardless of race/ethnicity.2 In the US population, GLI-2012 reference equation was not inferior in predicting lung function compared to National Health and Nutrition Examination Survey III reference equation.3 In European population, GLI-2012 reference equation was better suited than ECSC reference equation.4 In South Korea, GLI-2012 reference equation showed a comparable performance compared with race-specific reference equations in general population.5
The difference in lung function according to race or ethnicity is not due to biologic difference but may reflect socioeconomic status and represent health disparities.6 During recent decades, anthropometric and socioeconomic status has been dramatically changed in South Korea along with high level of economic growth.789 Choi's reference equation, which was developed based on a database of the Korean population in 2005, has recently been reported to overestimate forced expiratory volume in one second (FEV1) and forced vital capacity (FVC).1011 Recently, a new spirometric reference equation was developed based on the current database of the Korean National Health and National Examination Survey (KNHANES)-VI. The KNHANES-VI reference equation showed a higher accuracy for the predictive values of FEV1 compared with Choi’s reference equation.5 However, it remains uncertain which reference equation for lung function is more appropriate in identifying airflow limitation in Korean COPD patients. In addition, we have insufficient evidence on the correlationship between each reference equation and patient reported outcomes (PROs) in COPD patients.
Our study aims to examine the lung function patterns according to different reference equations and to find out their correlations with PROs in COPD patients.
METHODS
We followed the statement of Strengthening the Reporting of Observational Studies in Epidemiology.12
Study design and eligibility criteria
This cross-sectional study analyzed the COPD patients who were registered in the Korea COPD Subgroup Study (KOCOSS) cohort from January 2012 to December 2019. The KOCOSS cohort (NCT02800499) is a prospective study including adults ≥ 40 years old with post-bronchodilator FEV1/FVC ratio < 0.7 at 54 medical centers in South Korea. The detailed information on the KOCOSS cohort was previously reported.13 The eligibility criteria were the patients who 1) underwent anthropometric assessments including age, sex, weight, and height, and 2) performed spirometric evaluation at the baseline visit.
Variables
All baseline information was collected upon patients' registration in the KOCOSS cohort. Sociodemographic information included age, sex, body mass index, area of residence, years of education, smoking status, Charlson comorbidity index, and history of previous lung diseases such as asthma and tuberculosis. We checked symptoms and quality of life including the COPD assessment test (CAT) score, St. George’s Respiratory Questionnaire for COPD patients (SGRQ-C) score, and the 6-minute walking distance (6MWD). We identified previous history of total and severe exacerbations.
Baseline spirometric examination was performed including post-bronchodilator FEV1, FVC, and FEV1/FVC. The percentages of predictive FEV1 and FVC were estimated according to three different reference equations: Choi’s, KNHANES-VI, and GLI-2012 for northeast Asian. The severity of airflow limitation was classified as mild, moderate, severe, and very severe based on Global Initiative for Chronic Obstructive Lung Disease (GOLD) severity and Z-score.14 Z-score of −1.65 was defined as lower limit of normal (LLN).
In the patients who were followed up for 3 years, CAT score, SGRQ-C score, and FEV1 were annually recorded. We estimated an annual change of CAT score and SGRQ-C score and an annualized percentage change (mL/yr and %/yr) from the baseline FEV1 in each individual.15 In addition, we monitored acute exacerbations and mortality for 3 years.
Outcomes
Our primary outcome was the assessment of the percentage of predicted value of FEV1 and the severity of airflow limitation, which was estimated using three reference equations. As secondary outcome, we evaluated the association between FEV1 and the PROs including CAT score, SGRQ-C score, and 6MWD.
Statistical analyses
We performed Student’s t-test or the Wilcoxon rank-sum test to evaluate continuous variables. Linear regression analyses were conducted to find the association between continuous variables. Agreement rate, Cohen’s kappa, and quadratic weighted kappa were evaluated between the different reference equations for FEV1. Given that the severity group is an ordinal variable, we prioritized quadratic weighted kappa over agreement rate or Cohen’s kappa. For interpretation, we followed the criteria described in a prior paper.16 Adding the Z-score evaluation to the predicted percentage of FEV1 can provide objective insights into assessing an individual's relative lung function compared to the reference population, while considering age and sex.17 For calculation of Z-score or LLN of FEV1, we used reference data for Choi’s and KNHANES-VI reference equations and R package “rspiro” for GLI-2012 reference equation. P < 0.050 was considered as statistical significance. All statistical analyses were performed using R statistical software, version 4.1.0 (R Core Team [2020], Vienna, Austria).
Ethics statement
The study protocol was approved by the Institutional Review Board (IRB) at each hospital (Seoul Metropolitan Government-Seoul National University Boramae Medical Center IRB No. 06-2012-36). All participants submitted their written informed consent at study enrolment. Our study was performed in accordance with the principles of the Declaration of Helsinki.
RESULTS
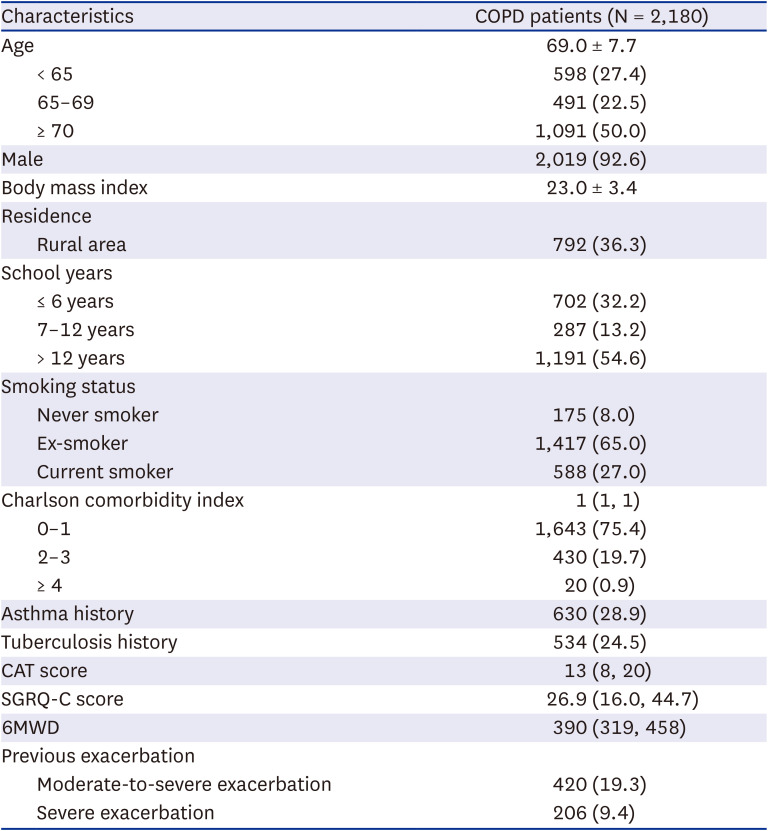
Baseline characteristics of the eligible 2,180 patients with COPD were described in Table 1. Their mean age was 69.0 and 92.6% were male patients and 92% were ever-smokers. In respiratory comorbidities, 28.9% had asthma history and 24.5% had tuberculosis history. Their median CAT score was 13 and median SGRQ-C score was 26.9. Moderate-to-severe exacerbation was found in 19.3%.
Table 1
Baseline characteristics of the included COPD patients
Spirometric profiles
Spirometric profiles were summarized according to the different reference equations in Table 2. Mean post-bronchodilator FEV1 was 1.69 L. Mean percentage of predicted value of FEV1 was variable according to the different reference equations: 58.5% in Choi’s, 56.2% in KNHANES-VI, and 79.0% in GLI-2012 reference equations. The proportions of predictive value of FEV1 < 80% were higher in Choi’s and KNHANES-VI compared with GLI-2012 reference equations. A Z-score of FEV1 < LLN was found in 82.1% analyzed by Choi’s, 94.4% analyzed by KNHANES-VI and 92.3% analyzed by GLI-2012 reference equations. Based on Z-score of FEV1, severe airflow limitation was more found in Choi’s while moderate airflow limitation was more found in KNHANES-VI and GLI-2012 reference equations.
Table 2
Spirometric profiles according to the different reference equations
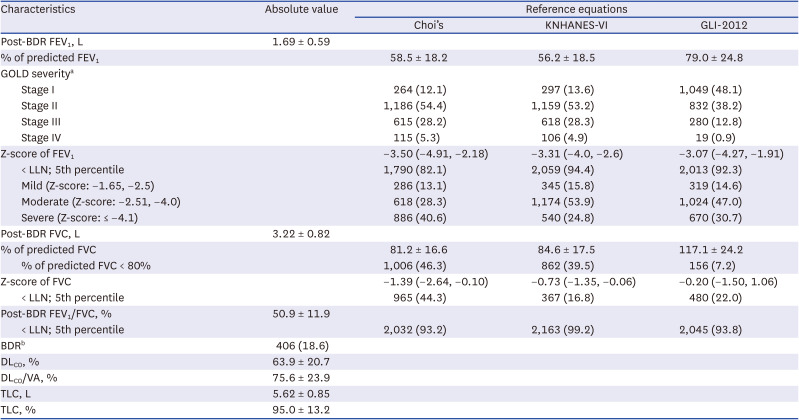
Values are presented as mean ± standard deviation or median (interquartile range) or number (%).
KNHANES = Korean National Health and Nutritional Examination Survey, GLI = Global Lung Function Initiative, BDR = bronchodilator reversibility, FEV1 = forced expiratory volume in one second, GOLD = Global Initiative for Chronic Obstructive Lung Disease, LLN = lower limit of normal, FVC = forced vital capacity, DLCO = diffusing capacity for carbon monoxide, VA = alveolar volume, TLC = total lung capacity.
aStage I = predicted FEV1 ≥ 80%, stage II = predicted FEV1 < 80% & predicted FEV1 ≥ 50%, stage III = predicted FEV1 < 50% & predicted FEV1 ≥ 30%, stage IV = predicted FEV1< 30%.
bFEV1 improvement from the pre-bronchodilator value by 12% and >200 mL.
Mean post-bronchodilator FVC was 3.22L. The proportion of predictive value of FVC < 80% was found in 46.3% analyzed by Choi’s, in 39.5% analyzed by KNHANES-VI, and in 7.2% analyzed by GLI-2012 reference equations. A Z-score of FVC < LLN was found in 44.3% analyzed by Choi’s, in 16.8% analyzed by KNHANES-VI, in 22.0% analyzed by GLI-2012 reference equations.
Mean post-bronchodilator FEV1/FVC was 50.9%. A Z-score of FEV1/FVC < LLN was found in 93.2% analyzed by Choi’s, 99.2% analyzed by KNHANES-VI, and 93.8% analyzed by GLI-2012 reference equations.
Concordance of airflow limitation severity
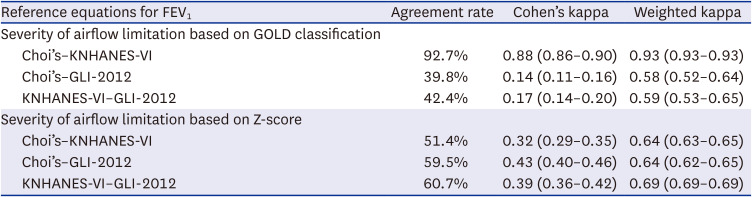
There were strong linear relationships between different reference equations (Supplementary Fig. 1). In the analysis for the severity of airflow limitation based on GOLD classification, strong agreement was found between Choi’s and KNHANES-VI reference equations (agreement rate = 92.7%, Cohen’s kappa = 0.88, weighted kappa = 0.93), while weak agreement was found between GLI-2012 and Choi’s or GLI-2012 and KNHANES-VI reference equations (Table 3, Supplementary Tables 1 and 2). In analysis for the severity of airflow limitation based on Z-score, moderate agreement was found among the three reference equations.
Table 3
Concordance of airflow limitation severity among different reference equations of FEV1
PROs and different reference equations
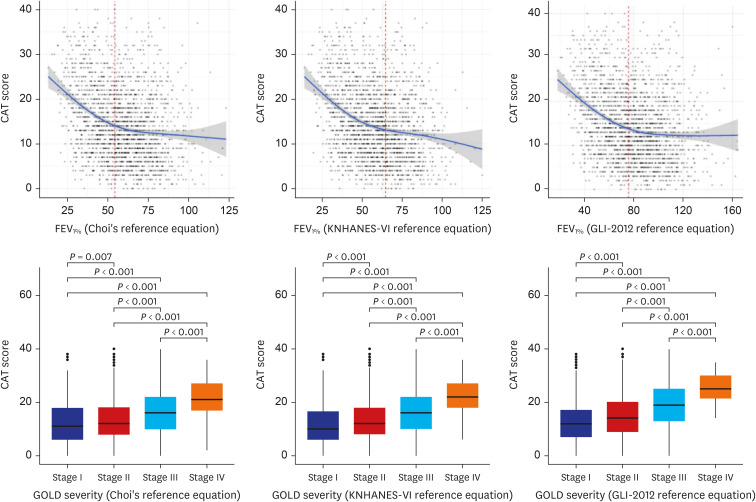
There was a negative linear relationship between CAT score and the percentage of predicted value of FEV1 estimated by the three reference equations (Fig. 1). CAT score was significantly different according to the severity of airflow limitation based on GOLD classification estimated by the three reference equations. There was a negative linear relationship between CAT score and Z-score of FEV1 estimated by the three reference equations (Supplementary Fig. 2). Differences in CAT score according to mild, moderate, and severe airflow limitation based on Z-score of FEV1 were well discriminated in KNAHNES VI reference equation.
Fig. 1
Association between CAT score and different reference equations of FEV1. The vertical dotted line indicates the optimal cut-off value of FEV1% to predict CAT ≥ 10. R2 was 0.078 (P < 0.001) between CAT score and FEV1% (Choi’s reference equation), and 0.084 (P < 0.001) between CAT score and FEV1% (KNHANES-VI reference equation), and 0.073 (P < 0.001) between CAT score and FEV1% (GLI-2012 reference equation).
CAT = COPD assessment test, FEV1 = forced expiratory volume in one second, GOLD = Global Initiative for Chronic Obstructive Lung Disease, KNHANES = Korean National Health and Nutritional Examination Survey, GLI = Global Lung Function Initiative.
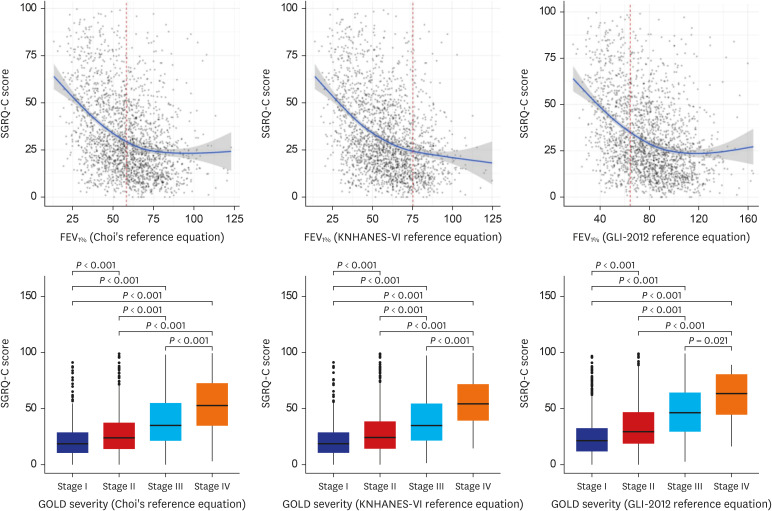
There was a negative linear relationship between SGRQ-C score and the percentage of predicted value of FEV1 estimated by the three reference equations (Fig. 2). SGRQ-C score was significantly different according to the severity of airflow limitation based on GOLD classification estimated by the three reference equations. There was a negative linear relationship between SGRQ-C score and Z-score of FEV1 estimated by different reference equations (Supplementary Fig. 3). Differences in SGRQ-C scores according to the severity of airflow limitation based on Z-score of FEV1 were well discriminated in Choi’s reference equation.
Fig. 2
Association between SGRQ-C score and different reference equations of FEV1. The vertical dotted line indicates the optimal cut-off value of FEV1% to predict SGRQ-C score ≥20. R2 was 0.132 (P < 0.001) between SGRQ-C score and FEV1% (Choi’s reference equation), and 0.145 (P < 0.001) between SGRQ-C score and FEV1% (KNHANES-VI reference equation), and 0.128 (P < 0.001) between SGRQ-C score and FEV1% (GLI-2012 reference equation).
SGRQ-C = St. George’s Respiratory Questionnaire for COPD patients, FEV1 = forced expiratory volume in one second, GOLD = Global Initiative for Chronic Obstructive Lung Disease, KNHANES = Korean National Health and Nutritional Examination Survey, GLI = Global Lung Function Initiative.
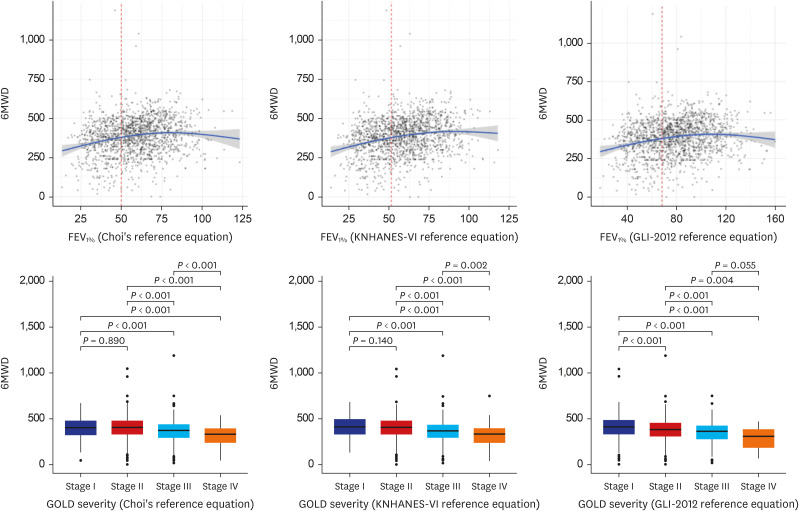
There was a positive linear relationship between 6MWD and the percentage of predicted value of FEV1 estimated by the three reference equations (Fig. 3). 6MWD was significantly different between GOLD stage I and II only when estimated by GLI-2012 equation while between GOLD stage III and IV when estimated by Choi’s and KNAHNES VI reference equations. There was a positive linear relationship between 6MWD and Z-score of FEV1 estimated by different reference equations (Supplementary Fig. 4). Differences in 6MWD according to mild, moderate, and severe airflow limitation based on Z-score of FEV1 were well discriminated in KNAHNES VI reference equation.
Fig. 3
Association between 6MWD and different reference equations of FEV1. The vertical dotted line indicates the optimal cut-off value of FEV1% to predict 6MWD ≥ 400. R2 was 0.033 (P < 0.001) between 6MWD and FEV1% (Choi’s reference equation), and 0.035 (P < 0.001) between 6MWD and FEV1% (KNHANES-VI reference equation), and 0.050 (P < 0.001) between 6MWD and FEV1% (GLI-2012 reference equation).
6MWD = 6-minute walking distance, FEV1 = forced expiratory volume in one second, GOLD = Global Initiative for Chronic Obstructive Lung Disease, KNHANES = Korean National Health and Nutritional Examination Survey, GLI = Global Lung Function Initiative.
DISCUSSION
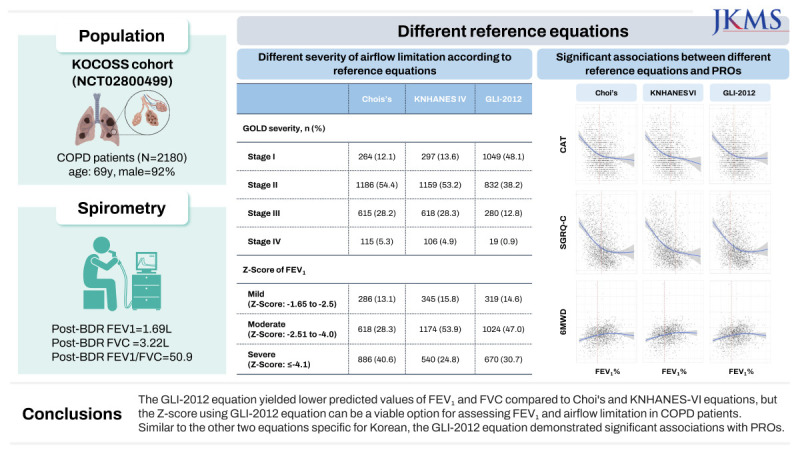
Our study compared the three reference equations (Choi’s, KNHANES-VI, and GLI-2012) in COPD patients. The GLI-2012 equation yielded lower predicted values of FEV1 and FVC compared to Choi's and KNHANES-VI equations. It also resulted in a lower proportion of patients being classified as FEV1 < 80% or FVC < 80% compared to the other equations. However, the Z-scores of FEV1 and FVC were similar between the KNHANES-VI and GLI-2012 equations. The GLI-2012 equation exhibited significant associations between FEV1 (%) or the severity of airflow limitation and patient-reported outcomes (CAT score, SGRQ-C score, and 6MWD). These findings suggest that the Z-score using GLI-2012 equation can be a viable option for assessing lung function in COPD patients in South Korea.
In spirometric interpretation, fixed cut-offs often overlook a significant limitation, namely that the normal range can vary depending on age, gender, and population characteristics.1819 The GOLD report has conventionally determined airflow limitation as the percentage of predicted value of FEV1 <80% and airway obstruction as fixed ratio of FEV1/FVC < 0.7.14 This approach has been favored for its simplicity in calculation and ease of data collection and interpretation. However, the cut-off based on the percentage of predicted value of FEV1 or the ratio of FEV1/FVC is derived from the average values of a general population and does not consider that the normal range can vary with age, sex, and other demographic characteristics. A previous study revealed that in older individuals with smaller body sizes, the percentage of predicted FEV1 can be overestimated even when domestic reference equation was used.11 Additionally, it should be noted that the percentage of predicted value of FEV1 and FEV1/FVC ratio naturally decreases by 1.24% point and 0.32% point, respectively, with age in the general population.2021 This suggests that if airway obstruction or airflow limitation is determined based on a conventional fixed value, it can be underestimated in younger individuals and overestimated in older individuals.
The preference for Z-scores or LLN arises from their distinctive capacity to provide a more precise determination of whether an individual's lung function is within the normal range, in comparison to the results of healthy individuals.2 The Z-scores or the LLN enable the estimation of the probability that an individual's lung function falls outside the normal range, taking into account their characteristics such as age, gender, height, and ethnicity.2 In spirometric assessments, the 5th percentile of Z-scores is often used as the LLN cut-off, indicating a 5% probability that an individual's lung function falls below the normal range. Our study observed a significant disparity between GLI-2012 and Choi's and KNHANES-VI, when we defined airflow limitation or airway obstruction using fixed cut-off values. However, this discrepancy was substantially reduced when the 5th percentile of Z-scores was set for the LLN. This finding is aligned with a previous study that reported a high agreement in airflow limitation severity based on Z-scores while low agreement based on the percentage of predicted value of FEV1.22
Currently, GLI reference equation has been recommended for spirometric evaluation regardless of geographic or ethnic background. It seems a meaningful step to evaluate the lung function of the world's population with a universal reference equation. Through unified reference equation, we can generalize the results from clinical research in different countries and present comprehensive practical guidance. However, there are caveats to the application of the GLI-2012 reference equation to the Korean population. In our study, we found that the Z-scores of the GLI-2012 reference equation closely aligned with those of the KNHANES-VI reference equation, but it tended to underestimate the abnormality of FEV1 and FEV1/FVC. Similar observations were made in another study involving 1,243 Italian children with normal lung function. While the exact reasons for these discrepancies remain unclear, we hypothesize two possible factors.23 Firstly, in the Korean birth cohort, the GLI-2012 reference equation showed a significant discrepancy with real-world values.24 This discrepancy is attributed to the exclusion of individuals under the age of 15 in the northeast Asian population during its development.25 Secondly, the GLI-2012 reference equation for the northeast Asian was developed by amalgamating the populations of North China and South Korea without differentiation.25 Consequently, it is challenging to assert that the GLI-2012 reference equation is optimally tailored to Koreans.
In general, predictive value of lung function is expected to be more accurate when using a reference equation developed from a population with similar demographic characteristics.3 A recent study suggested higher accuracy when the information on region was added to the lung function reference equation.26 In fact, our study showed considerable discrepancy in the predictive value of FEV1 or COPD severity between global reference equation (GLI-2012) and region-specific reference equations (Choi’s and KHANES VI). One of the potential reasons for the discrepancy may be attributed to variations in human body proportions based on different ethnicities of GLI-2012 reference equation. A longer upper body segment length seems to be associated with larger thoracic cage size among different ethnicities.27 Given that Asians have a higher ratio of sitting height to standing height compared to Caucasians, thoracic volume may actually be larger in Asians than in Caucasians of the same height.2829 As a result, the GLI-2012 equation might underestimate the predicted values of FEV1 or FVC in Asians compared to their actual values. Another potential reason for the discrepancy is the differences in the methods used to develop the reference equations. The GLI-2012 reference equation was created using the lambda, mu, sigma method with the specific goal of predicting Z-scores, whereas Choi's and KNHANES-VI reference equations were developed for predicting values of lung function parameters using conventional regression analysis.
Choi's reference equation, developed in 2005, is commonly used in South Korea.10 However, the spirometric reference equation developed from the KNHANES-VI population differed from Choi's reference equation.5 KNHANES-VI reference equation added more weights on age compared to Choi’s reference equation. The predictive value of lung function using the KNHANES-VI reference equation closely matched the actual lung function, whereas Choi's reference equation exhibited a significant margin of error.5 This suggests that the reference equation for lung function needs to be updated considering the demographic variations across different time periods. In our study, spirometric airway obstruction, as determined by Z-score (post-bronchodilator reversibility [BDR] FEV1/FVC < LLN) was more sensitively identified using KNHANES-VI reference equation compared to Choi’s reference equation. Therefore, if LLN is used to diagnose COPD, spirometric evaluation using the KNHANES-VI reference equation may lead to the identification of more patients with spirometric airway obstruction. On the other hand, the GLI-2012 reference equation appears to be less sensitive in detecting spirometric airway obstruction (post-BDR FEV1/FVC < LLN) in Koreans. As this finding raises concerns about the underdiagnosis of COPD, additional adjustment may be necessary for the practical application of the GLI-2012 reference equation.
When applying the KNHANES-VI reference equation to COPD patients, it is essential to be aware of several limitations. The KNHANES-VI reference equation was developed based on a sample of 117 individuals, which is relatively small to claim complete representation of the general population in Korea. Also, there is a noticeable disparity in gender and age distribution between the population used to develop the KNHANES VI prediction equation, where a higher proportion of females and a lower proportion of elderly individuals were included, and the demographics commonly observed among COPD patients, who are typically predominantly male and older.
In COPD patients, since FEV1 alone cannot fully represent the functional impairment and respiratory symptoms, the evaluation of PROs is crucial for a comprehensive assessment.3031 FEV1 and PROs were correlated in the patients with COPD. Negative linear relationships have been reported between CAT score and FEV1 (%) (r = −0.34, −0.55).3233 CAT scores were higher in COPD patients with a higher severity of airflow limitation.33 The association between CAT score and FEV1 (%) was more prominent in symptomatic COPD patients or those during acute exacerbation of COPD.3435 Rapid FEV1 decline was associated with severe dyspnea in COPD patients.36 However, when evaluating treatment response, there was no correlation between FEV1 and CAT.37 SGRQ was negatively correlated with Post-bronchodilator FEV1 (%).38 The absolute difference of SGRQ score was about 13 between GOLD 1/2 and 3/4.39 In a meta-analysis, FEV1 (mL) and SGRQ score showed a significant correlationship and their pooled correlation coefficient was −0.63.40 The association between 6MWD and FEV1 has not been clearly identified. In a study, 6MWD was associated with FEV1 (r = 0.260),41 but another study showed no significant relationship between 6MWD and FEV1.42 In our study, CAT score, SGRQ-C score, and 6MWD were correlated with predictive percentage of FEV1 (%) or GOLD severity, regardless of the different reference equations in COPD patients. In the analyses for CAT and SGRQ-C scores, more linear relationship was found with Z-score of FEV1 while more pronounced difference was found according to COPD severity based on the predictive percentage of FEV1 (%).
Our study has several limitations. First, the accuracy, especially the specificity, of airflow limitation severity cannot be confirmed since a healthy population was not used as a control. Second, it remains unclear whether the difference between each reference equation has an impact on clinical practice. The definition of COPD has mainly been based on the FEV1/FVC ratio, and current clinical practice does not differ according to the airflow limitation severity. However, considering that FEV1 (%) is an important indicator for evaluating clinical prognosis, using a more accurate reference equation would be more beneficial in assessing COPD patients.43 Third, we used the GOLD criteria to evaluate airflow limitation severity which was developed only using GLI-2012 reference equation. In GOLD severity, the GLI-2012 reference equation shows a significant difference from Choi's or KNHANES-VI. On the other hand, in the Z-score severity, the difference between the three reference equations was greatly reduced. As recent 2022 ERS/ATS statement suggested, it seems appropriate to use Z-score when globally evaluating lung function with GLI-2012 reference equation. Fourth, it is difficult to generalize that PROs and FEV1 are correlated. In our study, the linear association between PROs and FEV1 (%) seemed clearer until a certain cut-off, and then the association seemed weaker.
In conclusion, our findings highlight the need for careful consideration in selecting an appropriate reference equation for spirometry interpretation in COPD patients. GLI-2012 reference equation may not accurately reflect FEV1 (%) in the Korean population, but the Z-score using GLI-2012 equation can be a viable option for assessing FEV1 and airflow limitation in COPD patients. KNHANES-VI reference equation seemed to be more efficient to detect undiagnosed COPD using the LLN. Similar to the other two equations specific for Korean, the GLI-2012 equation demonstrated significant associations with PROs.
 XML Download