Abstract
Background/Aims
Colorectal cancer is the most common cancer in oncopathology, with an increasing incidence among the elderly during the last decade. Various genetic and environmental factors play important roles in the emergence of colorectal adenocarcinoma. Non-coding RNAs, approximately 20–22 nucleotides, are transcribed irregularly in many cancer cells and play a critical role in many metabolic pathways in clinical cancer cases. DNA methylation is a critical epigenetic alteration that controls gene expression. In the current study, transcriptional silencing and CpG hypermethylation were developed as a therapeutic gene editing strategy for the clinical repression of colorectal adenocarcinoma.
Methods
A human colorectal adenocarcinoma cell line (Caco2) and a normal lung fibroblast cell line (Wi38) were utilized as the paradigms in this research to examine the effect of mir155 molecule transfection and CpGs-island (CGI) methylation. Cell counting was achieved using six-well and 24-well plates before transfection using a hemocytometer. The two cell lines were transfected with the mir155 agomir and antagomir molecules. The transfection efficiency, cell viability, cell IC50, and target gene expression were measured, and CGIs-methylation was achieved by bisulfate conversion.
Results
The outcomes revealed the downregulation of oncogenes (AKT1 and VCAM1 genes as cancer-associated genes) and the upregulation of tumor suppressor genes (TSGs, Tp53 and KEAP1). In addition, CpG-islands methylation showed significant blocking of the oncogene promoter regions, and the switch on of TSG promoter regions was continuous.
Colorectal cancer is one of the most common cancers in oncologic pathology. The cancer is a conspicuous mass of the gastrointestinal tract. It is the second most common cause of death in developed and developing countries, with a significant impact on the elderly.1 In 2015, the Incidence, Epidemiol, and Preliminary Results Program2 revealed approximately 132,700 cases of colorectal cancer in northern America.
Micro RNA comprises approximately 20–22 nucleotides without expression to proteins. They are categorized as oncomir and tumor suppressor miRNA,3 and their function sometimes appears as abundant molecules or a single miRNA effect on the expression of multiple genes.4 They play a crucial role in cancer development by altering the expression of different genes. Mir155 is an oligonucleotide with an agomir and antigomir molecular composition that was assessed for gene silencing in this study by transfection into the cancerous Caco2 cell line.5
An oncogene is a mutant feature of a proto-oncogene (wild type) that promotes tumor growth.6 In this article, the oncogene is represented by AKT1 (Serine–Thrionine–Kinase-1), which is responsible for the AKT-PI3K cell signaling pathway,7 and VCAM-1 (Vascular Adhesion Molecule1), a cell receptor gene responsible for cancer cell dissemination and metastasis.8 VCAM-1 is a 90-kDa glycoprotein containing six or seven immunoglobulin domains9 that might mediate tumor cell adhesion to vascular endothelial cells and promote the metastatic process. VCAM-1-dependent adhesion is responsible for lung metastases.10
Tumor suppressor genes (TSGs) have important roles in regulating cell cycle arrest, apoptosis, DNA repair, senescence, and metabolism.11 The TP53 gene is a better example of such genes.12 The KEAP1 gene (Kelch-Like ECH Associated Protein1) acts as a key sensor of oxidative stress that mediates the ubiquitination and degradation of NFE2L2-NRF2. This gene functions as a transcription factor that regulates the expression of many cytoprotective genes.13
DNA methylation involves the addition of a methyl group to the 5 carbon of cytosine residues in CpG dinucleotides and is a critical epigenetic modification that regulates gene expression.14 CpG dinucleotides are dispersed irregularly in mammalian genomes, frequently found in the gene promoter regions and aggregating primarily in CpG islands.15 Recently, a significant relationship between the role of miRNA and epigenetic modification in the expression of many genes was reported, and many miRNAs regulate the methylation coding sequences of various promoters.16
Little research has been done on gene silencing using miRNA transfection (mir155) and CpGs-island (CGI)-methylation (area of the gene with a high cytosine–guanine content) of the promoter region of target genes in a cell line. This research evaluated the biological activity of an ncRNA molecule in colorectal cancer regression.
The human colorectal adenocarcinoma (CRC) cell line Caco-2 (HTB-37™) and normal lung fibroblast cell line (ATCC® CCL-75) were purchased in January 2022 and tested using the short tandem repeat test to confirm they were free of any genetic variations before starting the study. Both cell lines were grown in DMEM (Sigma–Aldrich, St. Louis, MO, USA) supplemented with 10% fetal calf serum (Sigma–Aldrich), in addition to penicillin, streptomycin, and L-glutamine (Sigma-Aldrich). Before transfection with the agomir and antagomir molecules of mir155 (ABM, Vancouver, BC, Canada), the two cell lines were detached from a T25 flask (Firat, Turkey). The medium was removed from the flask, and the cells were washed with 1X of PBS to remove any remaining medium. The cells were then transferred to six-well and 24-well plates for the expression and XTT assays.
The cells were transferred to six-well and 24-well plates prior to transfection. For counting, the cells were detached from the T25 flask by removing the medium and washing them with 1X PBS to eliminate any remaining medium. Subsequently, 3 mL of trypsin (Sigma–Aldrich) was added to the flask of the cell line and incubated until the cells detached, and 2 mL of DMEM medium was then added to inactivate trypsin. The cells were collected from the flask by centrifugation of the cell suspension at 1,500 rpm for 5 minutes. The supernatant was removed without touching the cell pellet, and 1 mL of fresh medium was added for cell counting. A hemocytometer (Sigma–Aldrich) was used for cell counting. 10 μL of the cell suspension and 10 μL of trypan blue were loaded on the grid-lined part of the hemocytometer. Four of the 16 squares were counted, and the average of four squares was taken. The resulting number was then multiplied by 250,000 to obtain the cell number per milliliter. The six-well plate average was multiplied by 3×10⁵, and the 24-well plate average was multiplied by 5×10⁴. The cells were seeded in each well, and the volume was made up to 500 μL with growth medium.
An XTT (2,3bis 2-methoxy-4-nitro-5-sulfophenyl)-2-tetrazolium- 5-carboxanilide; Biotium, Fremont, CA, USA) assay was performed on 24-well plates using an XTT Cell Viability Kit. The working solution was prepared immediately before use, heated to 37℃, and swirled gently until a clear solution was obtained. For each 24-well plate, 25 μL of activation reagent was mixed with 5 mL of an XTT solution to derive the activated XTT solution. Subsequently, 50 μL of activated XTT solution was added to the wells. The plates were then incubated in a CO2-supplemented incubator (Sanyo, Nakamura-ku, Japan) for four hours. The plates were then shaken gently to distribute the dye in the wells. The absorbance was measured using an ELISA Reader (HEALES MB-530, Shenzhen, China) at 450– 500 nm. The background absorbance was measured at 630– 690. Background absorbance was subtracted from the signal absorbance to obtain the normalized absorbance values.
The NcRNA isolation kits used were RiboEx and Hybrid-R (GeneAll Company, Seoul, Korea). The cDNA synthesis kit was a Hyper Script™ First (Wizbio Company, Seongnam, Korea). The mixture of the cDNA synthesis strands included the following: mir155 template (2 μL), hexamir primer (1 μL), dNTP-mix (1 μL), RNase-free distilled water (10 μL), RTase reaction buffer (2 μL of 10X), and M-DTT (2 μL of 0.1nM concentration). The reverse transcription conditions for cDNA synthesis involved two steps: 55℃ for 60 minutes and 85℃ for five minutes. The complementary DNA strand obtained was frozen at −80℃. The primers used were supplied by (Ella Biotechnology, Am Kugelfang, Germany), as listed in Table 1.
The amplification mixture for the ncRNA expression kit included Real Amp™ SYBR qPCR (Seoul, Korea), master mix (10 μL of 2X), Rox dye (1 μL), forward primer (1 μL of 10 μM), reverse primer (1 μL of 10 μM), cDNA (4 μL), and RNase free dis-tilled water (3 μL). The primers used for ncRNA expression were supplied by (Ella Biotechnology), as listed in Table 1.
The gene expression conditions using Real-Time qPCR (API-7500-Fast) began with initial denaturation at 95℃ for five minutes, 40 denaturing cycles at 95℃ for 15 seconds, and annealing at 60℃ for 60 seconds. In addition, the melting curve was obtained at 65–95℃ for 2–5 seconds.
For mRNA isolation, RiboEx and Hybrid-R were provided by GeneAll. The HyperScript™ First strand synthesis kit was supplied by GeneAll. The amplification components used for mRNA-cDNA synthesis were an mRNA template (2 μL), hexamer primer 1 μL (5 μM) dNTP mix (1 μL), 10X RTase reaction buffer (2 μL) 0.1 M DTT (2 μL), reverse transcriptase (1 μL), RNase inhibitor (1 μL), and RNase free distilled water (10 μL). The complementary DNA synthesis reaction conditions included 55℃ for 60 minutes and 85℃ for five minutes. The obtained cDNA samples were frozen at –80℃.
A Real Amp™ SYBR qPCR master mix was provided by GeneAll. The target primers were designed in this study listed in Table 2 (Oligomer, Alacaatlı, Ankara, Turkey). The amplification mixture included 2X SYBR-Green master mix (10 μL), ROX Dye (1 μL), forward primer (10 μM) 1 μL, reverse primer (10 μM) 1 μL, cDNA template (4 μL), and RNase free distilled water, 3 μL (Table 2).
The DNA was isolated using a Cell SV mini kit (GeneAll). The DNA Methylation-Gold™ Kit was supplied by Zymo Research (Irvine, CA, USA). The following DNA methylation protocol was used: 130 μL of the CT (900 μL water, 300 μL of M-Dilution Buffer, and 50 μL M dissolving buffer to a tube of CT conversion reagent). The conversion reagent was added to a 20 μL DNA sample in a PCR tube that was placed in a thermal cycler that underwent initial denaturation at 98℃ for five minutes, CT reaction at 64℃ for 150 minutes, and holding at 4℃ for 20 minutes. Subsequently, 600 μL of M-Binding Buffer was added to a Zymo-Spin™ IC placed into the collection tube. The sample from step two was added to the Zymo-Spin™ IC and centrifuged at >10,000×g for 30 seconds. The flow-through was discarded, and 100 μL of M-wash buffer was added to the column. The tubes were then centrifuged at >10,000×g for 30 seconds. In the subsequent step, 200 μL of M-desulfonation buffer was added to the column, and the mixture was left to stand at room temperature (20–30℃) for 15–20 minutes. After incubation, the mixture was centrifuged at >10,000×g for 30 seconds. Subsequently, 200 μL of M-wash buffer was added to the column and re-centrifuged at >10,000×g for 30 seconds. In the next step, 200 μL of M-wash buffer was added and centrifuged for an additional 30 seconds. Finally, 10 μL of M-elution buffer was added directly to the column matrix and centrifuged for 30 seconds at >10,000×g to elute the DNA. At this stage, the primers were designed in this study according to the promoter regions of target genes for DNA with bisulfite conversion and provided by Ella Biotechnology, Germany (Table 3).
The master mix was provided by Wiz™. The amplification mixture components used in the conventional and MS-PCR included the following: 2X master mix (10 μL), forward primer (10 μM) 0.5 μL, reverse primer (10 μM) 0.5 μL, DNA template (5 μL), and nuclease-free water (7 μL). The amplification conditions were as follows: initial denaturation at 95℃ for five minutes and 30 denaturing cycles at 95℃ for 30 seconds, annealing at 60℃ for 30 seconds, extension at 72℃ for 30 seconds, and final extension at 72℃ for five minutes.
Gel documentary software (CS analyzer, Tokyo, Japan) was used to analyze the size and density of the methylated and un-methylated amplicons of the target genes. Excel was used to determine the standard deviation for cell viability, the mean and standard error for triplicate gene expression, and analyze gene expression to determine the CT values and fold change.17
Transfection of the Caco2 and Wi38 cell lines with the mir155 agomir molecule revealed different fold changes (Table 4). The increase for Caco2 cells was 1.664289805 for the agomir after transfection with the comprehensive control (before, 1) and 7.87510009 for the antagomir after transfection with the control (before, 1). Hence, the agomir sequence transcription was downregulated, and the transfection of the synthesized agomir sequences led to an increase in the copy number of mir155 (1.664289805), which plays a critical role as a tumor suppressor micro-RNA. By contrast, the antagomir showed significant upregulation of the copy number (7.87510009) after the transfection of Caco2 cells because of the reduction of agomir sequence, while antagomir transfection was downregulated in Wi38 cells due to neutralization of the agomir copy number. Mir155 plays a vital role in suppressing cancer regression, especially in colorectal adenocarcinoma and colon cancer.
After transfection, the XTT results showed different growth values in the cell lines transfected with the mir155 agomir and antagomir molecules, which increased Caco-2 cell and Wi38 cell proliferation (Table 5).
Transfection of the agomir and antagomir sequences of the Mir155 molecule showed the downregulation of AKT1 VCAM1 genes and high expression values related to TP53 and KEAP1 genes, as listed in Table 6.
The mir155 antagomir molecule acted as an onco-suppressor ncRNA. In addition, its antagomir sequence transfection was associated with the downregulation of oncogenes (AKT1, 0.112222136: control, 1) and metastatic mediator genes (VCAM1, 0.075072544: control, 1) and the upregulation of TSGs (Tp53, 13.40249032: control, 1; KEAP1, 20.81323316: control,1). By contrast, the agomir sequence acted as an oncomir due to the upregulation of oncogenes (AKT1, 22.376-72536: control, 1) and metastasis-related genes (VCAM1, 14.21090985: control, 1) and the downregulation of TSGs (Tp53, 0.093035622: control, 1; KEAP1, 0.076358206: control, 1). Hence, the mir155 agomir molecule plays a role in gene silencing by acting as a tumor suppressor sequence, but its gene transcription is downregulated in many cancer cases. In addition, the high transfection value of the antagomir sequence (4.87510009) agrees with its critical role as a tumor suppressor miRNA. This hypothesis is linked to the downregulation of oncogenes and the upregulation of TSGs.
The cell line images revealed significant results for Caco2 cell regression, such as loss or reduction of confluence and rounded floating cells similar to the control (Fig. 1).
An examination of antagomir-mir155-CpGs islands methylation revealed a significant blocking effect of the AKT1 gene promoter region (oncogene). A high density of methylated amplicons was observed at approximately 180–190 bp. The Caco2 and Wi38 cell lines showed an increased hybridization of the methylated primer, indicating the significant blocking role of CG island methylation. By contrast, the methylation of agomir-mir155-CpGs islands had an insignificant blocking effect because of the low density of DNA bands. The band density represents the ability of methylated or unmethylated primers to bind to specific CG dimers or bisulfate-modified sequences of promoters, as shown in Fig. 2.
Antagomir-mir155-CpG island methylation had a significant blocking effect on the KEAP1 gene promoter region (TSG). A high density of methylated amplicons was observed at approximately 180–190 bp. The increased methylated primer hybridization in the Caco2 and Wi38 cell lines indicated an insignificant blocking role of CG island methylation. By contrast, the agomir sequence of mir155-CpG islands methylation showed a decrease in blocking because of the low DNA band density, as shown in Fig. 3.
Antagomir-mir155-CpG island methylation had a significant blocking effect on the TP53 gene promoter region. A low density of methylated amplicons was observed at approximately 180–190 bp. The decreased methylated primer hybridization in the Caco2 and Wi38 cell lines indicates that CG island methylation has a significant unblocking role, whereas agomir methylation had an increased blocking effect because of the high DNA band density, as shown in Fig. 4.
Antagomir-mir155-CpGs island methylation had a significant blocking effect on the TP53 gene promoter region (metastasis-responsible gene). A high density of methylated amplicons was observed at approximately 180–190bp. The increased methylated primer hybridization in the Caco2 and Wi38 cell lines highlights the significant blocking role of CG island methylation. In contrast, un-methylation had a smaller blocking effect because of the high DNA band density, as shown in Fig. 5
On the other hand, bisulfate modification for blocking the gene promoter was detected using gel page digital analysis, showing a decrease in AKT1 oncogene activity. The activity of KEAP1, a TSG and antioxidant stress gene, was decreased because of the increased promoter blocking and TP53 as the most significant tumor suppressor gene. Finally, VCAM1, a metastasis-responsible gene, was deactivated (Fig. 6).
After transfecting Wi38 with the antagomir sequence of mir155, bisulfate methylation of DNA revealed a decrease in AKT1 oncogene activity because of the high promoter blocking, KEAP1 (antioxidant), unaffected TP53 activity, and decreased VCAM1 metastasis-responsible gene activity, as shown in Fig. 7.
The transfection of cancerous cells with the mir 155 antigomir molecule and methylation of the CpGs islands of the oncogene led to switching off of the oncogene (AKT1 and VCAM1) and the upregulation of TSGs (Tp53 and KEAP1).
Over the past decade, ncRNAs have been used widely as a clinical indicator of many cancers. In addition, they have a high therapeutic index in cancer in vivo and ex vivo.18 These molecules act according to the following mechanism. A double- stranded short RNA is incorporated into the pre-RISC (RNA Induced Silencing Complex). The passenger strand is then released either cleavage-dependently (when the guide and passenger strands are matched) or cleavage-independently (when the guide and passenger strands are not matched) to produce the RISC-containing guide strand. The anti-sense or guide strand then takes the RISC to the complementary or almost complementary region of the target mRNA. The siRNA from the cleavage-dependent RISC, which has a perfect match to its target, cleaves the target mRNA using the endonuclease Ago2, whereas Miro-RNA (miRNA), which has a poor match to its target, causes mRNA degradation or sequestration in the processing body (P-body) and translational inhibition.19
Several studies have reported the critical role of gene silencing by miRNA transfection in treating CRC. Mir155 agomir transcription in CRC malignant cells is less downregulated than the normal averages in normal cells, which in turn assists in the development and progression of CRC, particularly in stages II and III.20 In many malignancies, including colon cancer, it affects cell growth and death owing to its role in the up or down-regulation of specific oncogenes, or TSGs.21 Li et al.18, who examined the role of ncRNA, reported that this miRNA promotes cell proliferation in cervical cancer. Zhang et al.22 reported that mir155 plays a significant role in promoting and migrating colorectal cancer cells. Liu et al.23 also observed the direct effect of mir155 after its transfection in the SW-480 cell line, which inhibits colorectal cancer by regulating the Wnt/β-catenin pathway.
The present study revealed a synergistic relationship between transfection and CGI unmethylation after mir155 antagomir molecule transfection. A cell line transfected with the mir155 antagomir molecule showed an increase in ‘switching off’ CGIs in the promoter region of the oncogene. This was a critical indicator for the synergistic effect of transfection of some ncRNA molecules with the hypermethylation of CGIs of the oncogene. The transfected miRNA plays a role in the up or down-regulation of some critical genes in cancer cell proliferation. A comparable result was also observed in another study.23
Recently, it was discovered that some miRNAs behave as epi-miRNAs that play a role in epigenetic regulation. Epi-miRNAs are subclasses of miRNAs that target epigenetic regulators, downregulating the expression of some genes responsible for DNA methyltransferase, proteins that bind to methylated cytosine, and preventing demethylase gene expression. The expression of epigenetic regulators and the up- or down-regulation of epi-miRNAs that target tumor development genes must be controlled. Therefore, remodeling and silencing of this intracellular molecular system in cancer cells represents a therapeutic strategy in cancer therapy.24 In addition, DNA damage, increasing chromatin de-condensation, and chromosomal instability are all related to cancer progression. Long- and short-interspersed nuclear components, as well as classical satellites, are highly methylated. Cells with aberrant histology occur due to aging or cancer and frequently exhibit a reduction in DNA methylation in the target promoter region.25
After transfecting malignant cells with the mir 155 antigomir, the tumor suppressor genes Tp53 and KEAP1 were upregulated. In addition, the oncogenes AKT1 and VCAM1 were switched off, and Caco2 cell proliferation was inhibited. These findings support the use of DNA methylation and RNA silencing in targeted gene therapy for colorectal cancer.
REFERENCES
1. Schreuders EH, Ruco A, Rabeneck L, et al. 2015; Colorectal cancer screening: a global overview of existing programmes. Gut. 64:1637–1649. DOI: 10.1136/gutjnl-2014-309086. PMID: 26041752.
2. Duggan MA, Anderson WF, Altekruse S, Penberthy L, Sherman ME. 2016; The surveillance, epidemiology, and end results (SEER) program and pathology: Toward strengthening the critical relationship. Am J Surg Pathol. 40:e94–e102. DOI: 10.1097/PAS.0000000000000749. PMID: 27740970. PMCID: PMC5106320.
3. Jonas S, Izaurralde E. 2015; Towards a molecular understanding of microRNA-mediated gene silencing. Nat Rev Genet. 16:421–433. DOI: 10.1038/nrg3965. PMID: 26077373.
4. Kim YK, Kim B, Kim VN. 2016; Re-evaluation of the roles of DROSHA, Export in 5, and DICER in microRNA biogenesis. Proc Natl Acad Sci U S A. 113:E1881–E1889. DOI: 10.1073/pnas.1602532113. PMID: 26976605. PMCID: PMC4822641.
5. Chan JJ, Tay Y. 2018; Noncoding RNA: RNA regulatory networks in cancer. Int J Mol Sci. 19:1310. DOI: 10.3390/ijms19051310. PMID: 29702599. PMCID: PMC5983611.
6. Alexandrov LB, Nik-Zainal S, Wedge DC, et al. 2013; Signatures of mutational processes in human cancer. Nature. 500:415–421. DOI: 10.1038/nature12477. PMID: 23945592. PMCID: PMC3776390.
7. Gao X, Wang N, Wu S, Cui H, An X, Yang Y. 2019; Long non‑coding RNA FER1L4 inhibits cell proliferation and metastasis through regulation of the PI3K/AKT signaling pathway in lung cancer cells. Mol Med Rep. 20:182–190. DOI: 10.3892/mmr.2019.10219. PMID: 31115514. PMCID: PMC6579969.
8. Rice GE, Bevilacqua MP. 1989; An inducible endothelial cell surface glycoprotein mediates melanoma adhesion. Science. 246:1303–1306. DOI: 10.1126/science.2588007. PMID: 2588007.
9. Dolgin E. 2017; The most popular genes in the human genome. Nature. 551:427–431. DOI: 10.1038/d41586-017-07291-9. PMID: 29168817.
10. Chen Q, Zhang XH, Massagué J. 2011; Macrophage binding to receptor VCAM-1 transmits survival signals in breast cancer cells that invade the lungs. Cancer Cell. 20:538–549. DOI: 10.1016/j.ccr.2011.08.025. PMID: 22014578. PMCID: PMC3293160.
11. Mello SS, Attardi LD. 2018; Deciphering p53 signaling in tumor suppression. Curr Opin Cell Biol. 51:65–72. DOI: 10.1016/j.ceb.2017.11.005. PMID: 29195118. PMCID: PMC5949255.
12. Parrales A, Iwakuma T. 2015; Targeting oncogenic mutant p53 for cancer therapy. Front Oncol. 5:288. DOI: 10.3389/fonc.2015.00288. PMID: 26732534. PMCID: PMC4685147.
13. Sadeghi MR, Jeddi F, Soozangar N, Somi MH, Samadi N. 2017; The role of Nrf2-Keap1 axis in colorectal cancer, progression, and chemoresistance. Tumour Biol. 39:1010428317705510. DOI: 10.1177/1010428317705510. PMID: 28621229.
14. Schübeler D. 2015; ESCI award lecture: regulation, function and biomarker potential of DNA methylation. Eur J Clin Invest. 45:288–293. DOI: 10.1111/eci.12403. PMID: 25608229.
15. Mosca L, Vitiello F, Borzacchiello L, et al. 2021; Mutual correlation between non-coding RNA and S-Adenosylmethionine in human cancer: Roles and therapeutic opportunities. Cancers (Basel). 13:3264. DOI: 10.3390/cancers13133264. PMID: 34209866. PMCID: PMC8268931.
16. Pajares MJ, Alemany-Cosme E, Goñi S, Bandres E, Palanca-Ballester C, Sandoval J. 2021; Epigenetic regulation of microRNAs in cancer: Shortening the distance from bench to bedside. Int J Mol Sci. 22:7350. DOI: 10.3390/ijms22147350. PMID: 34298969. PMCID: PMC8306710.
17. Livak KJ, Schmittgen TD. 2001; Analysis of relative gene expression data using real-time quantitative PCR and the 2−ΔΔCT method. Methods. 25:402–408. DOI: 10.1006/meth.2001.1262. PMID: 11846609.
18. Li N, Cui T, Guo W, Wang D, Mao L. 2019; MiR-155-5p accelerates the metastasis of cervical cancer cell via targeting TP53INP1. Onco Targets Ther. 12:3181–3196. DOI: 10.2147/OTT.S193097. PMID: 31118671. PMCID: PMC6500876.
19. Dong Y, Yu T, Ding L, et al. 2018; A dual targeting dendrimer-mediated siRNA delivery system for effective gene silencing in cancer therapy. J Am Chem Soc. 140:16264–16274. DOI: 10.1021/jacs.8b10021. PMID: 30346764.
20. He B, Gao SQ, Huang LD, et al. 2015; MicroRNA-155 promotes the proliferation and invasion abilities of colon cancer cells by targeting quaking. Mol Med Rep. 11:2355–2359. DOI: 10.3892/mmr.2014.2994. PMID: 25420938.
21. Shit MN, Al-Hamadani AH, Al-Askeri MA. Epigenetic regulation of colorectal adenocarcinoma cells using ncRNA [PhD thesis]. University of Al-Qadisiyah College of Medicine;Al-Qādisiyyah:
22. Zhang GJ, Xiao HX, Tian HP, Liu ZL, Xia SS, Zhou T. 2013; Upregulation of microRNA-155 promotes the migration and invasion of colorectal cancer cells through the regulation of claudin-1 expression. Int J Mol Med. 31:1375–1380. DOI: 10.3892/ijmm.2013.1348. PMID: 23588589.
23. Liu N, Jiang F, Han XY, et al. 2018; MiRNA-155 promotes the invasion of colorectal cancer SW-480 cells through regulating the Wnt/β-catenin. Eur Rev Med Pharmacol Sci. 22:101–109.
24. Colemon A, Harris TM, Ramanathan S. 2020; DNA hypomethylation drives changes in MAGE-A gene expression resulting in alteration of proliferative status of cells. Genes Environ. 42:24. DOI: 10.1186/s41021-020-00162-2. PMID: 32760472. PMCID: PMC7392716.
25. Lee YT, Tan YJ, Oon CE. 2018; Molecular targeted therapy: Treating cancer with specificity. Eur J Pharmacol. 834:188–196. DOI: 10.1016/j.ejphar.2018.07.034. PMID: 30031797.
Fig. 1
Inverted fluoresce microscope images of Caco2 and WI38 cells before and after transfection with the mir155 agomir and antagomir artificial sequences under ×40 magnification. (A) Caco2, antagomir. (B) Caco2, agomir. (C) Caco2, before. (D) Wi38, antagomir, (E) Wi38, agomir and (F) Wi38, before.
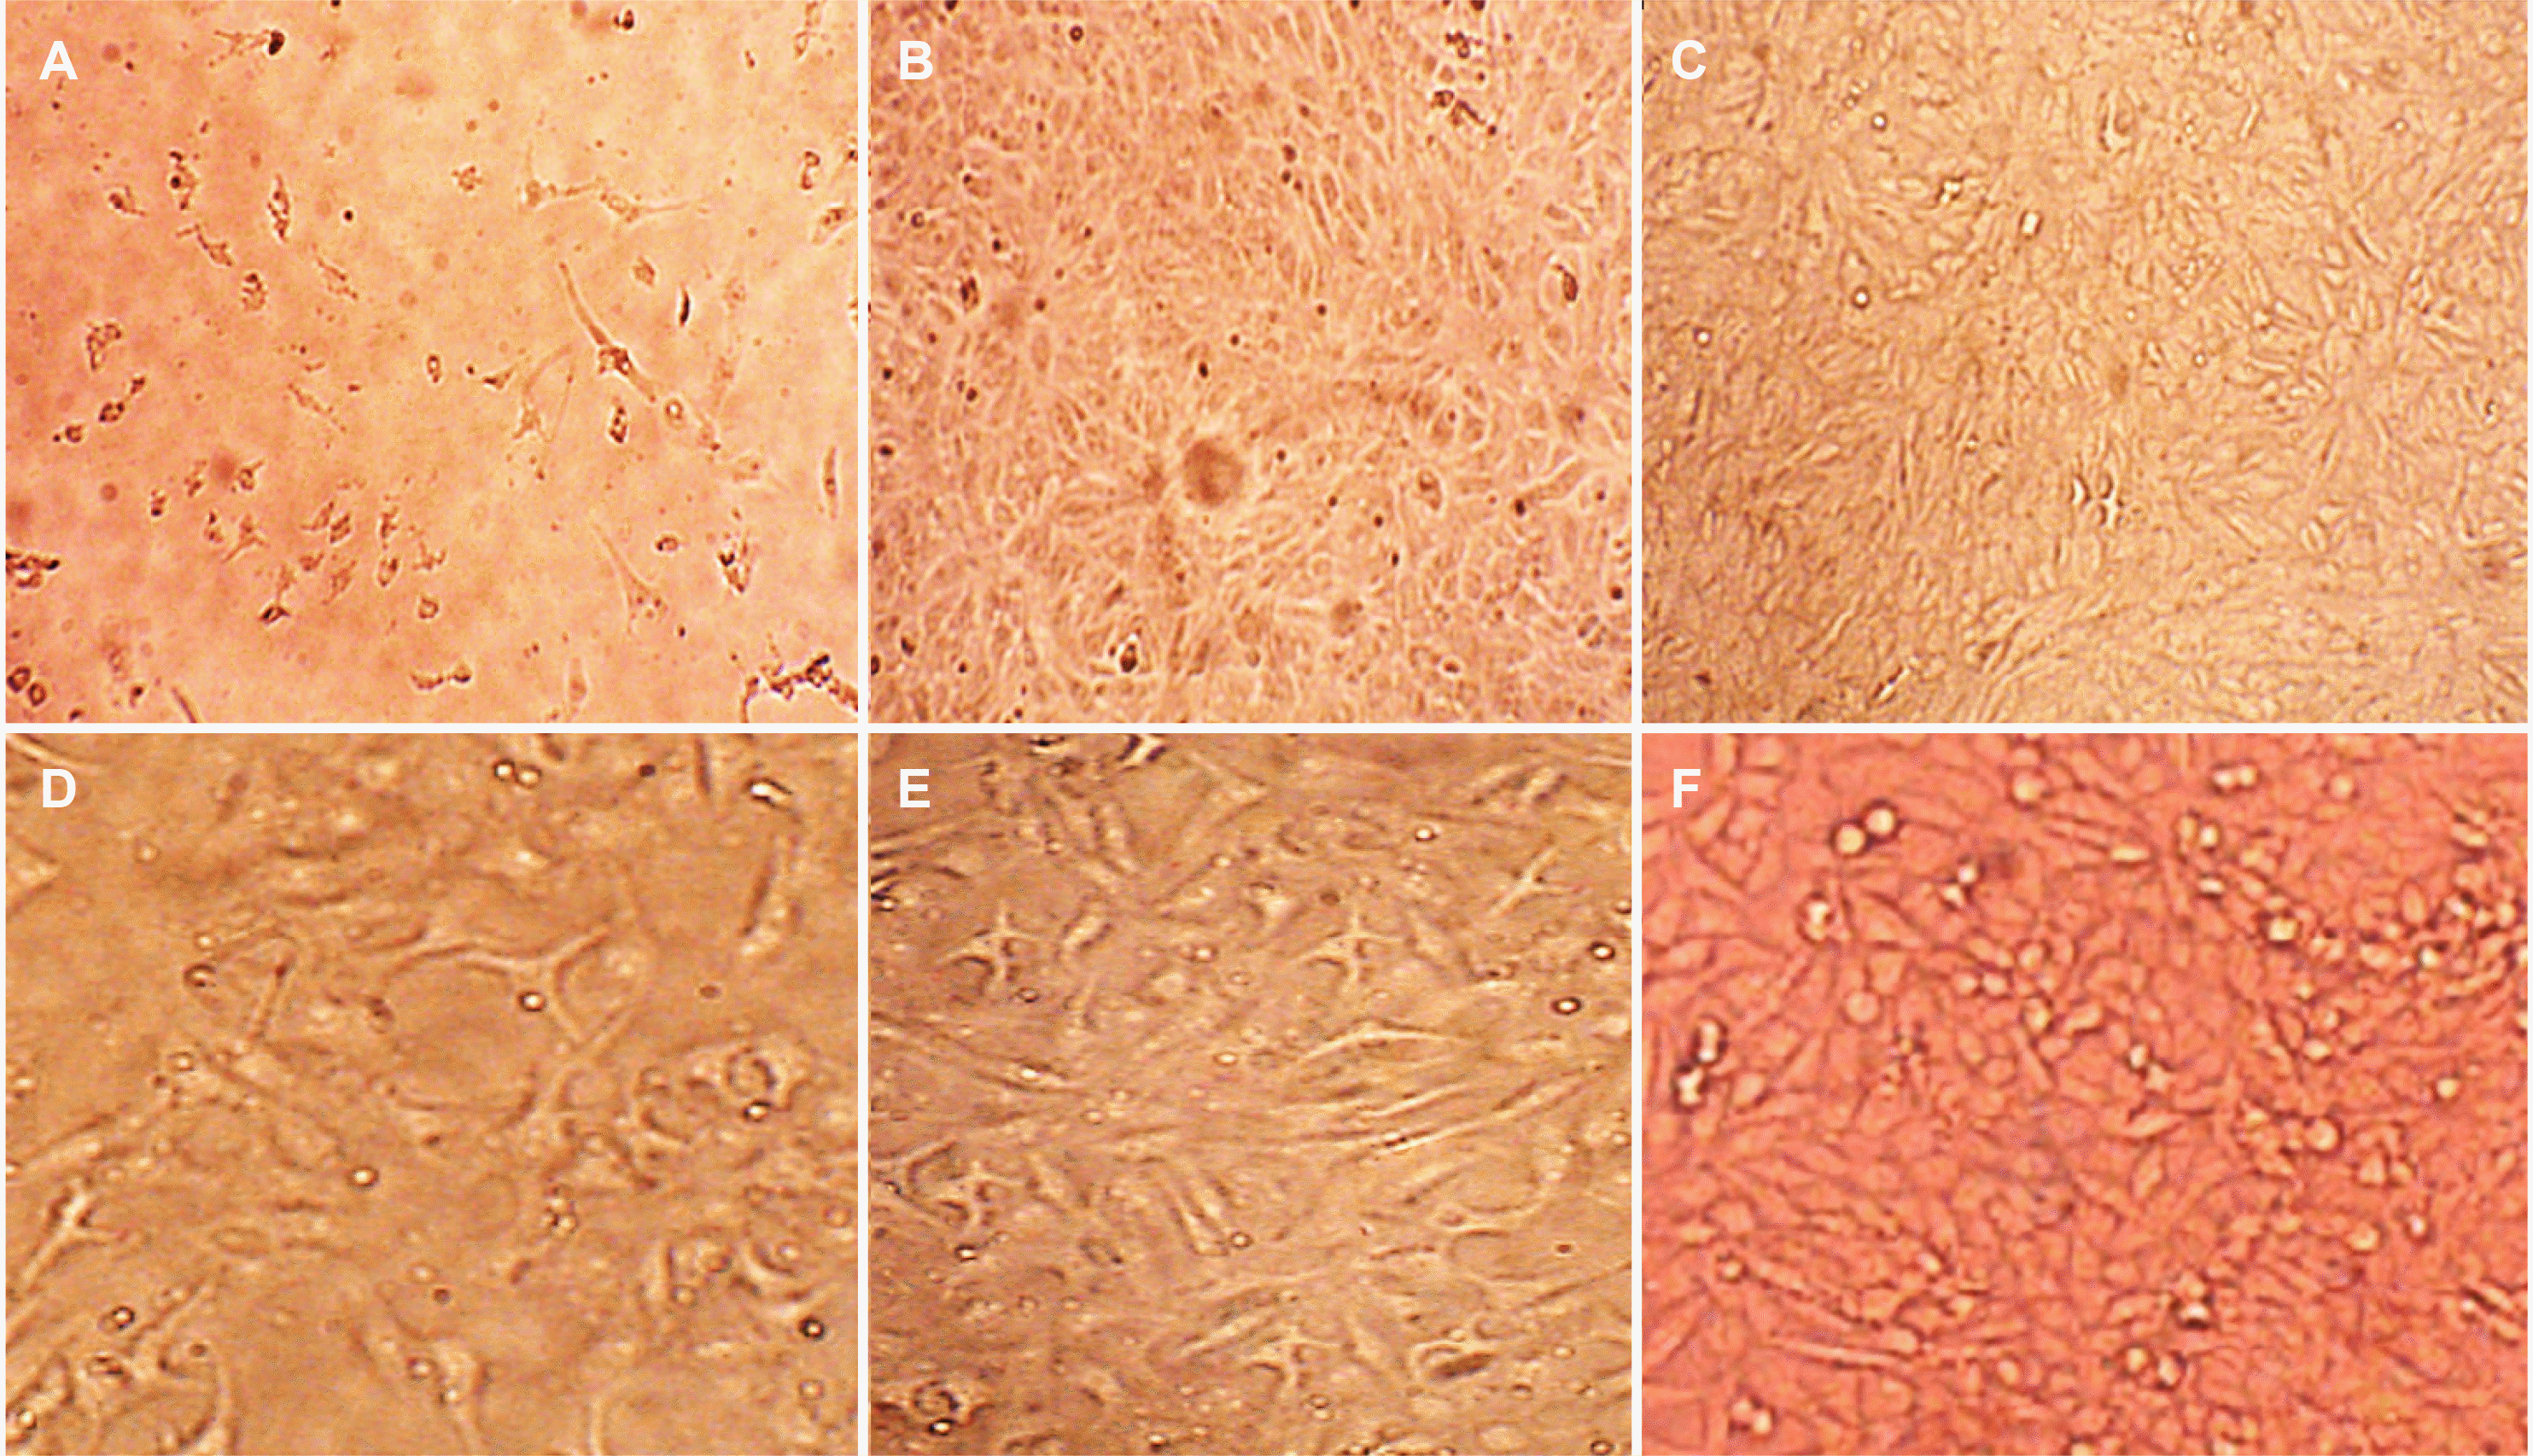
Fig. 2
Amplification products of conventional and MS-PCR of AKT1gene in the Caco2 (left) and Wi38 (right) cell lines: line M, molecular marker (100 bp); upper line, bands of DNA with/without agomir sequence of mir155 transfection; lower line, bands of DNA with/without antagomir sequence of mir155 transfection amplicon size 180–190 bp. The blue arrows represent significant results. Electrophoresis conditions, 5v/cm2 and agarose concentration 1.5%.
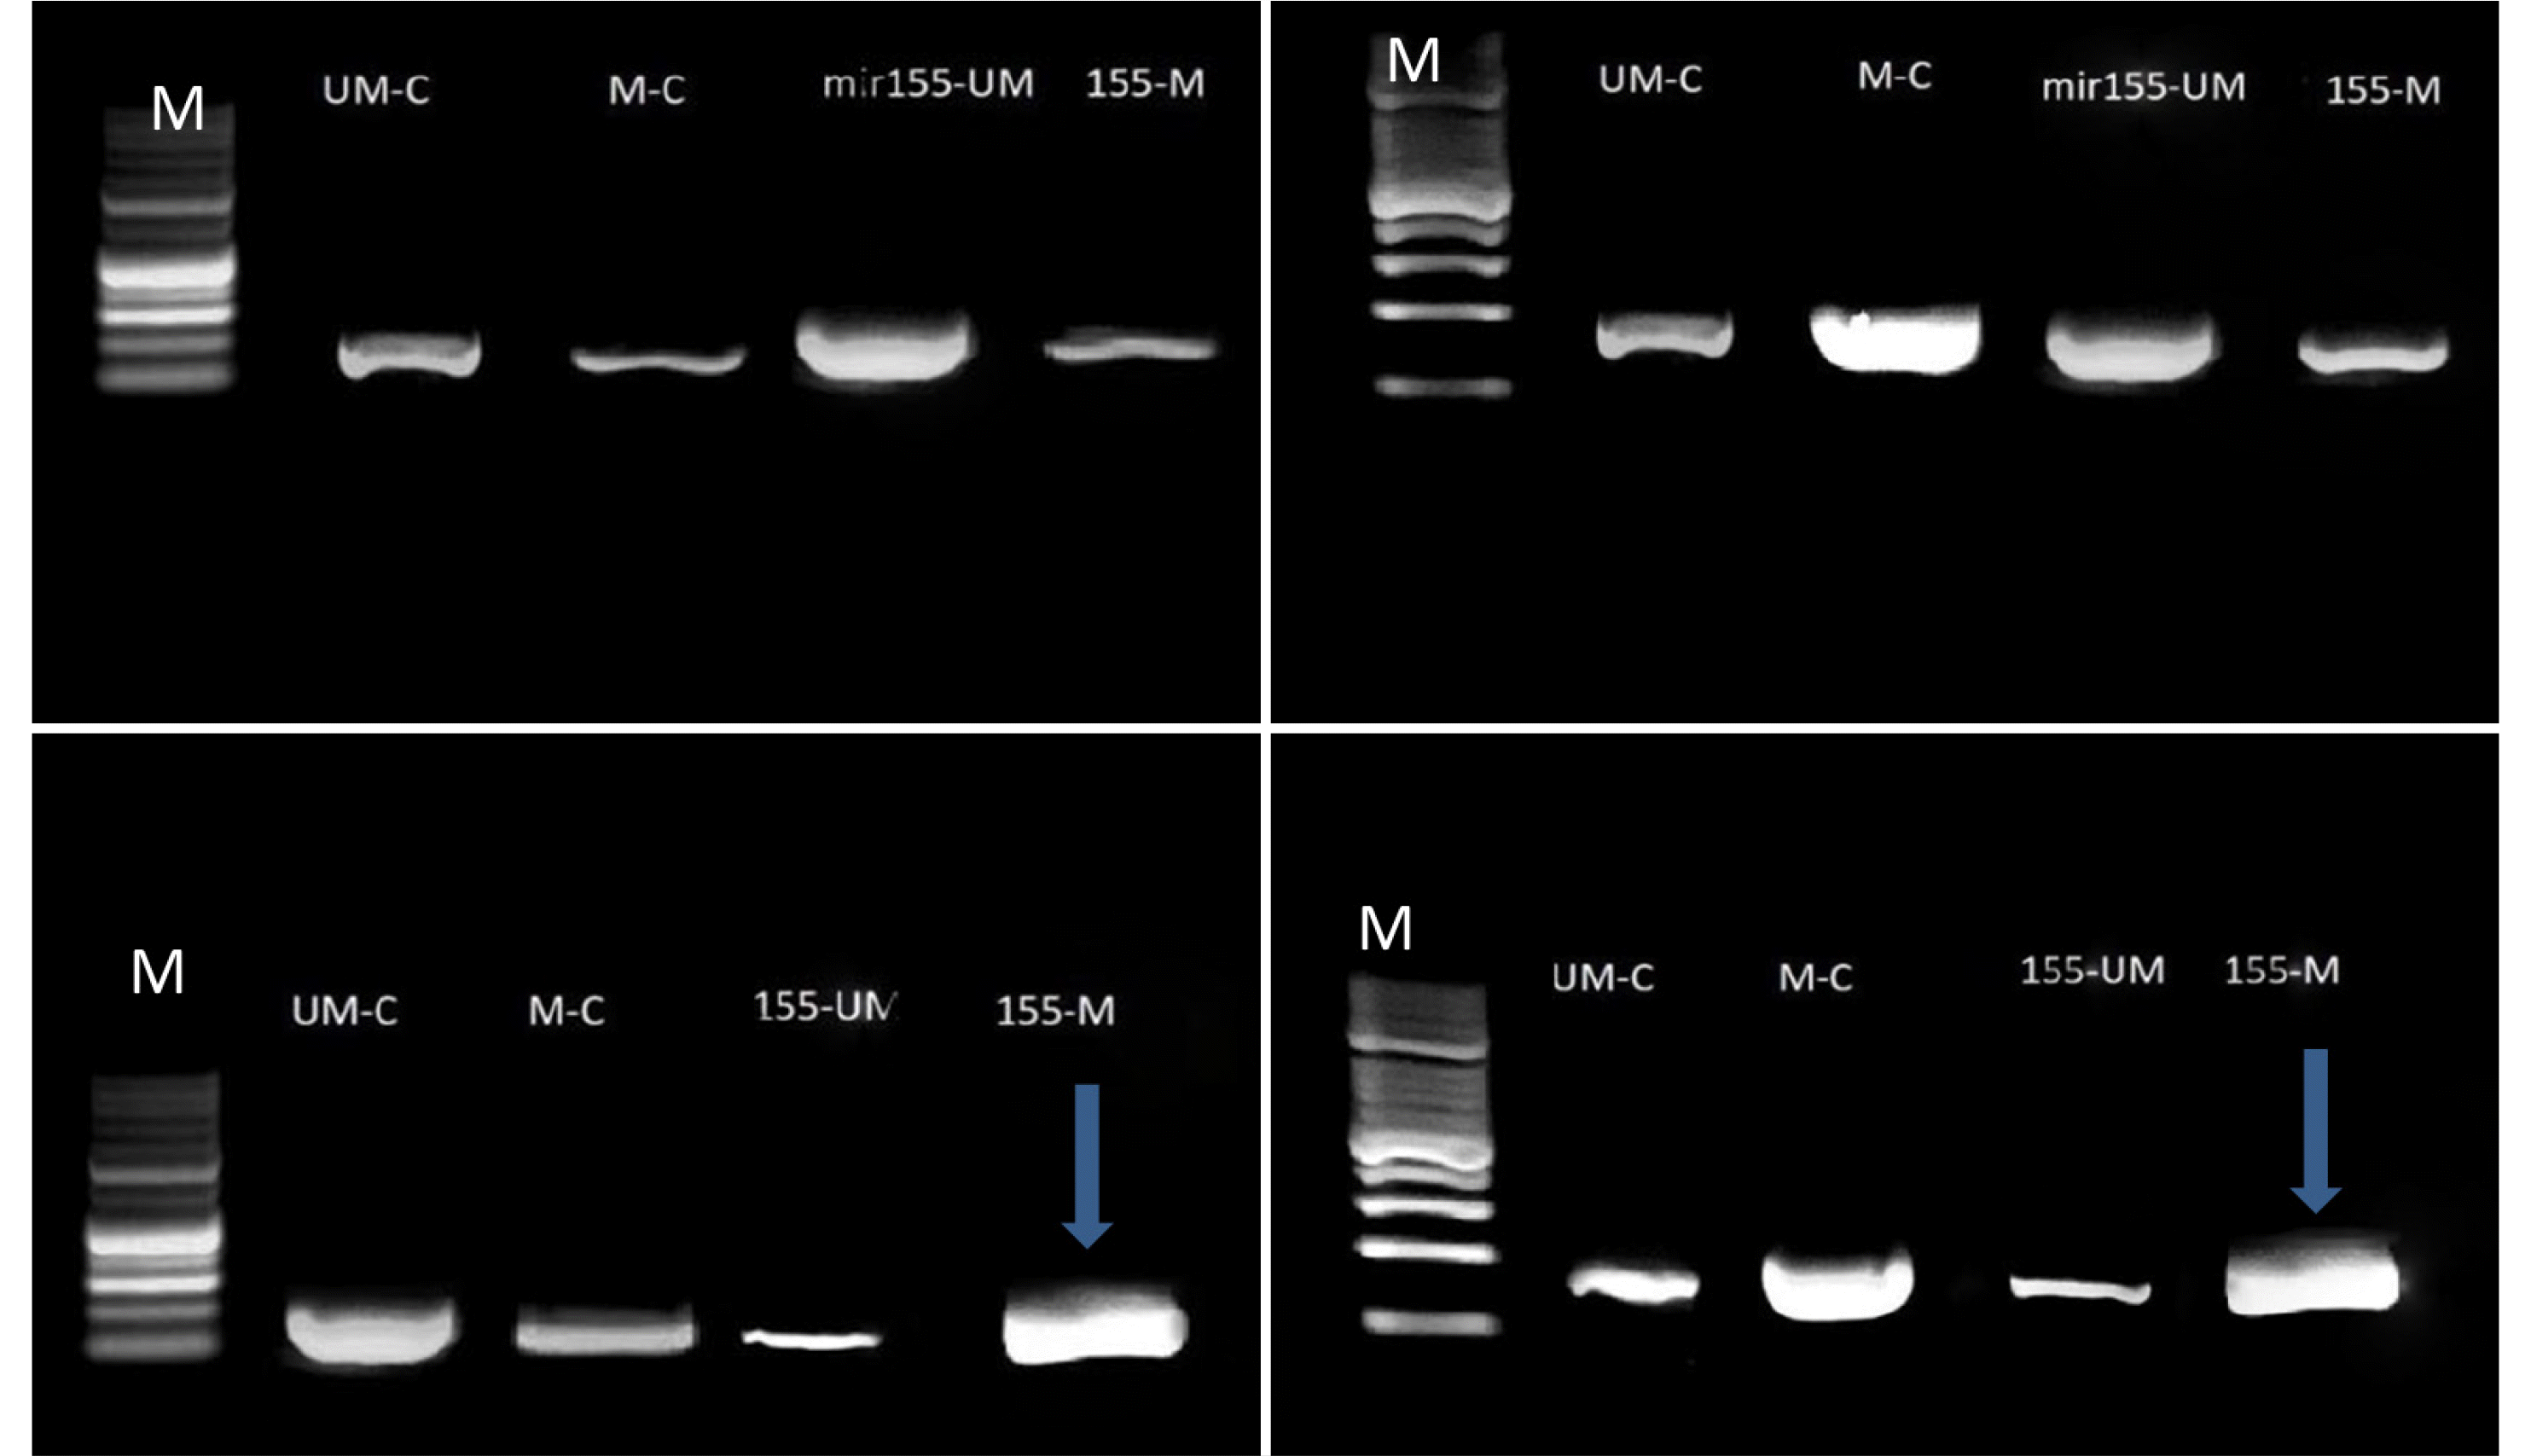
Fig. 3
Amplification products of conventional and MS-PCR of the KEAP1 gene in the Caco2 (left) and Wi38 (right) cell lines: line M, molecular marker (100 bp); upper line, bands of DNA with or without the agomir sequence of mir155 transfection; lower line: bands of DNA with or without antagomir sequence of mir155 transfection amplicon size 180–190 bp. The blue arrows represent significant results. Electrophoresis conditions, 5v/cm2 and agarose concentration 1.5%.
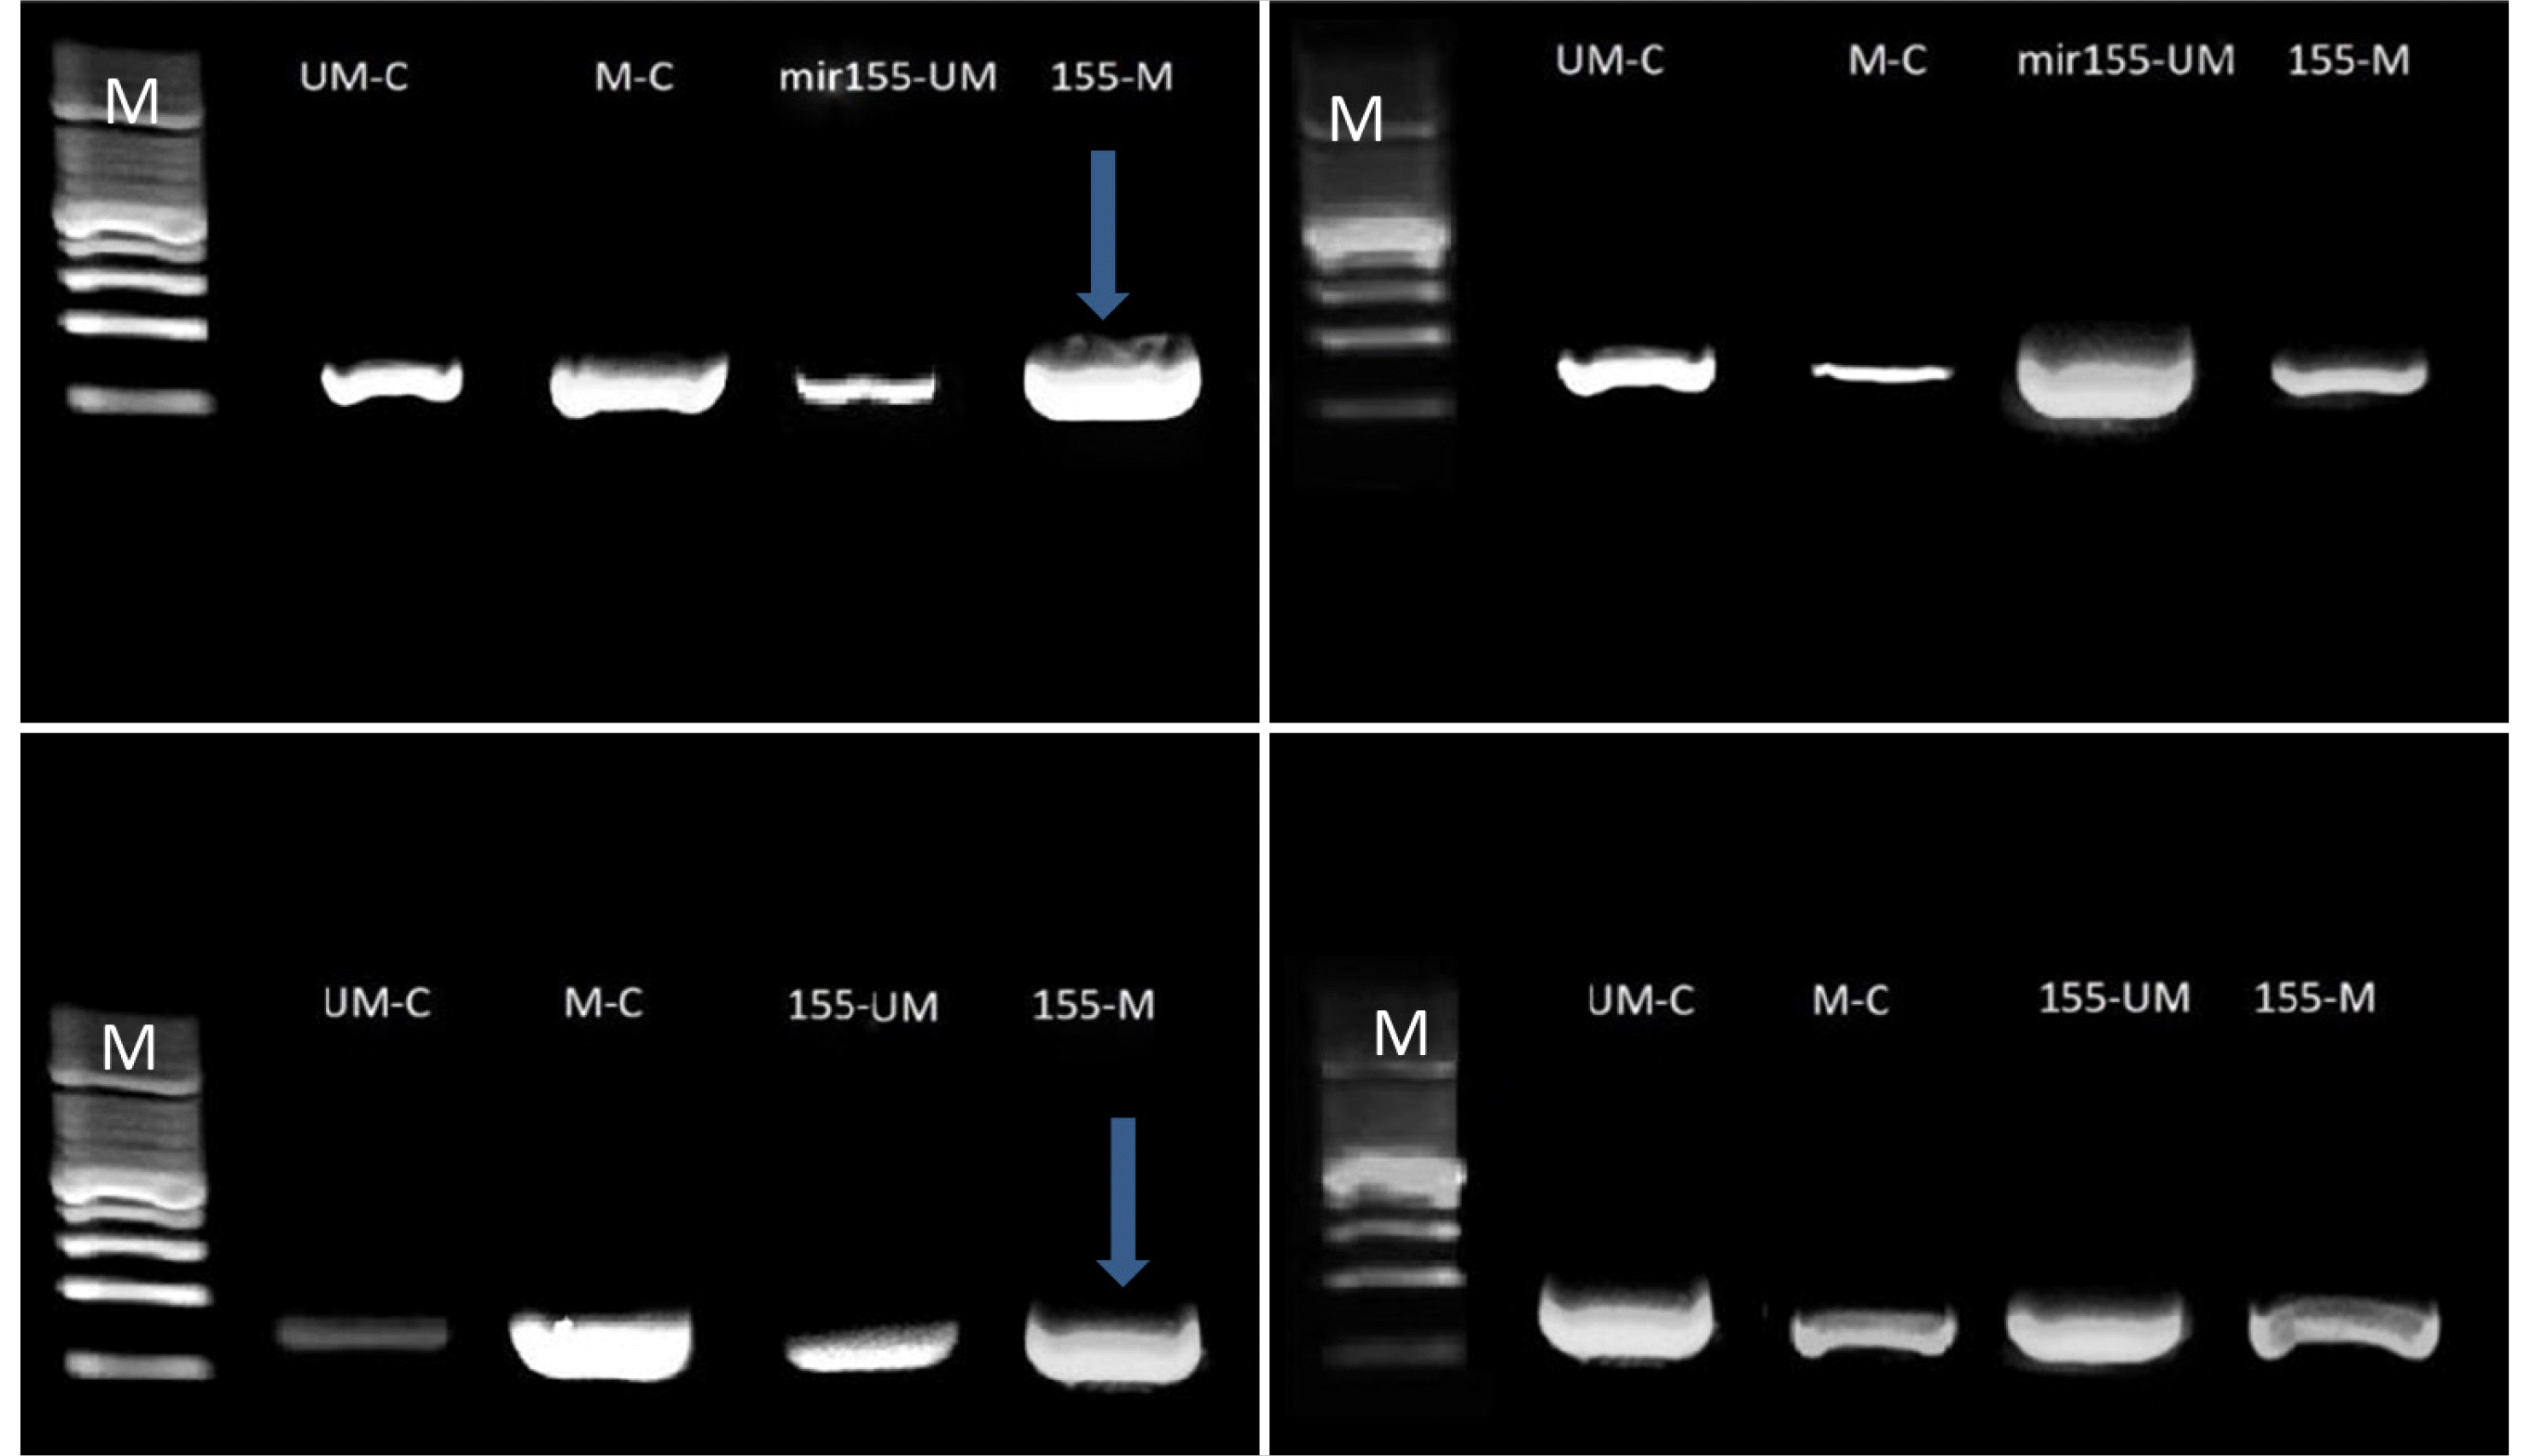
Fig. 4
Amplification products of conventional and MS-PCR of the TP53 gene in the Caco2 (left) and Wi38 (right) cell lines: line M, molecular marker (100 bp); upper line, bands of DNA with or without the agomir sequence of mir155 transfection; lower line: bands of DNA with or without the antagomir sequence of mir155 transfection, amplicon size180-190 bp. The blue arrows represent significant results. Electrophoresis conditions: 5 v/cm2 and agarose concentration of 1.5%.
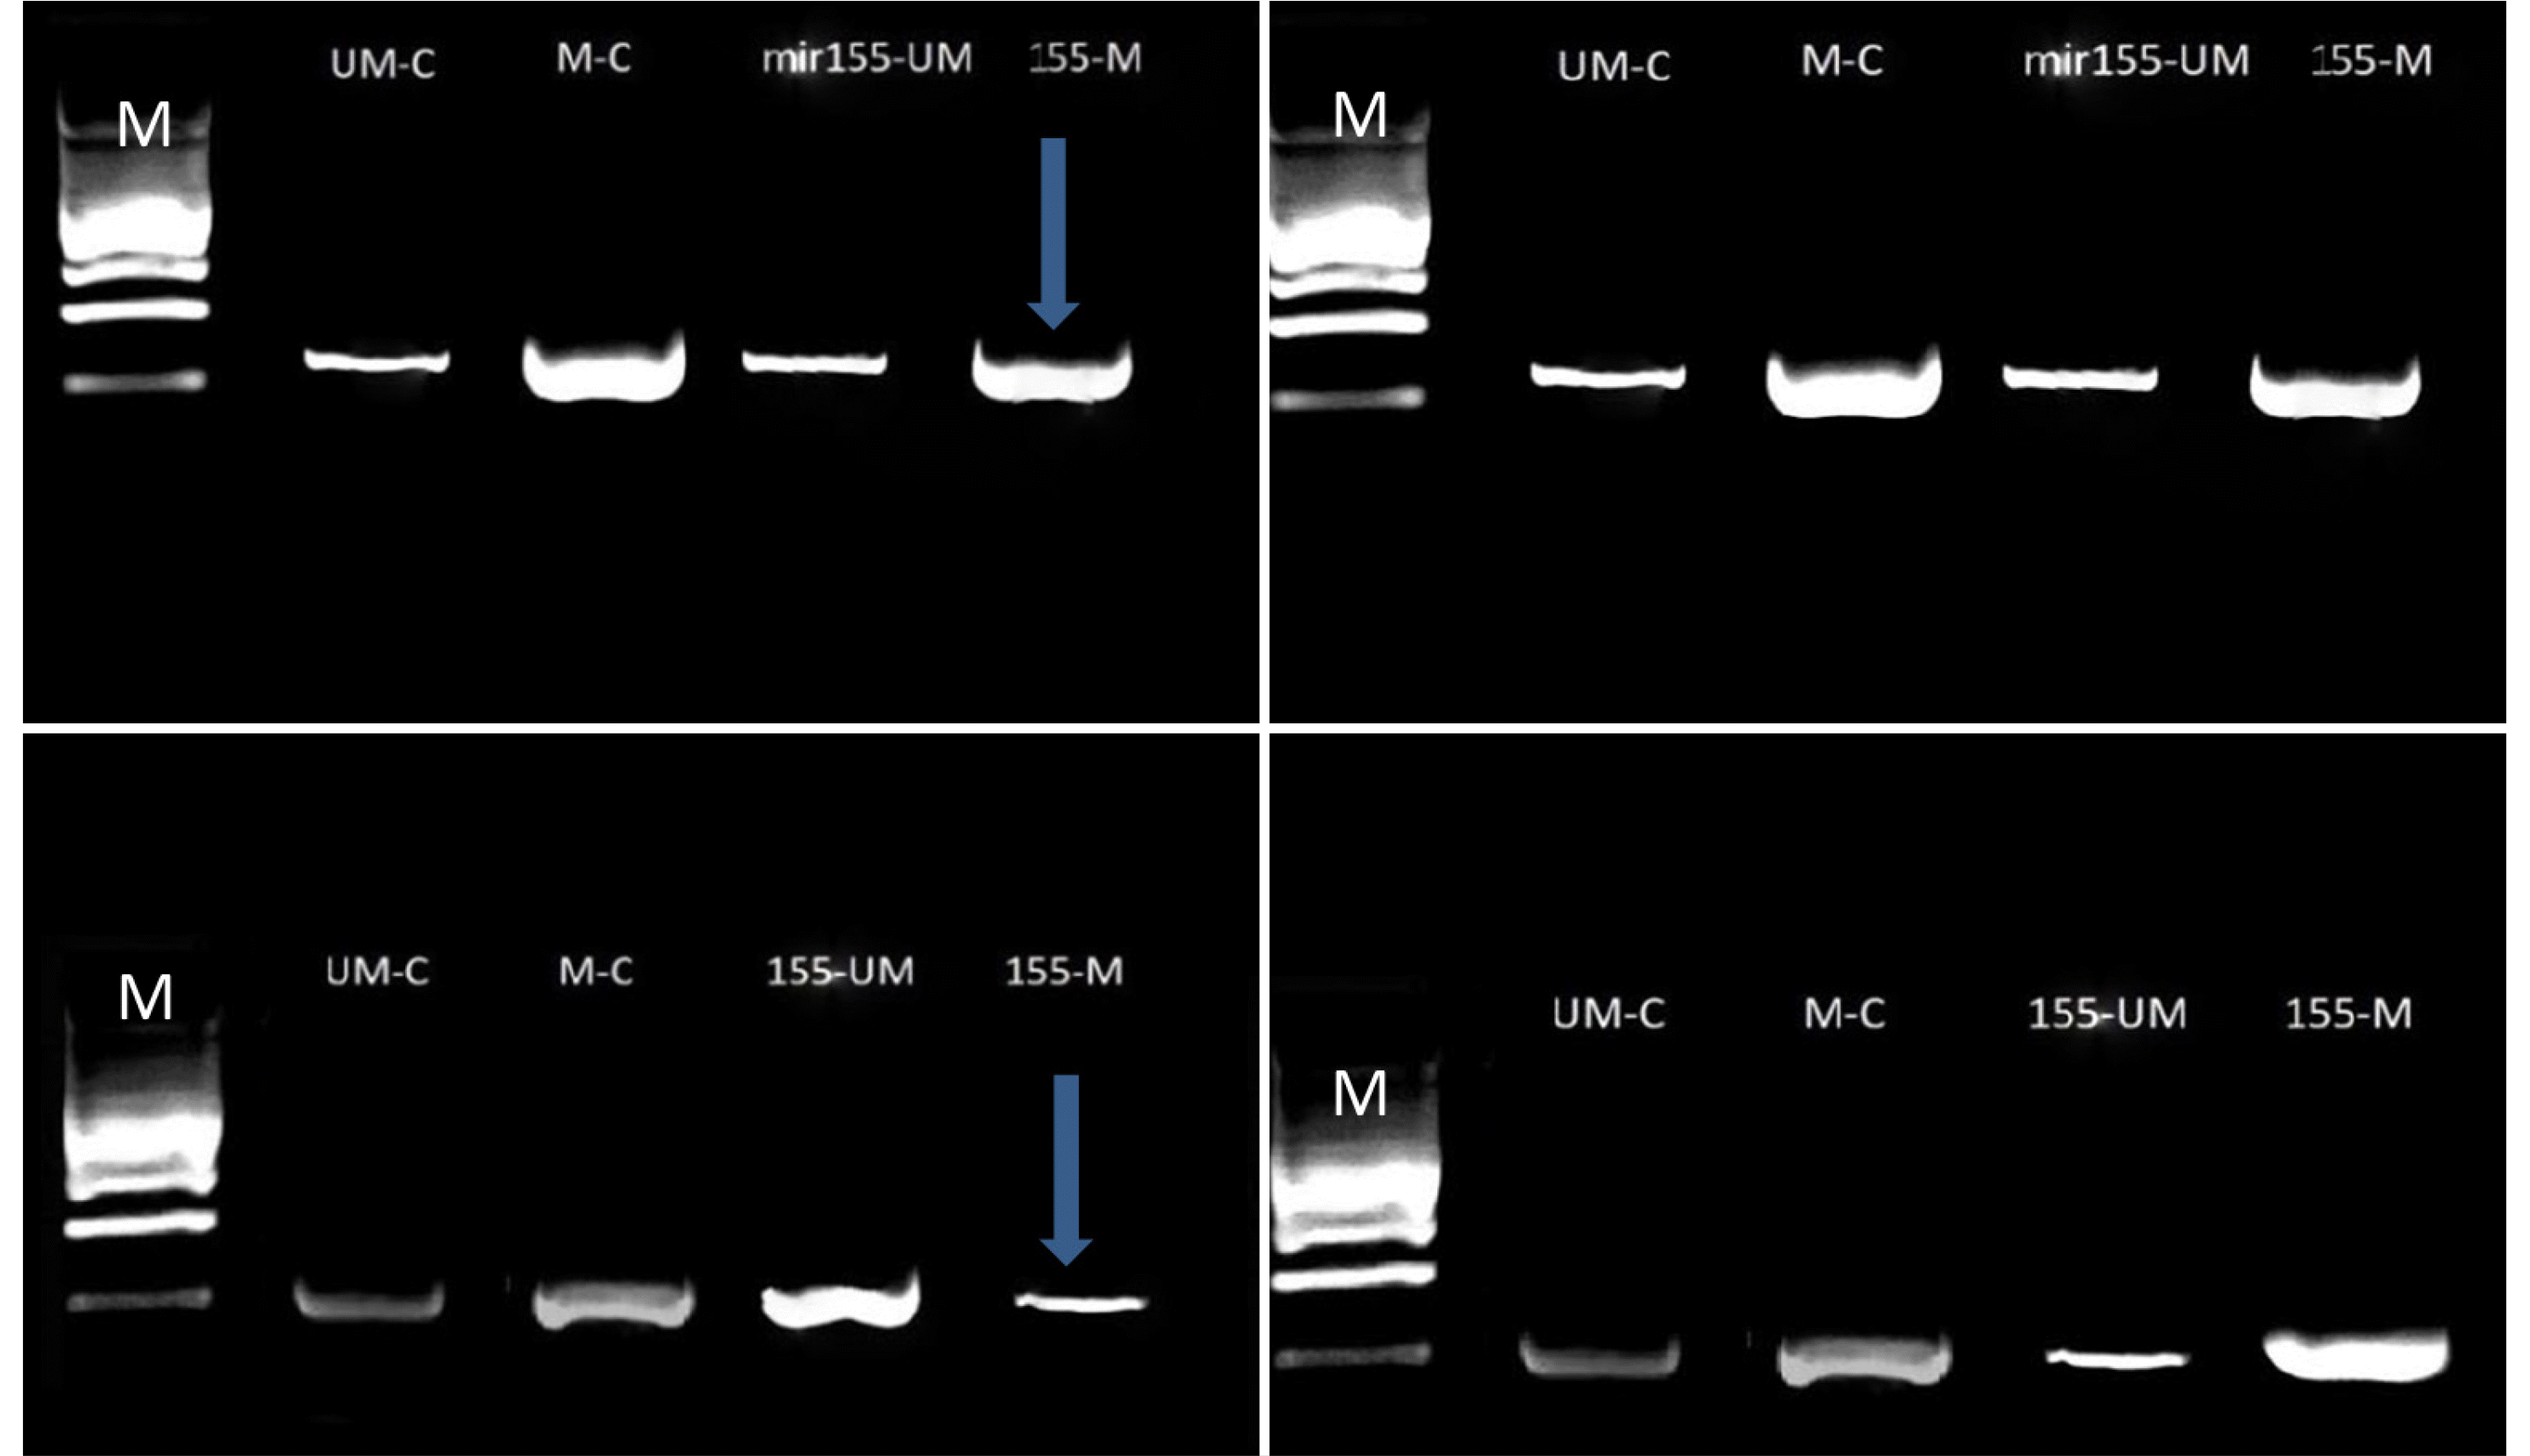
Fig. 5
Amplification products of conventional and MS-PCR of the TP53 gene in the Caco2 (left) and Wi38 (right) cell lines: line M: Molecular marker (100 bp); upper line, bands of DNA with or without the agomir sequence of mir155 transfection; lower line, bands of DNA with or without antagomir sequence of mir155 transfection, Amplicon size180-190 bp. The blue arrows represent significant results. Electrophoresis conditions: 5 v/cm2 and agarose concentration of 1.5%.
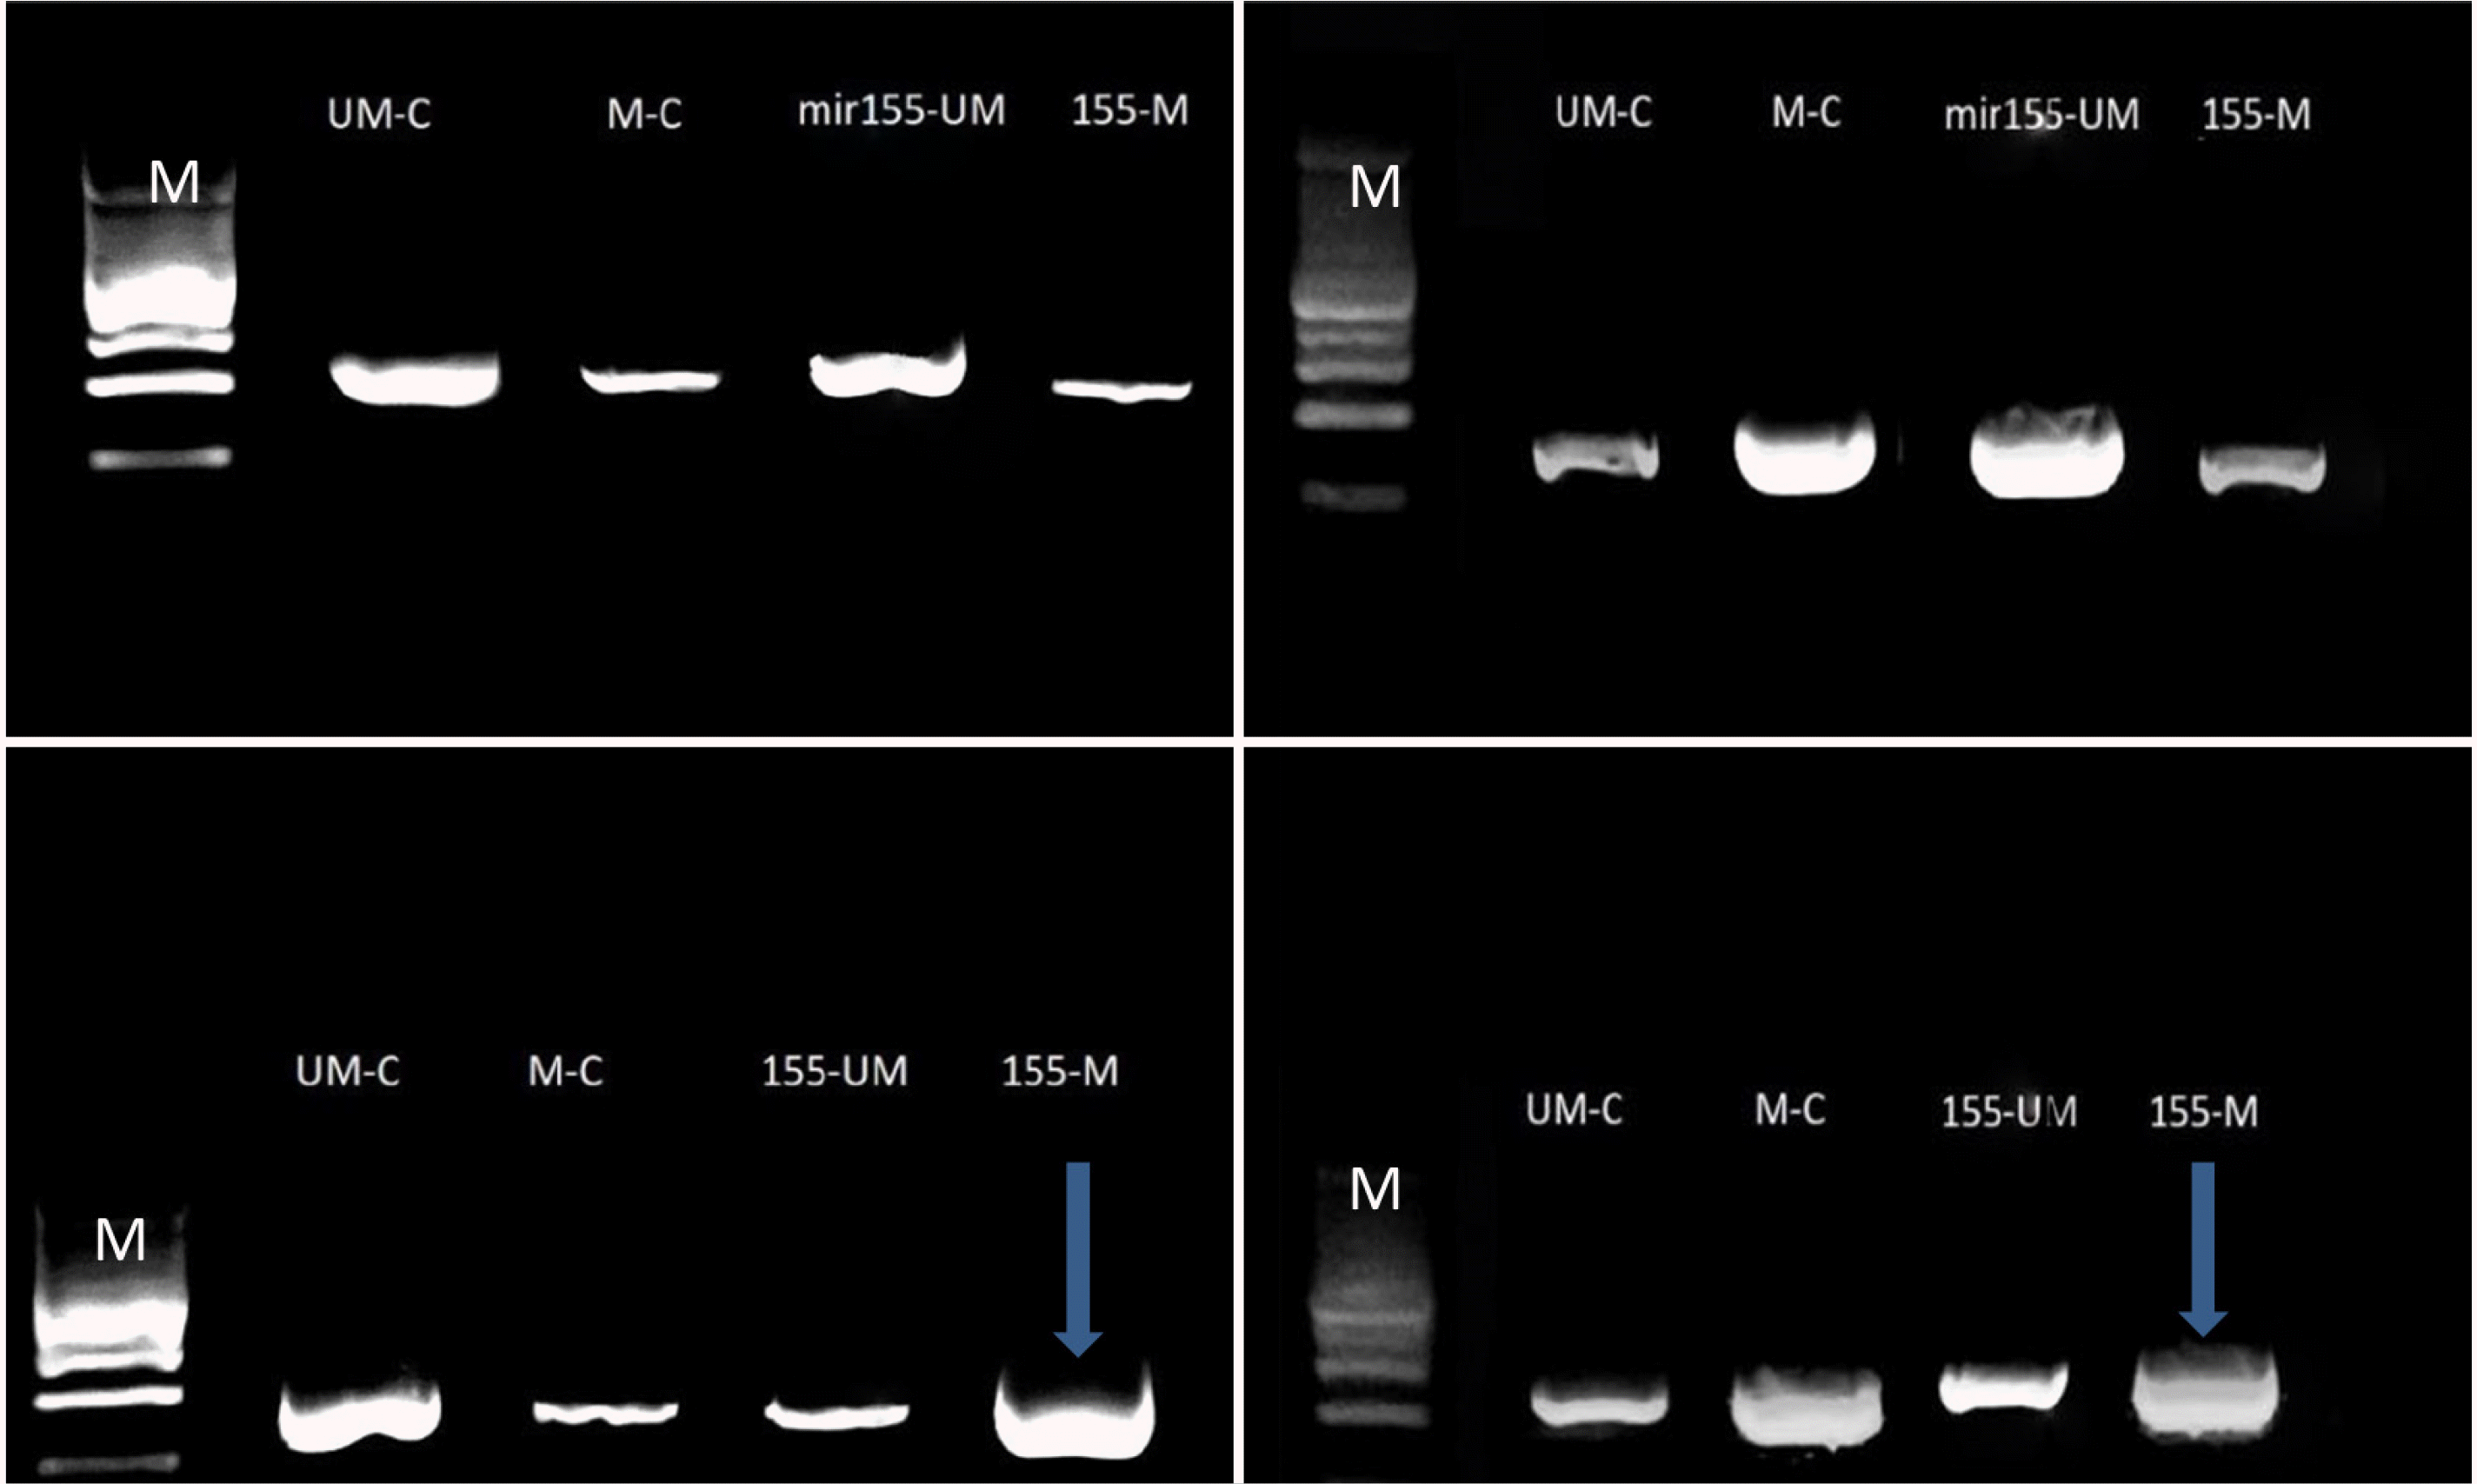
Fig. 6
Amplicon density of the target genes with/without bisulfate modification. The yellow color represents the AKT1 oncogene, with a significant promoter blocking value surrounded by a black line. The blue color represents the KEAP1 antioxidant-responsible gene, with an insignificant blocking value surrounded by a black line. The red color represents the TP53 tumor suppressor gene, with a significant unblocking value surrounded by a black line. The grey color represents the VCAM1 metastasis-responsible gene, with a significant blocking value surrounded by a black line.
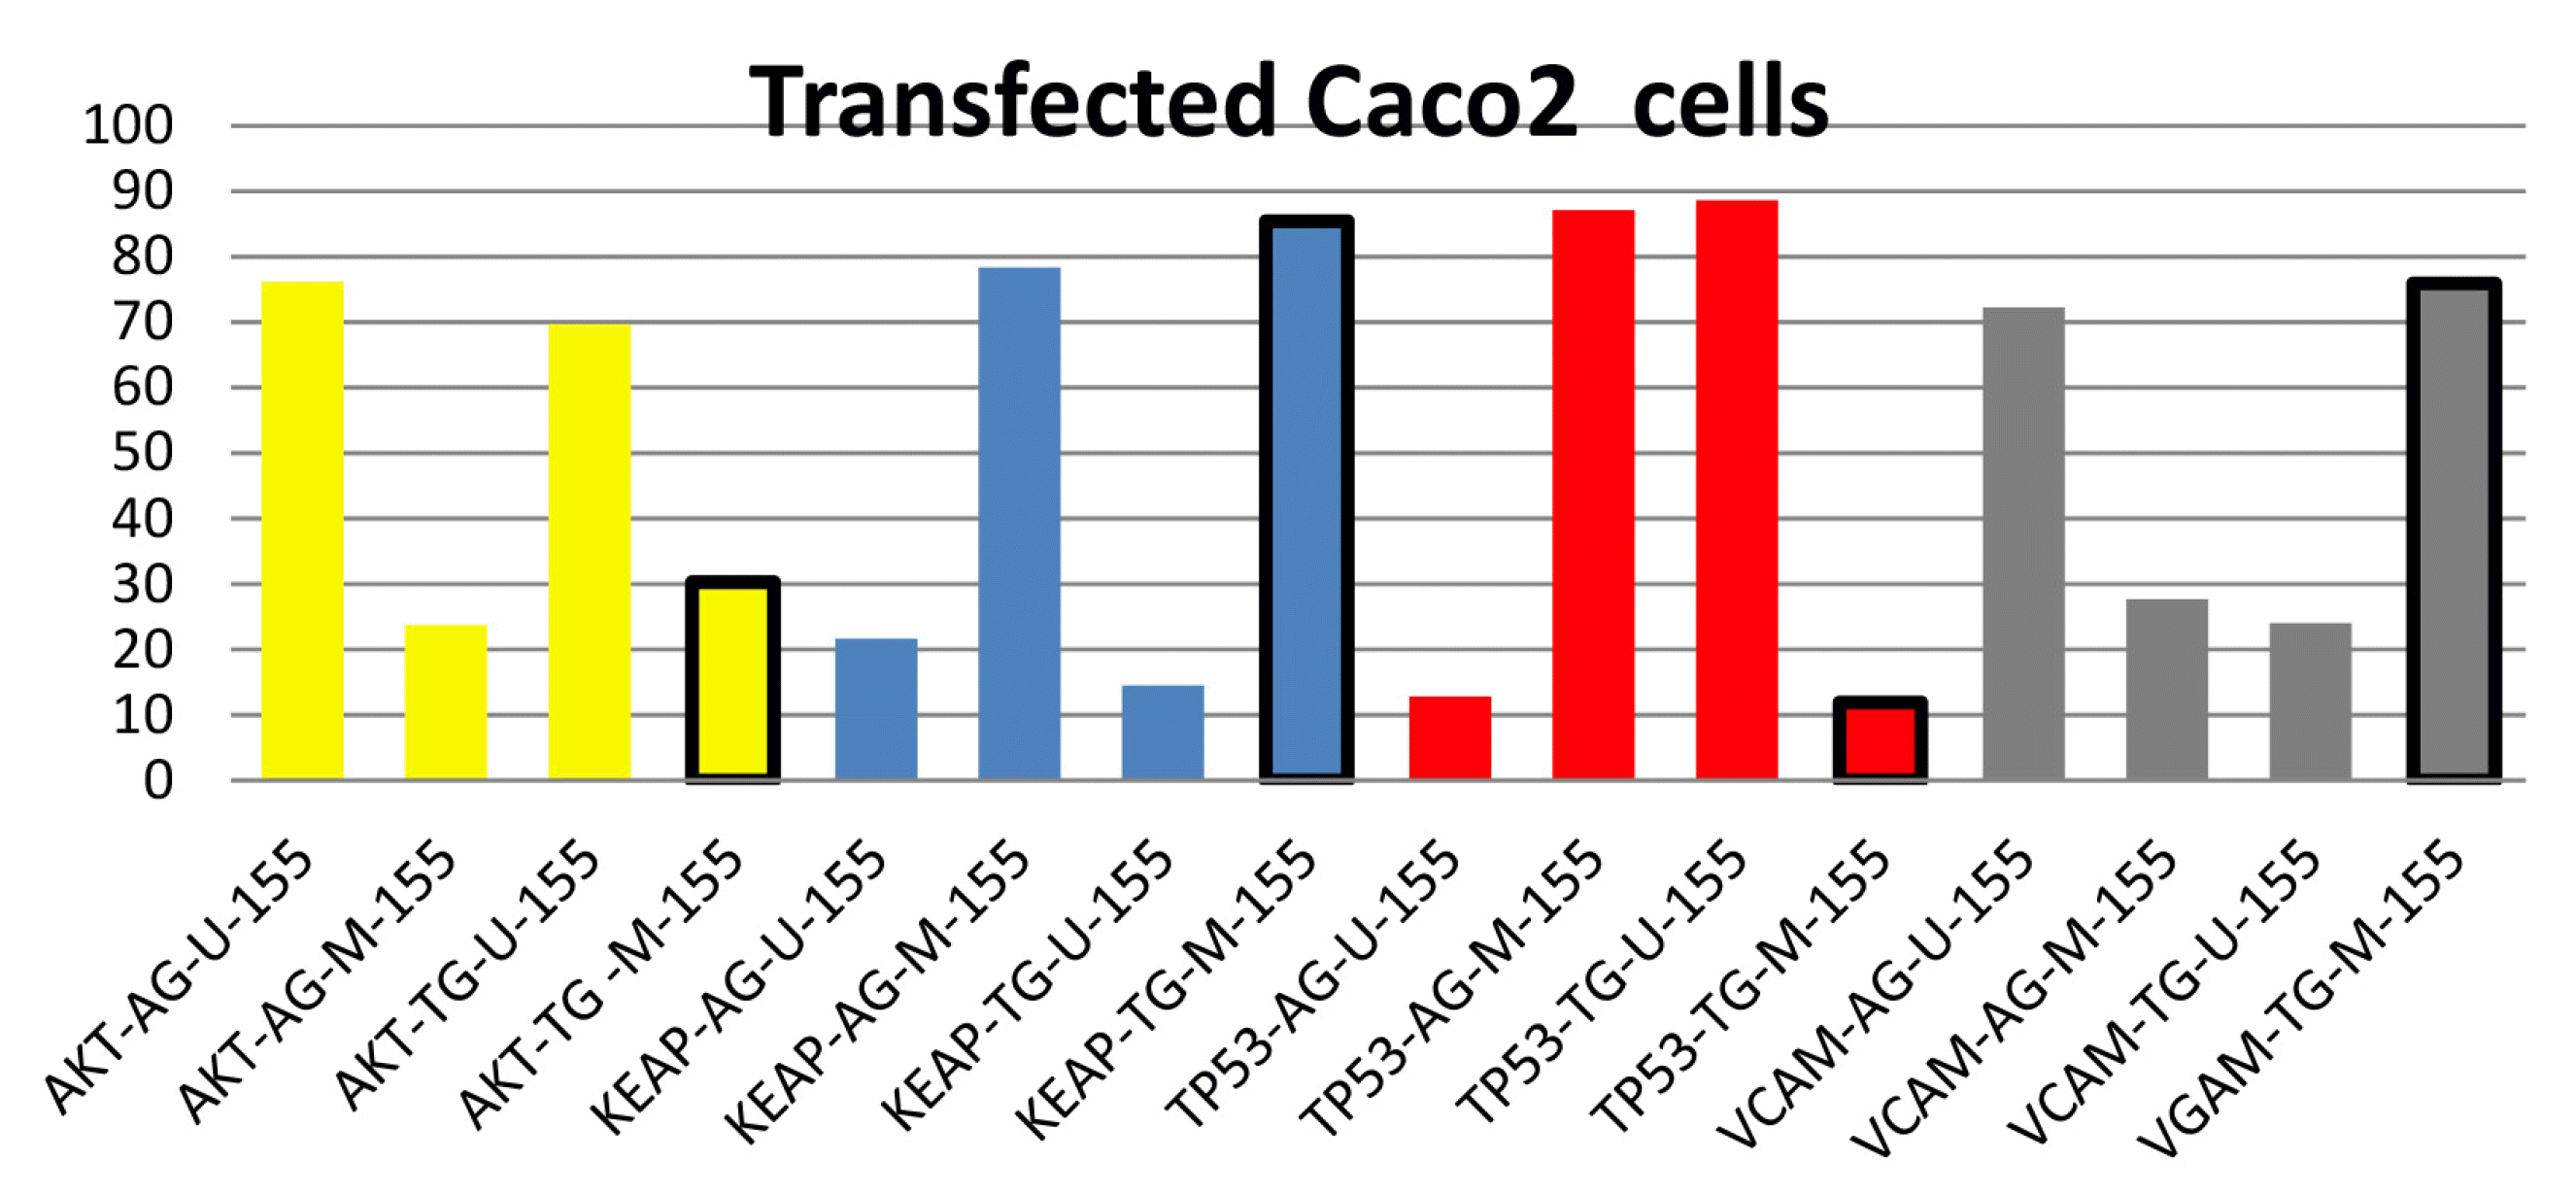
Fig. 7
Amplicon density of the target genes with/without bisulfate modification. The yellow color represents the AKT1 oncogene, with a significant promoter blocking value surrounded by a black line. The blue color represents the KEAP1 antioxidant-responsible gene, with a significant blocking value surrounded by a black line. The red color represents the TP53 tumor suppressor gene, with a significant unblocking value surrounded by a black line. The grey color represents the VCAM1 metastasis-responsible gene, with a significant blocking value surrounded by a black line.
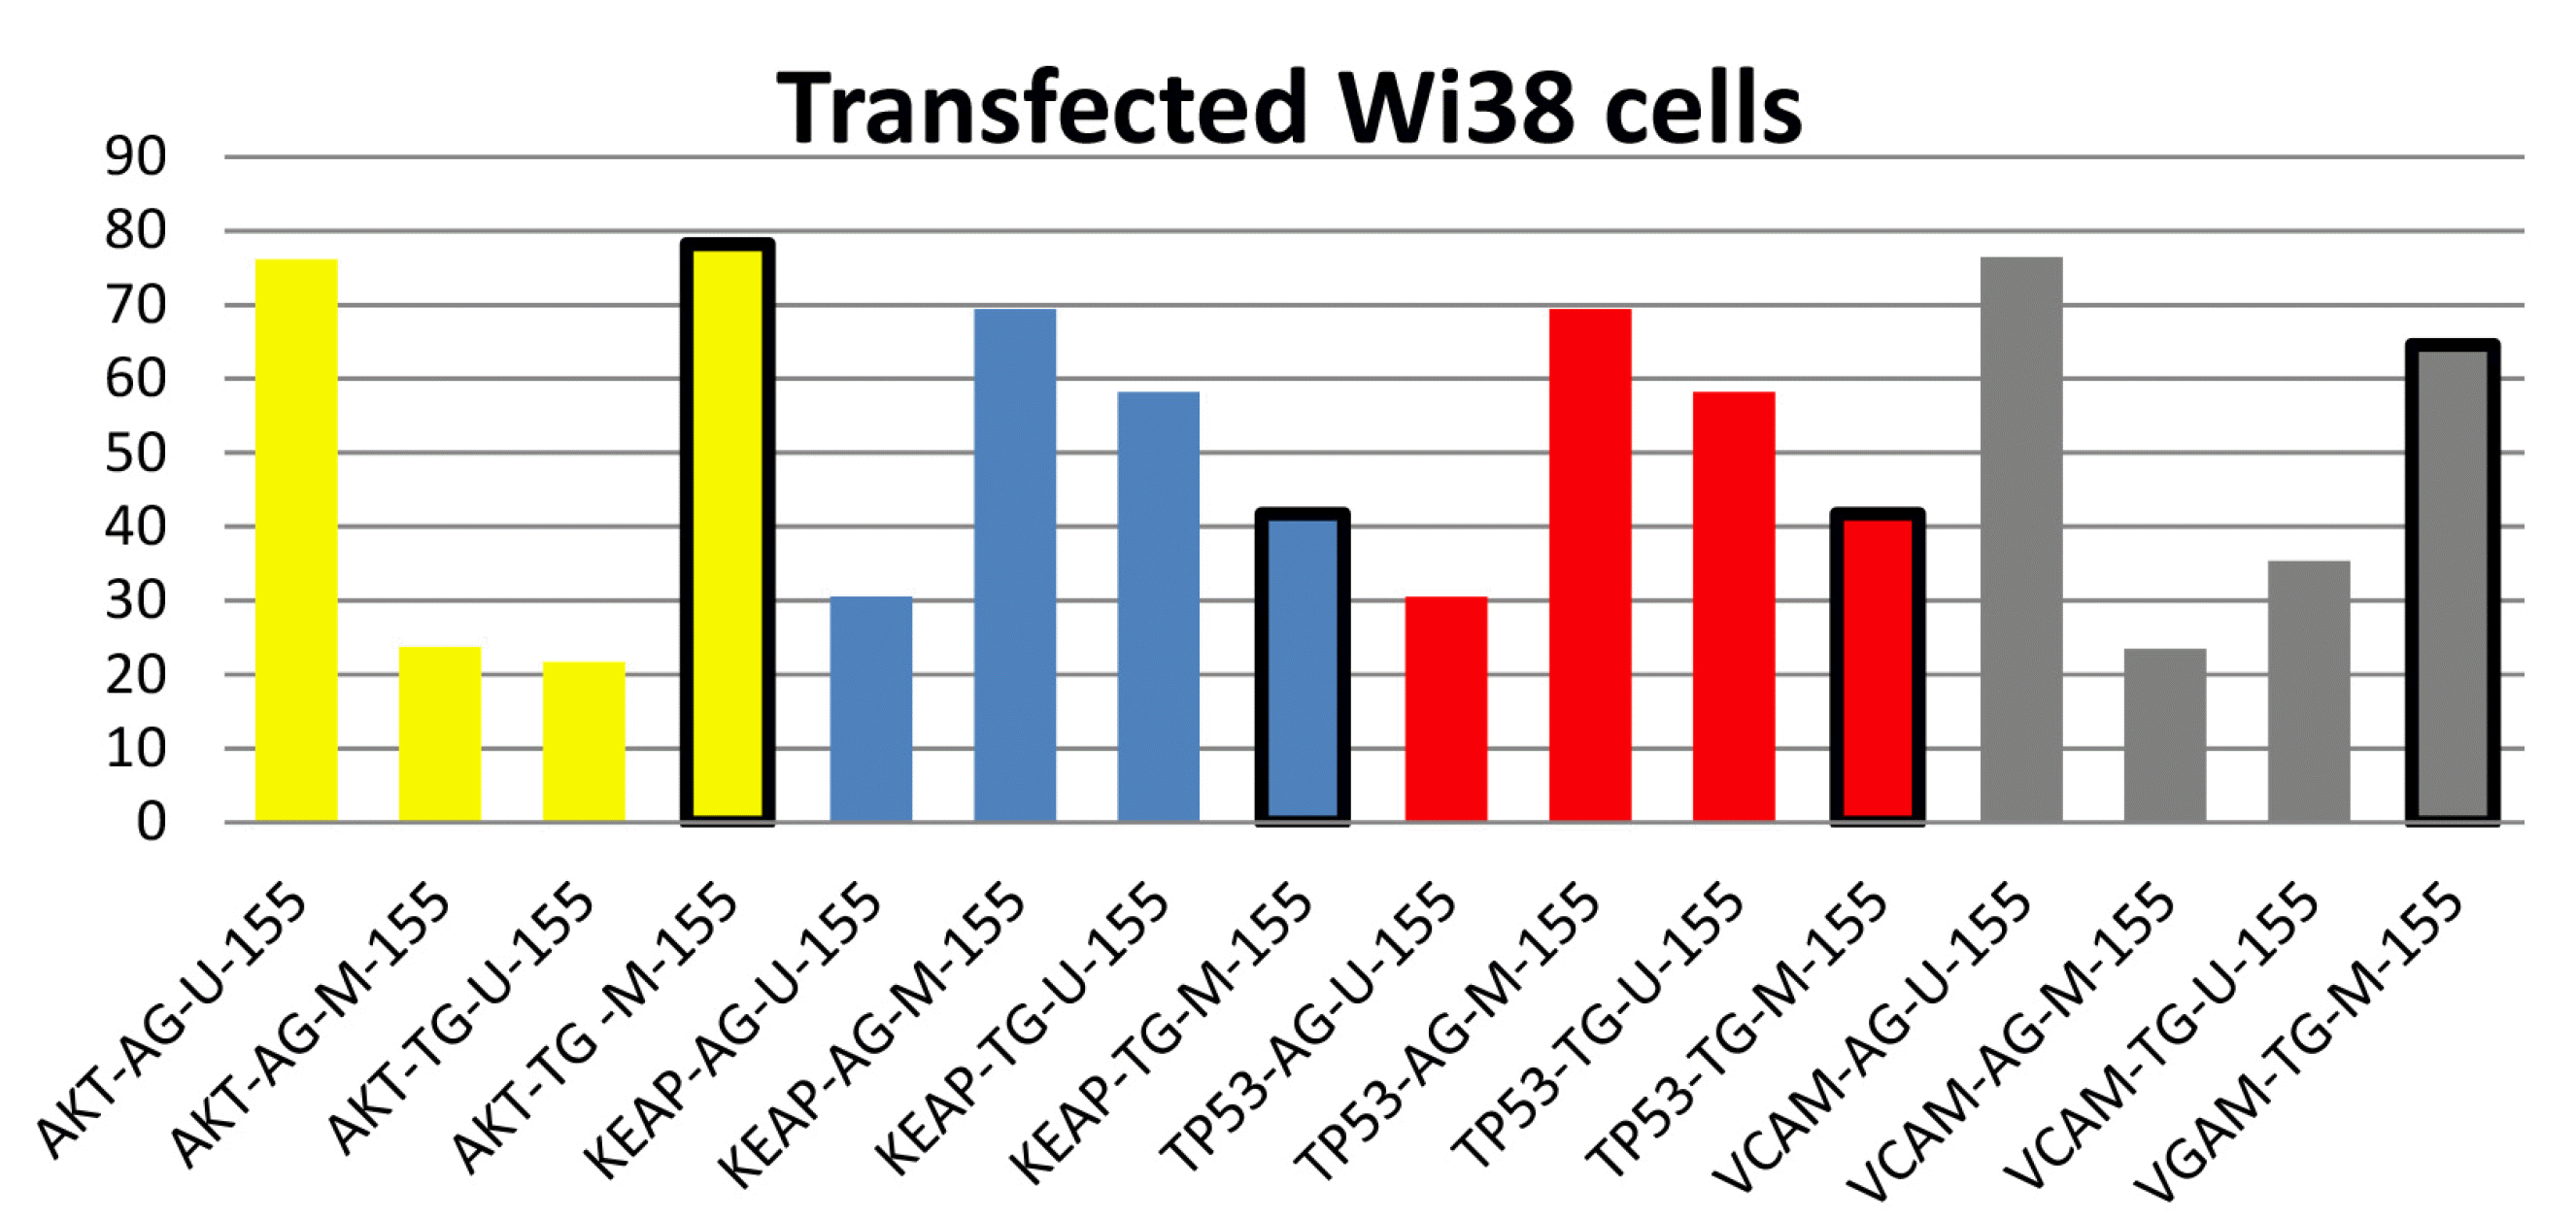
Table 1
Primers Used for cDNA Strand Synthesis
| Gene | Primer (5’-3’) | Source |
|---|---|---|
| hsa-miR-155-5p | GAAAGAAGGCGAGGAGCAGATCGAGGAAGAAGACGGAAGAATGTGCGTCTCGCCTTCTTTCAACCCCTA | Shit et al.21 (2022) |
| snRNA-RNU6 | CGCTTCACGAATTTGCGTGTCAB. |
Table 2
Primers were Used in Real-time PCR for the Detection of the Target mRNA
| Primer | Sequence (5’-3’) | Source | |||
|---|---|---|---|---|---|
| ACTB | F | CATGTACGTTGCTATCCAGGC | R | CTCCTTAATGTCACGCACGAT | Shit et al.21 (2022) |
| AKT1 | AGCGACGTGGCTATTGTGAAG | GCCATCATTCTTGAGGAGGAAGT | |||
| TP53 | CAGCACATGACGGAGGTTGT | TCATCCAAATACTCCACACGC | |||
| KEAP1 | CTGGAGGATCATACCAAGCAGG | GGATACCCTCAATGGACACCAC | |||
| VCAM1 | GGGAAGATGGTCGTGATCCTT | TCTGGGGTGGTCTCGATTTTA | |||
Table 3
Methylation-specific PCR (MSPCR) and Conventional PCR
| Primer | Forward sequence (5’-3’) | Reverse sequence (5’-3’) | Source |
|---|---|---|---|
| U-AKT1 | TGGGTTATTTTATAGATGGGG | ACTAAAAAACAACTCCCAACAACC | Shit et al.21 (2022) |
| M-AKT1 | TCGGGTTATTTTATAGACGGG | AACTAAAAAACAACTCCCGACG | |
| U-TP53 | GTATAAAGTGGTTGGTATGTGGTA | ATCATAAAACAAAAAAAACAAACCC | |
| M-TP53 | GTATAAAGTGGTCGGTACGC | CGTCGTAAAACGAAAAAAACG | |
| U-KEAP1 | GAGGAAGTGATTTTATTGTGG | AAACAACACAACTCTTAAAATAACCC | |
| M-KEAP1 | AGGAAGTGATTTTATCGCGG | GACGCAACTCTTAAAATAACCC | |
| U-VCAM1 | AGAAATTGTGTTTGGTTGGTT | AATATTCCTCTAATCCACACAATTCA | |
| M-VCAM1 | TTTAAGAAATTGTGTTTGGTCG | ATATTCCTCTAATCCACACAATTCG |
Table 4
Transfection Efficiency of the mir155 Agomir and Antagomir Molecules into the Wi38 and Caco-2 Cell Lines
| Transfection case | Wi38 | Caco-2 | |
|---|---|---|---|
| Fold change | |||
| Before (control) | 1 | 1 | |
| After | hsa-mir155 agomir | 1.380087127 | 1.664289805 |
| hsa-mir155 antagomir | 0.195069327 | 4.87510009a | |
Table 5
Viability of the Caco-2 and Wi38 Cell Lines Viability after Transfection with the mir155 Agomir and Antagomir Molecules
Table 6
Transfection of HT29 and WI38 Cell Lines with mir155 Mimic and Antagomir Molecules


 PDF
PDF Citation
 Print
Print


 XML Download