

 PDF
PDF Citation
 Print
Print


INTRODUCTION
Digital health technology is defined as the utilization of digital information, and communication technologies for the collection, share, and analysis of digital data to improve health.1 Digital health technology is being utilized in various medical fields including mobile health, health information technology, wearable devices, telehealth, and personalized medicine. Digital health technologies can use computing platforms, connectivity, software and sensors for medical and related purposes.2 The coronavirus disease 2019 pandemic has intensified the demand for digital health technology.3
According to global population aging, the elderly population is no longer a minority, and the number of older adults using digital health technology is increasing.4 In previous studies, it has been reported that more than two-thirds of older adults over 65 years of age use the Internet,5 and more than 60% of people use smartphones.6
However, older adults have lower rates of the Internet and healthcare technology usage compared to younger age groups.7 They often experience difficulties in using digital health technology owing to their inexperience and physical limitations, which tend to increase with age, even among older adults.8 Therefore, although digital health technology is an emerging field of health management, it requires more considerations when applied to older adults compared to younger adults.9 To increase the usage digital health technology among older adults, it is important to identify their specific purposes and expectations for such technology.1011 Specifically, there are some papers indicating reduced utilization of digital health technologies among frail individuals,1213 and the patterns of digital health technology usage among frail older adults are not well-known. In one review paper, the presence of smartphone, computer or tablet, and internet usage was examined, along with where health information was obtained. However, there has been a lack of comprehensive studies that compare the utilization levels, purposes, and other aspects of digital health technologies among healthy older adults.14
In this study, we investigated 1) the status of digital health technology utilization, 2) the purpose of digital health technology utilization, and 3) the factors associated with digital health technology utilization among older adults in Korea. Additionally, we sought to identify whether there was a difference in digital health technology utilization between frail and pre-frail older adults and healthy older adults.
METHODS
Participants
The Ministry of Science and ICT conducts an annual survey on the digital information divide. According to this survey, 76.6% of older adults used the Internet, while 76.5% used smartphones. On the Internet, 99.8% of people use smartphones. However, the usage rates of online financial and public services were 41.1% and 19.3%, respectively, indicating a significant difference in usage rates depending on the item.15 In our study, participants who had used health-related applications constituted a separate sample and were examined alongside the general sample because it is anticipated that the number of older adults utilizing health-related applications will be low.
According to the 2021 Population Census, the population of individuals aged 65 and older was recorded at 12,265,601 and we tried to calculate a representative sample size on behalf of the Korean older population. We recruited a total of 300 participants in the general sample and 205 participants in the separate sample, with a confidence interval of 95% and a margin of error of 3.5%. This study was conducted with technical assistance from Gallup Korea, a worldwide social research company. Korea is divided into 16 administrative divisions, and we allocated age and gender by each of these 16 administrative divisions. The general sample in this study was selected using quota sampling by age, gender, and region for residents aged 65–79 years in Korea. Additionally, a separate sample was selected using quote sampling by region for residents aged 65–79 years in Korea who had experience using health-related applications.
Older adults who met the age criteria were eligible to participate in the study and Gallup Korea provided explanations about the study over the phone or in person. If the sampled older adults agreed to participate, face-to-face survey were conducted and those who completed the survey were included.
Survey design
A cross-sectional survey was conducted for approximately four weeks, from June 23 to July 22, 2022. The survey was conducted anonymously and in-person. It was conducted as a tablet PC-assisted personal interview, and if a response was not provided, the participant was not allowed to move on to the next page. Interviewers received prior training, and an example card was used during the survey to enhance respondents’ understanding (Supplementary Fig. 1). A survey of the Internet, smartphones, and healthcare applications was conducted only for those who responded that they used these services.
Outcome measure
The primary outcomes were: 1) type of Internet service used; 2) ability to use smartphone services, purpose, and convenience of use; 3) type and convenience of healthcare application used; and 4) type and convenience of wearable devices used by older adults. The survey collected information on demographic characteristics, frailty, smartphone use, applications, healthcare applications, Internet use, and wearable device recognition and use. In our study, we did not distinguish between medical and general applications when inquiring about healthcare applications.
The demographic variables included sex, age, region, economic activity, educational status, whether there was someone to count on, and whether there was someone to help. Frailty was defined using the Korean version of the fatigue, resistance, ambulation, illnesses, and loss of weight (K-FRAIL) scale which is a validated tool for frailty diagnosis.16 In K-FRAIL, a score of 0 was considered normal, a score of 1–2 was considered pre-frail, and a score of 3–5 was
considered frail.
Internet, smart phone, application, healthcare application, and Internet use were each asked the following questions: “Are you currently using the Internet using an electronic device (laptop or desktop computer, smartphone, tablet PC, etc.)?”; “Which mobile phone terminal are you currently using, a smartphone or a regular phone?”; “Do you usually use smartphone applications (apps)?”; and “Are there any health-related applications (apps) among the smartphone applications (apps) that you usually use?” The services used allowed for duplicate responses, and convenience was assessed using a 5-point Likert scale. Up to two responses were provided regarding helpful areas.
Statistical analysis
We performed descriptive statistics on the respondents’ demographics. Numerical data were presented as numbers and percentages. The comparisons of groups were analyzed using the χ2 test and student’s t-test, as appropriate. Statistical significance was set at P <0.05. Statistical analyses were performed using STATA software (version 15.0; STATA Corp., College Station, TX, USA).
RESULTS
Baseline characteristics of survey participants
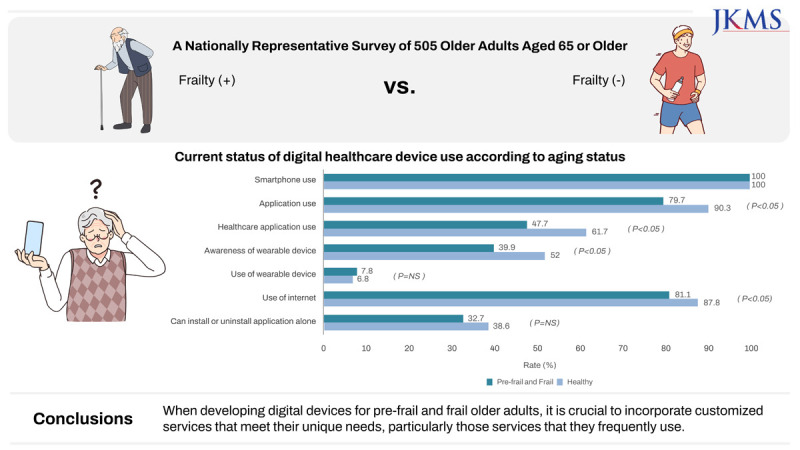
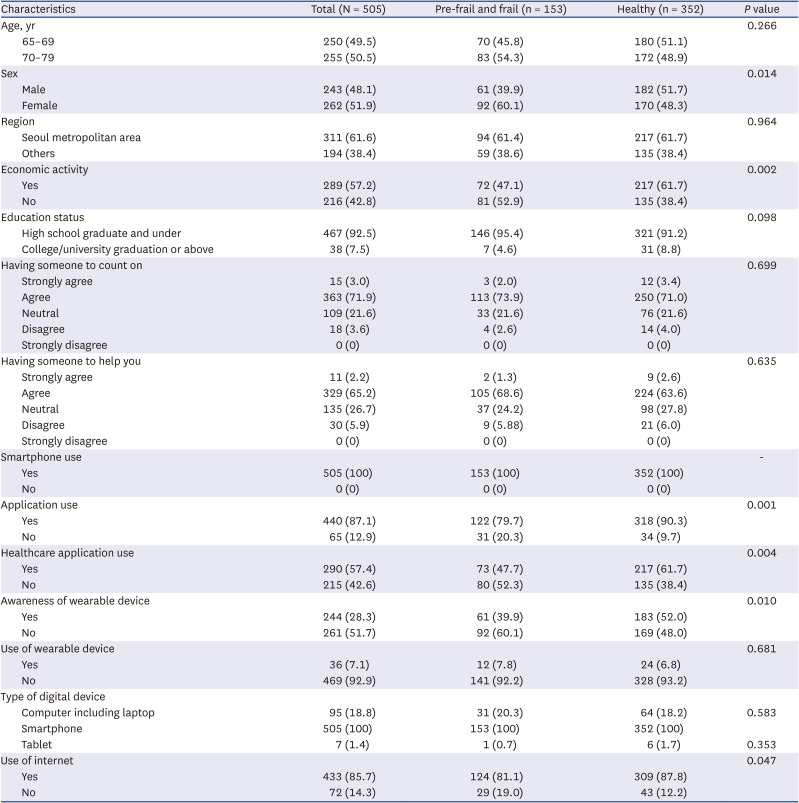
Among the 505 respondents, 153 (30.3%) were prefrail or frail older adults and 352 (69.7%) were healthy older adults. A total of 250 respondents (49.5%) were aged 65–69 years and 255 (50.5%) were aged 70–79 years. More respondents aged 70–79 (n = 83, 54.3%) than those aged 65–69 (n = 70, 45.8%) were pre-frail and frail; however, the difference was not significant (P = 0.27). Pre-frail and frail respondents included more women than healthy respondents (60.1% vs. 48.3%, P = 0.01), and fewer people were economically active (47.1% vs. 61.7%, P = 0.002). All respondents used smartphones, and the number of people using applications was 440 (87.1%), pre-frail and frail responses were 122 (79.7%), and 318 (90.3%) were healthy (P = 0.001). A total of 290 (57.4%) respondents used the healthcare application, among whom 73 (47.7%) were pre-frail and frail, and 217 (61.7%) were healthy (P = 0.004). A total of 36 (7.1%) respondents used wearable devices, and pre-frail and frail respondents were 12 (7.8%), and 24 (6.8%) were healthy (P = 0.68). Among the total respondents, 433 used the Internet, 124 (81.1%) were pre-frail and frail, and 309 (87.8%) were healthy (P = 0.05) (Table 1).
Table 1
Baseline characteristics according to frailty
Experience on internet usage according to frailty
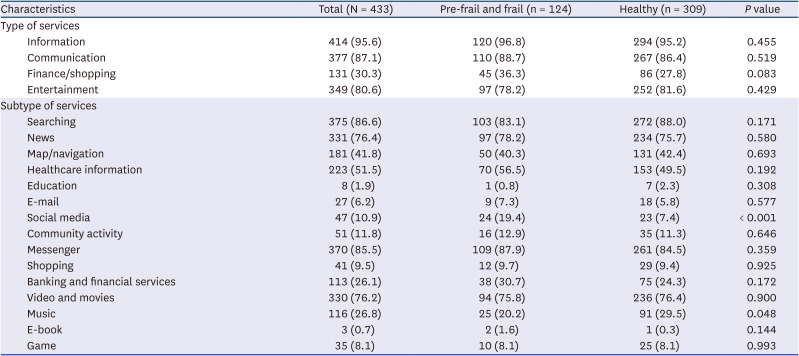
When surveying which Internet service was used, information services such as e-mail, searching, checking news, maps or navigation, obtaining health information, and taking online educational services were the most frequent, with 414 (95.6%), followed by communication services such as social media, online community activities, and messengers, which were used by 377 respondents (87.1%). There was no significant difference in the service use areas between pre-frail and frail respondents and healthy respondents. Among the detailed service areas, pre-frail or frail respondents used social media more frequently (19.4% vs. 7.4%, P < 0.001) and music less frequently than healthy respondents (20.2% vs. 29.5%, P = 0.048). There were no significant differences in the other service-use areas (Table 2).
Table 2
Use of internet services according to frailty
Experience on smartphone and application usage according to frailty
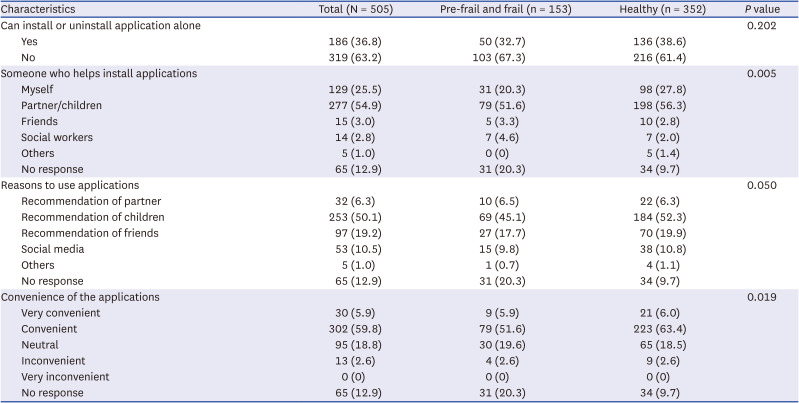
A total of 505 participants had experience using smartphones. There were 319 (63.2%) participants who could not install or uninstall applications on their smartphones. Among them, 103 (67.3%) pre-frail and frail respondents and 216 (61.4%) healthy respondents were not able to install or uninstall the application on their own (P = 0.20). Partners or children were the most common, with 277 (54.9%) people helping install applications, which was similar to 79 (51.6%) pre-frail and frail respondents and 198 (56.3%) healthy respondents. Regarding the reasons for using the smartphone application, the recommendation of children was the most common (253 respondents, 50.1%), followed by friends (97 respondents, 19.2%). This tendency was similar for pre-frail, frail, and healthy respondents. Regarding the convenience of the application, 30 respondents (5.9%) answered very convenient, 302 respondents (59.8%) stated it was convenient, and 95 respondents (18.8%) stated neutral, thus a total of 427 respondents (84.6%) responded positively. Among the pre-frail and frail respondents, 118 (77.1%) and 309 (87.8%) healthy respondents positively evaluated the convenience of healthcare applications (P = 0.02) (Table 3).
Table 3
Use of smartphone and application services according to frailty
Experience on healthcare application usage according to frailty
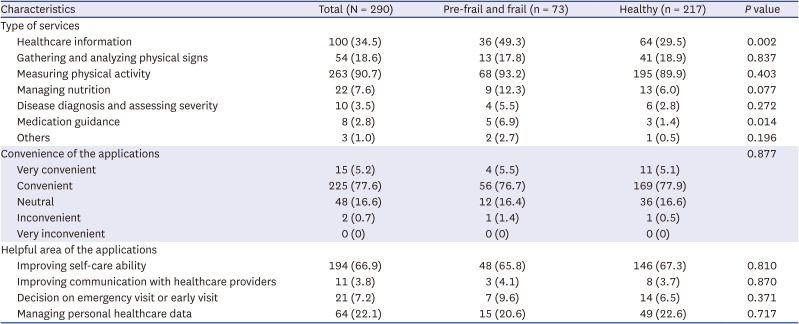
A total of 290 respondents (25.2%) used healthcare applications: 73 were pre-frail and frail, and 217 were healthy (74.8%). Among the respondents who used healthcare applications, 263 (90.7%) used them to measure physical activity, and 100 (34.5%) used them to obtain healthcare information. Pre-frail and frail respondents reported higher usage rates of obtaining healthcare information (49.3% vs. 29.5%, P = 0.002) and seeking medical guidance (6.9% vs. 1.4%, P = 0.014) compared to healthy respondents. For convenience, 288 (99.3%) respondents provided more than neutral positive evaluations. No difference was observed in the healthcare application convenience evaluation between pre-frail and frail respondents and healthy respondents (P = 0.877). Respondents answered that healthcare applications were most helpful in improving self-care ability (n = 194, 66.9%), followed by many responses that were helpful in managing personal healthcare data (n = 64, 22.1%). These results were similar for pre-frail, frail, and healthy respondents (Table 4).
Table 4
Use of healthcare application according to frailty
Experience on wearable device usage according to frailty
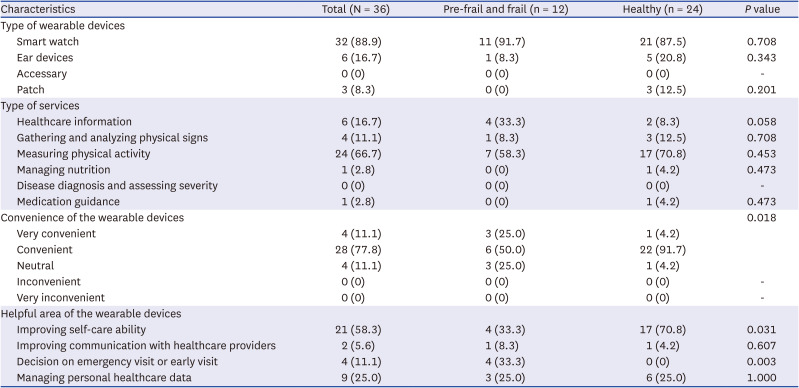
There were 36 wearable device users, of which 12 (33.3%) were pre-frail and frail, and 24 (66.7%) were healthy. Among the types of wearable devices, 32 (88.9%) used smart watches, followed by 6 (16.7%) using ear devices.
Among the pre-frail and frail respondents, 11 (91.7%) used a smart watch and 1 (8.3%) used an ear device. Among the healthy respondents, 21 (87.5%) used smartwatches and ear devices. Five respondents (20.8%) and three (12.5%) used patch-type wearable devices. Most respondents used wearable devices to measure physical activity (n = 24, 66.7%). Pre-frail and frail respondents most frequently used them to measure physical activity (n = 7, 58.3%), followed by those who used them to obtain healthcare information (n = 4, 33.3%). Healthy respondents most frequently used wearable devices to measure physical activity (n = 17, 70.8%), followed by those who used them to gather and analyze physical signs (n = 3, 12.5%). All respondents answered more than neutral about the convenience of wearable devices. Compared to pre-frail and frail respondents, healthy respondents were more likely to respond “very convenient” or “convenient” (75.0% vs. 95.9%, P = 0.018). As an area where wearable devices were helpful, respondents reported the greatest improvement in self-care ability (n = 21, 58.3%). For pre-frail and frail respondents, there were fewer responses of improving self-care ability compared to healthy participants (33.3% vs. 70.8%, P = 0.031), and more responses to decisions on emergency visits or early visits. (33.3% vs. 0%, P = 0.003) (Table 5).
Table 5
Use of wearable devices according to frailty
DISCUSSION
In this nationwide cross-sectional study, we confirmed that older adults in Korea have a very high smartphone usage rate, and that the application or mobile phone usage rate is over 80%. Among the Internet services, information services were used most frequently, followed by communication services. Among the specific services, pre-frail or frail respondents used social media more than healthy respondents. Among the all respondents, 63.2% were able to install or delete applications on their smartphones alone, and their partners and children were their main supporters. There were no differences between pre-frail, frail, and healthy respondents. Healthcare applications were used most for physical activity measurement, and in the case of pre-frail and frail respondents, more people used them to obtain healthcare information or medical guidance than the healthy respondents. Very few people use wearable devices, and most use smartwatches. Regarding the purpose of the questionnaire, measuring physical activity was the most common response among pre-frail, frail, and healthy respondents. Healthy respondents responded more positively to smartphone applications and wearable devices than pre-frail or frail respondents.
To the best of our knowledge, our study is the first to compare digital health technology utilization, and the purpose of digital health technology utilization between pre-frail or frail older adults and healthy older adults. In our study, the older adults’ use of digital devices, especially smartphones, was very high, which is similar to the findings of other surveys. In a previous study, the proportion of older adults using smart devices among older adults in Korea was 81.6%, which was lower than that in our study.17 This may be due to the rapid spread of smartphones. In the same study, the value in 2021 increased by 4.5% compared to that in 2020. Therefore, it is thought that it will increase further in 2022 when our study was conducted.1517 Another reason may be that older adults’ use of digital devices is heterogeneous, depending on country, culture, and socio-economic factors.18192021 The smartphone usage rate of older adults in 2021 in the United States was 63%, and that of those with laptops or computers reached 90%.422 In a Dutch study, older adults used new technologies less, and the use of information and communications technology decreased as the level of education, income, and physical functioning decreased.23
Few studies have been conducted on the purposes and abilities of older adults to use applications.
In a national survey conducted in Korea in 2021, 48% of older adults responded that they could install and use the needed application.17 In a qualitative study, it was confirmed that support from family members, such as giving motivation, practical advice, and co-use, affects the use of digital devices by older adults, and reported that older adults can also influence each other.18 It was similar to the results of our study that family members influence application use. In addition, because older adults want to share their usage experiences and information with their families, the role of the family is more prominent than that of younger adults.24
Reasons for using digital devices by older adults were e-mail use,23 gathering information,25 online shopping, leisure or entertainment, communication,1026 and education20 in previous studies,27 which is similar to our research results. However, to the best of our knowledge, no study has confirmed which of the purposes of using applications is more common, as in our study; therefore, it is thought that our study will be helpful for future research on digital devices.
Our study found that pre-frail and frail respondents had lower usage rates of applications and wearable devices compared to healthy respondents. Additionally, there was a difference between pre-frail and frail respondents and healthy respondents in terms of purpose and satisfaction with using healthcare applications or wearable devices. This result aligns with findings from previous studies. Studies on the use of digital devices by older adults have mainly examined whether there are differences in usage patterns according to age or socioeconomic status; there have been few studies on digital device usage according to frailty. One study reported that older adults with good functional status measured by instrumental activities of daily living were more likely to use digital devices.28 In another study of heart failure patients, according to the New York Heart Association class, reported that the more severe the heart failure symptoms, the lower the participation rate in digital health research.21
This study had several limitations. First, the population eligible to participate in the study was limited to those who spoke and lived in Korean. As digital device use varies by country or culture, our results have limited generalizability to other populations. Second, the study participants were recruited by stratifying the Korean population according to age, gender, and region. A selection bias may have arisen because the participants were given the opportunity to decide to participate in this study. Third, in measuring frailty using only the K-FRAIL questionnaire without physical measurements such as handgrip strength, gait, and balance, frailty judgment may be somewhat inaccurate depending on the respondent’s answer. Fourth, in our study, many participants responded that healthcare applications and wearable devices are helpful in personal healthcare data management. Given that wearable devices may be more favorable for collecting data, further research is needed to demonstrate the impact of lower wearable device adoption among older adults on their use of application technologies. Finally, in our study, although survey staff verified actual usage, we were unable to confirm to what extent the participants utilized the applications or the specific features they used. We identified the current situation through a survey, but we believe that a more in-depth analysis will be needed in the future. Nevertheless, this study comprehensively investigated the status of digital device use, purpose of use, and satisfaction according to frailty, and will be helpful in future digital device research for frail older adults.
In conclusion, among older adults in Korea, the usage rate of digital devices, including mobile phones, is high, whereas that of wearable devices is low. There was a difference in the services used by pre-frail and frail respondents and healthy respondents. Therefore, when developing digital devices for pre-frail and frail older adults, it is crucial to incorporate customized services that meet their unique needs, particularly those services that they frequently use.
 XML Download